Schematic overview of the cellular and molecular mechanisms involved in the cancer progression, including the proposed cellular and molecular mechanisms in cancer cells trajectory. AT1: alveolar type 1 cells; AT2: alveolar type 2 cells; AAH: atypical adenomatous hyperplasia; AIS: adenocarcinoma in situ; MIA: minimally invasive adenocarcinoma; IA: invasive adenocarcinoma; EMT: epithelial-mesenchymal transition

Home

Download

Statistics

Help

Contact

Center for Computational Systems Medicine
leaf

Gene summary

leaf

Malignant transformation analysis

leaf

Malignant transformation related pathway analysis

leaf

Cell-cell communication analysis

leaf

Single-cell gene regulatory network inference analysis

leaf

Somatic mutation of malignant transformation related genes

leaf

Related drugs of malignant transformation related genes

Gene: SRRT

Gene summary for SRRT

check button Gene summary.

Gene informationSpeciesHuman
Gene symbol

SRRT

Gene ID

51593

Gene nameserrate, RNA effector molecule
Gene AliasARS2
Cytomap7q22.1
Gene Typeprotein-coding
GO ID

GO:0006139

UniProtAcc

Q9BXP5


Top

Malignant transformation analysis

check button Identification of the aberrant gene expression in precancerous and cancerous lesions by comparing the gene expression of stem-like cells in diseased tissues with normal stem cells
check button Malignant transformation involving gene list.
Entrez IDSymbolReplicatesSpeciesOrganTissueAdj P-valueLog2FCMalignancy
51593SRRTLZE4THumanEsophagusESCC1.17e-093.78e-010.0811
51593SRRTLZE7THumanEsophagusESCC8.00e-147.79e-010.0667
51593SRRTLZE8THumanEsophagusESCC9.28e-142.57e-010.067
51593SRRTLZE20THumanEsophagusESCC3.37e-041.84e-010.0662
51593SRRTLZE21D1HumanEsophagusHGIN9.57e-032.26e-010.0632
51593SRRTLZE22THumanEsophagusESCC1.27e-185.90e-010.068
51593SRRTLZE24THumanEsophagusESCC4.12e-194.91e-010.0596
51593SRRTLZE21THumanEsophagusESCC1.33e-035.75e-010.0655
51593SRRTLZE6THumanEsophagusESCC1.63e-074.23e-010.0845
51593SRRTP1T-EHumanEsophagusESCC1.02e-147.65e-010.0875
51593SRRTP2T-EHumanEsophagusESCC2.48e-611.15e+000.1177
51593SRRTP4T-EHumanEsophagusESCC5.65e-236.35e-010.1323
51593SRRTP5T-EHumanEsophagusESCC6.72e-153.62e-010.1327
51593SRRTP8T-EHumanEsophagusESCC7.59e-296.05e-010.0889
51593SRRTP9T-EHumanEsophagusESCC1.55e-194.54e-010.1131
51593SRRTP10T-EHumanEsophagusESCC4.16e-306.51e-010.116
51593SRRTP11T-EHumanEsophagusESCC3.17e-166.20e-010.1426
51593SRRTP12T-EHumanEsophagusESCC1.13e-408.01e-010.1122
51593SRRTP15T-EHumanEsophagusESCC8.20e-338.48e-010.1149
51593SRRTP16T-EHumanEsophagusESCC3.37e-429.37e-010.1153
Page: 1 2 3 4 5 6 7 

check button Transcriptomic changes along malignancy continuum.
TissueExpression DynamicsAbbreviation
EsophagusThe image shows the transcriptomic changes along malignancy continuum.log2FC in expression of this searched gene in stem-like cells from each diseased tissue sample relative to stem-like cells in normal samples in each tissue plotted against the malignancy continuum. Samples are colored based on if they are from different disease stage.
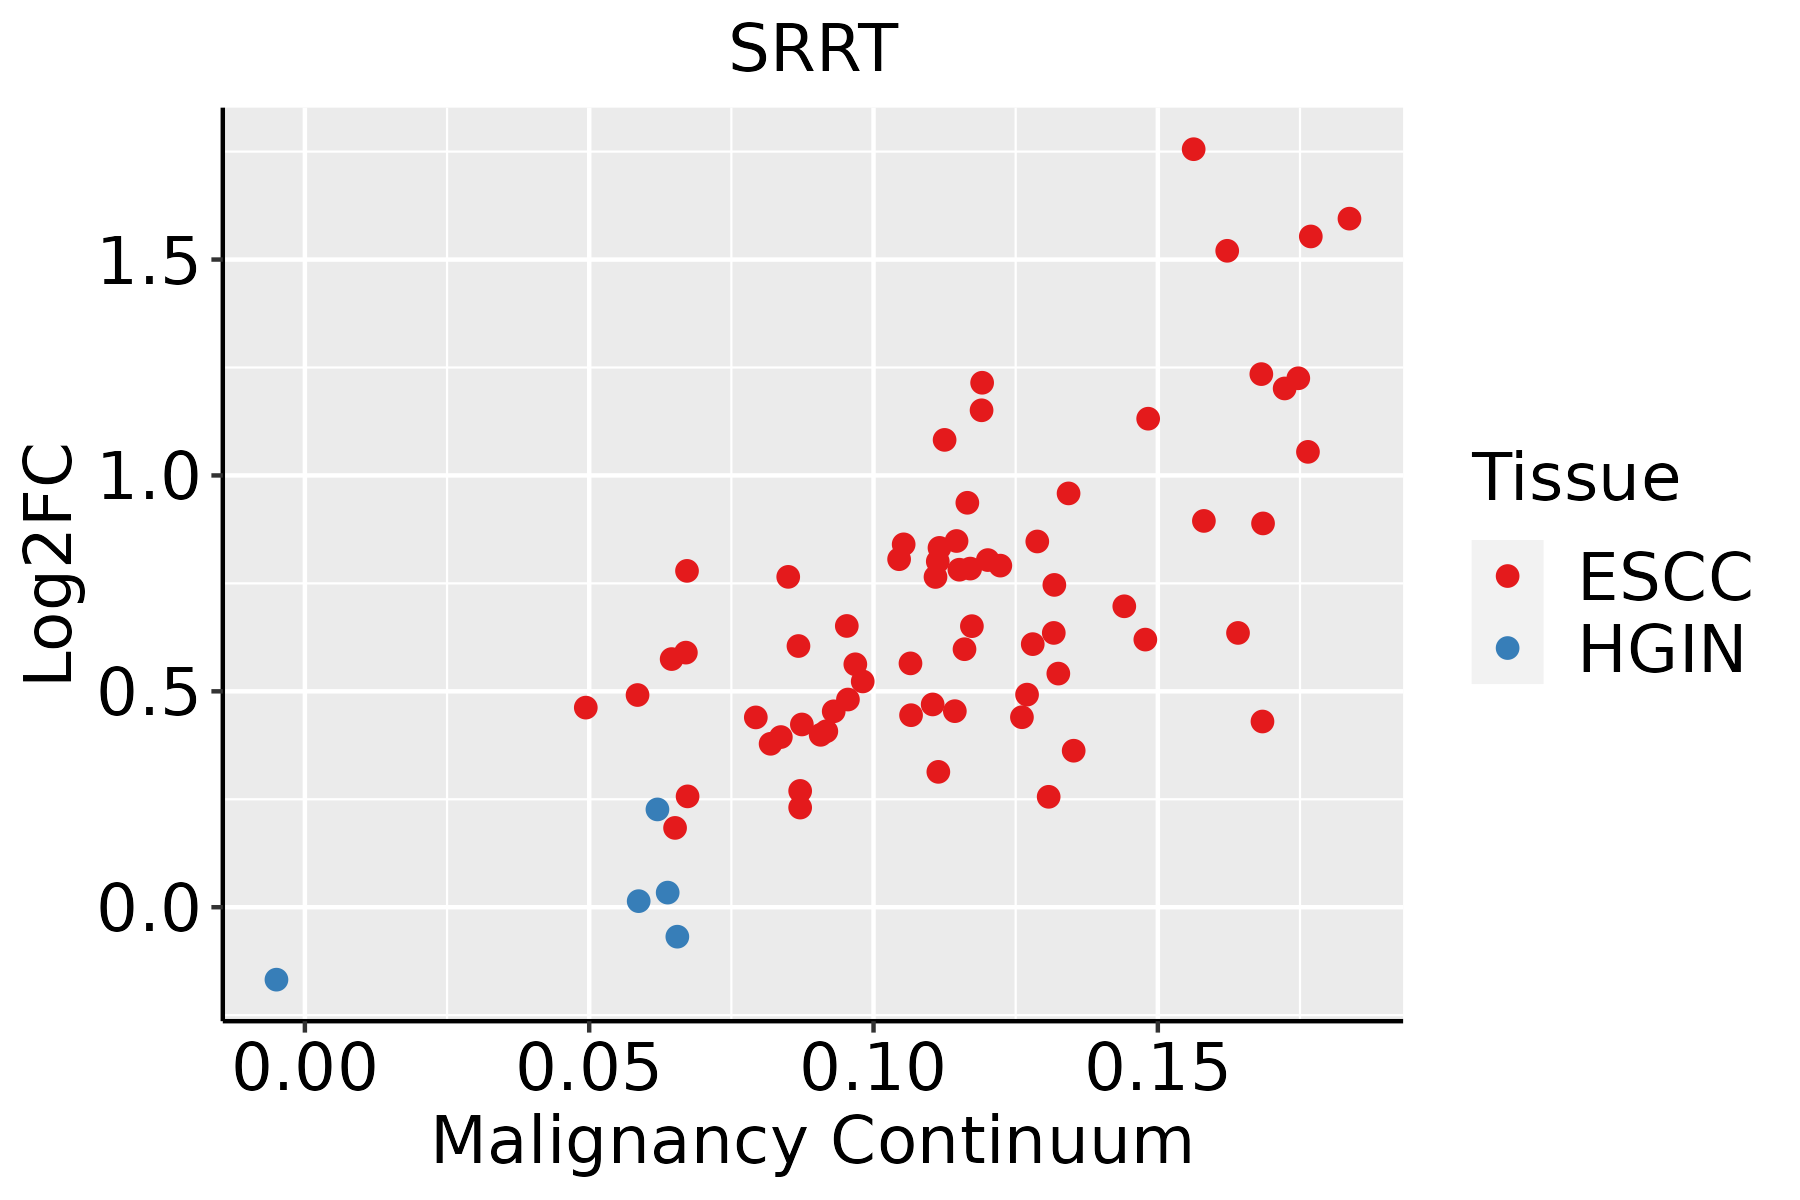
ESCC: Esophageal squamous cell carcinoma
HGIN: High-grade intraepithelial neoplasias
LGIN: Low-grade intraepithelial neoplasias
LiverThe image shows the transcriptomic changes along malignancy continuum.log2FC in expression of this searched gene in stem-like cells from each diseased tissue sample relative to stem-like cells in normal samples in each tissue plotted against the malignancy continuum. Samples are colored based on if they are from different disease stage.HCC: Hepatocellular carcinoma
NAFLD: Non-alcoholic fatty liver disease
Oral CavityThe image shows the transcriptomic changes along malignancy continuum.log2FC in expression of this searched gene in stem-like cells from each diseased tissue sample relative to stem-like cells in normal samples in each tissue plotted against the malignancy continuum. Samples are colored based on if they are from different disease stage.
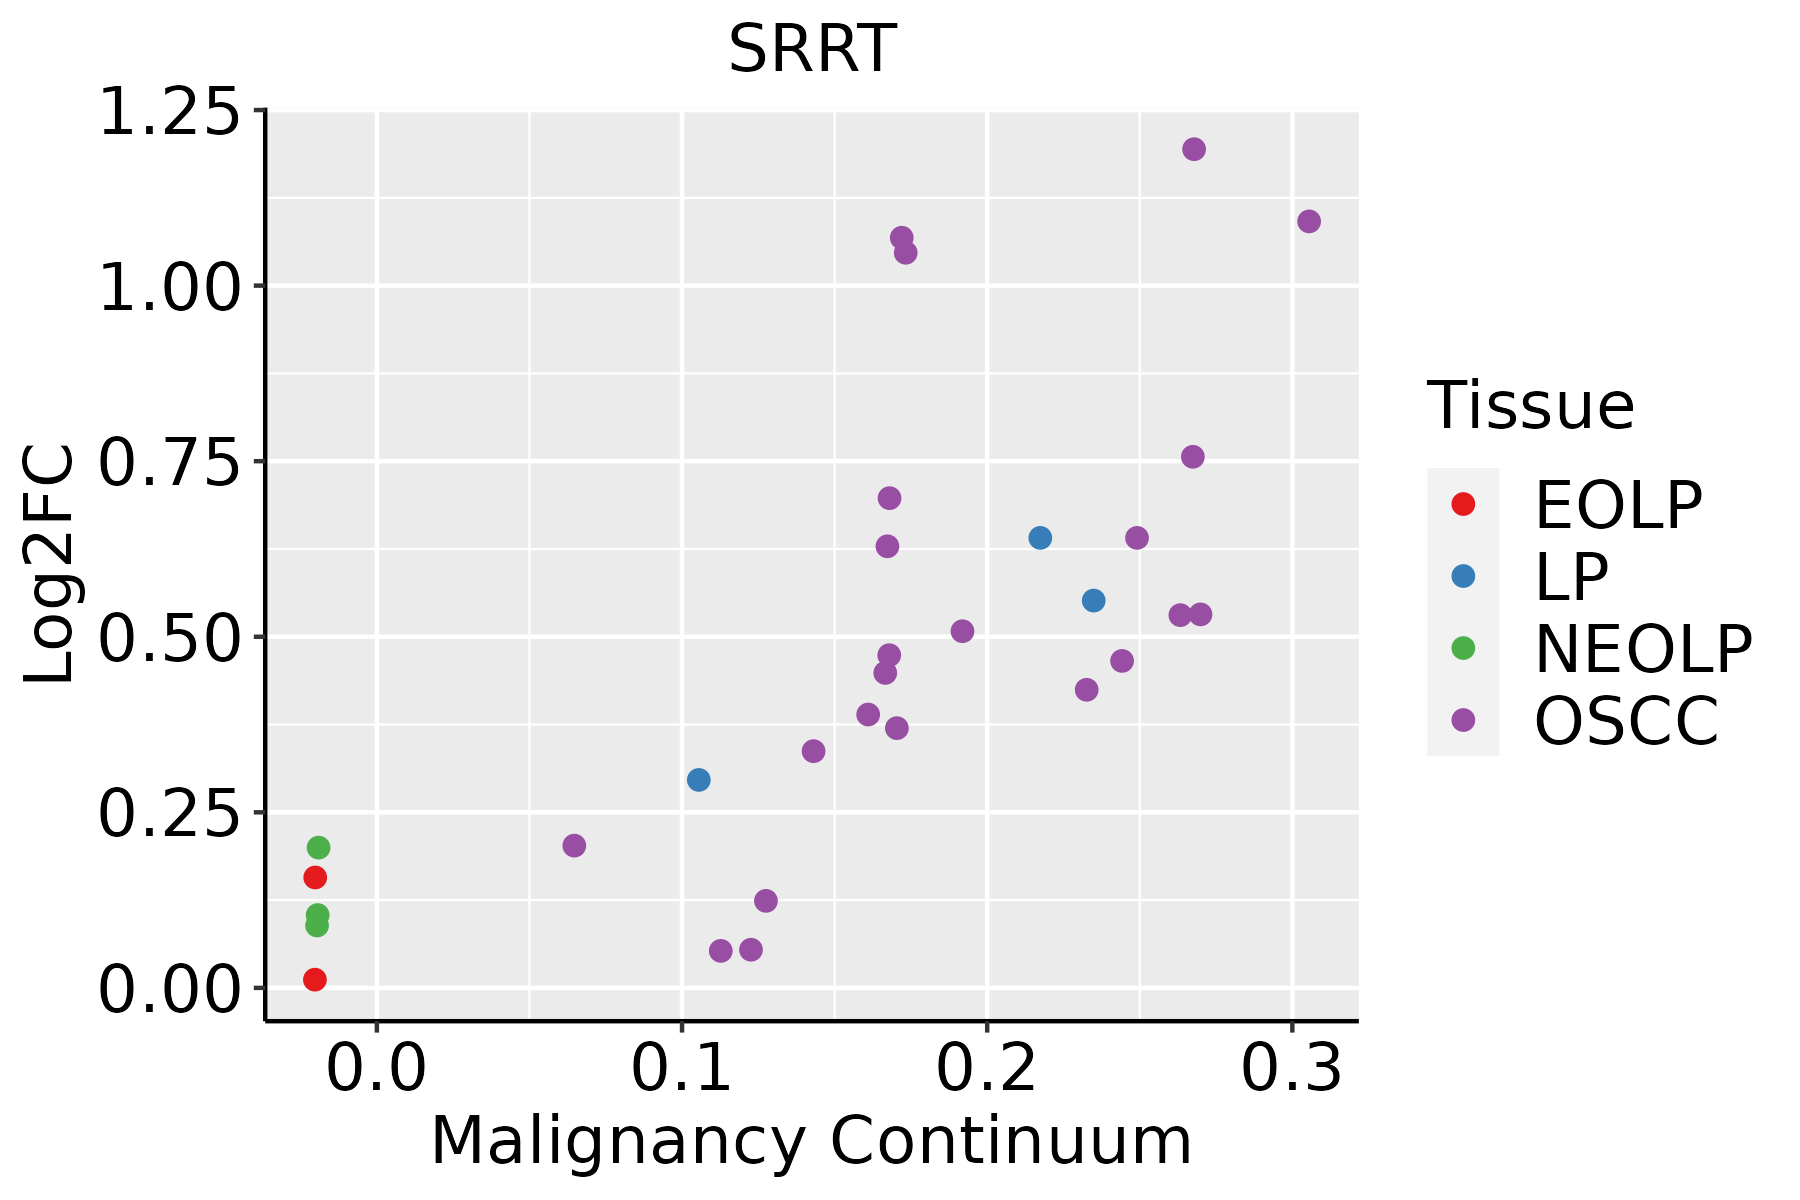
EOLP: Erosive Oral lichen planus
LP: leukoplakia
NEOLP: Non-erosive oral lichen planus
OSCC: Oral squamous cell carcinoma
ProstateThe image shows the transcriptomic changes along malignancy continuum.log2FC in expression of this searched gene in stem-like cells from each diseased tissue sample relative to stem-like cells in normal samples in each tissue plotted against the malignancy continuum. Samples are colored based on if they are from different disease stage.BPH: Benign Prostatic Hyperplasia
SkinThe image shows the transcriptomic changes along malignancy continuum.log2FC in expression of this searched gene in stem-like cells from each diseased tissue sample relative to stem-like cells in normal samples in each tissue plotted against the malignancy continuum. Samples are colored based on if they are from different disease stage.
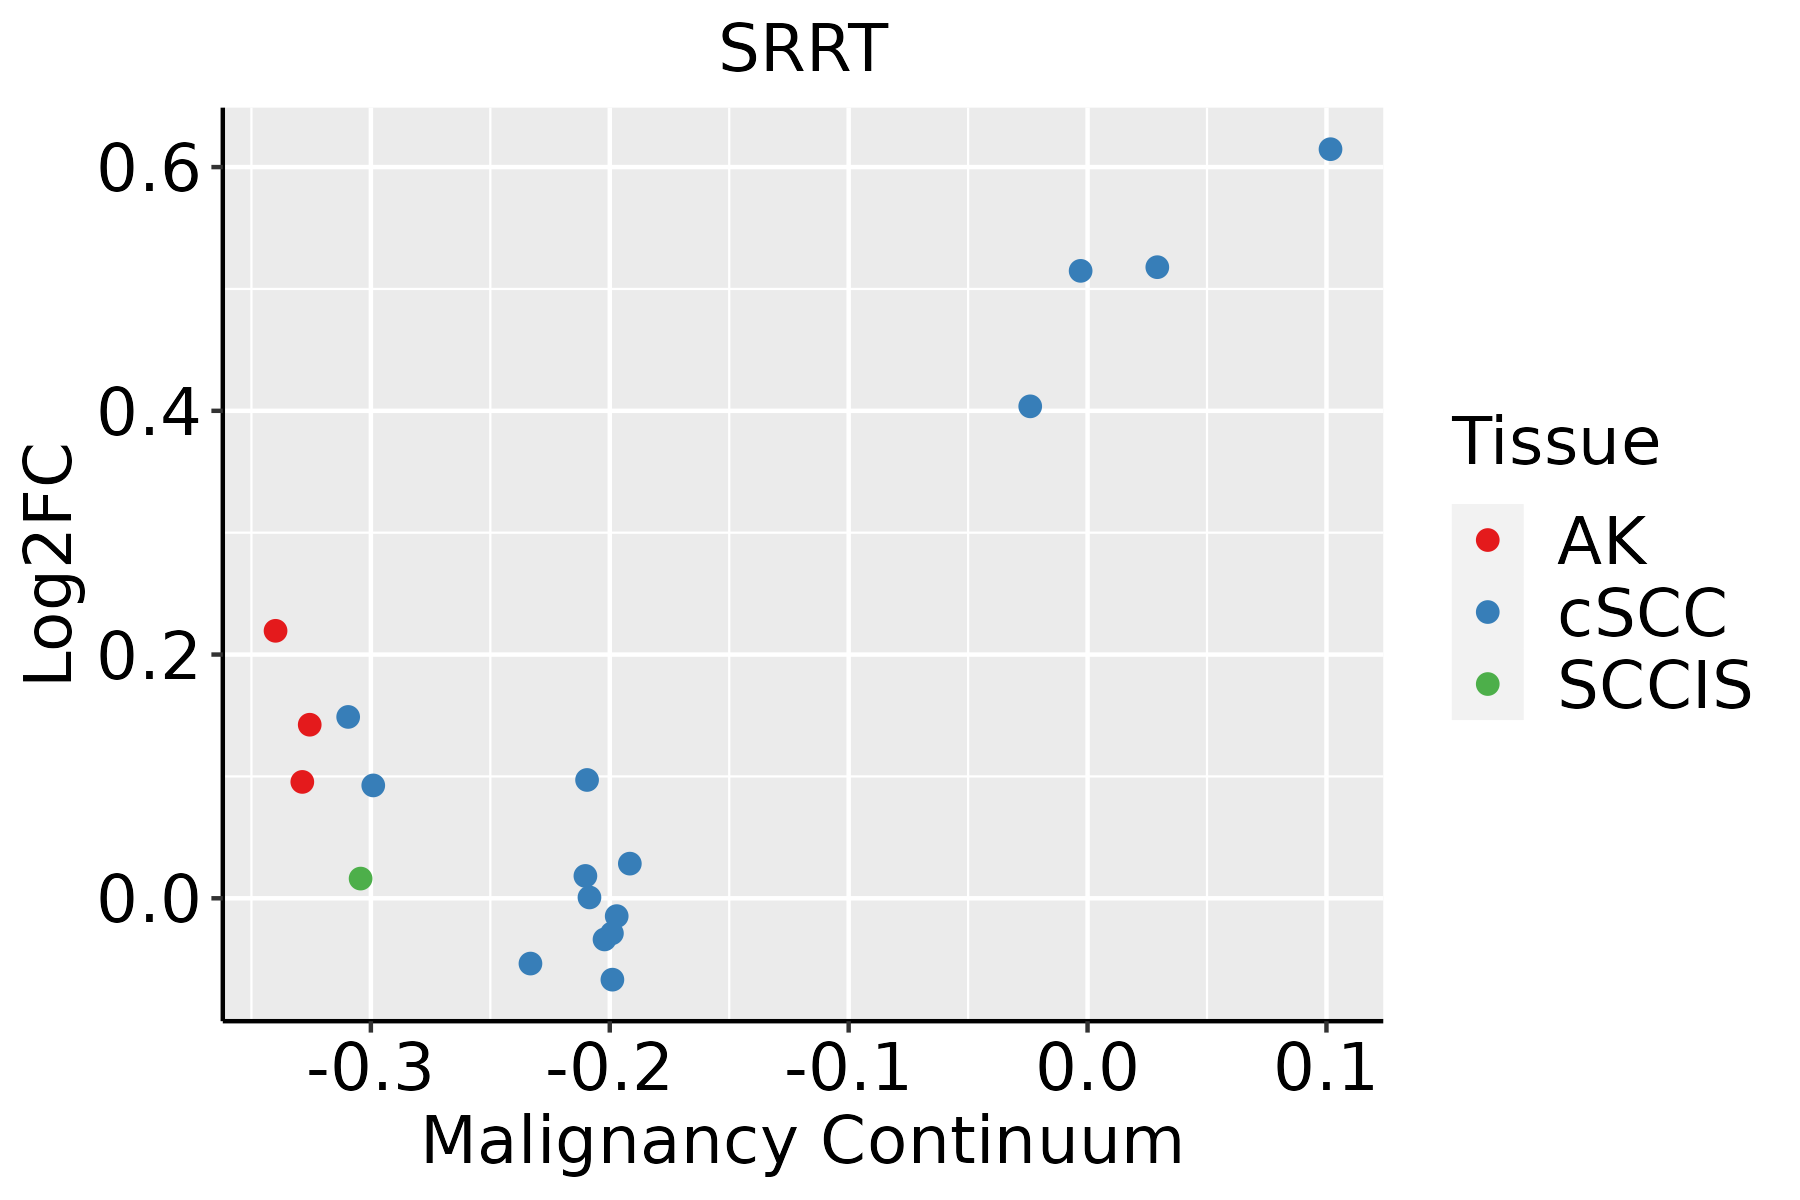
AK: Actinic keratosis
cSCC: Cutaneous squamous cell carcinoma
SCCIS:squamous cell carcinoma in situ
ThyroidThe image shows the transcriptomic changes along malignancy continuum.log2FC in expression of this searched gene in stem-like cells from each diseased tissue sample relative to stem-like cells in normal samples in each tissue plotted against the malignancy continuum. Samples are colored based on if they are from different disease stage.
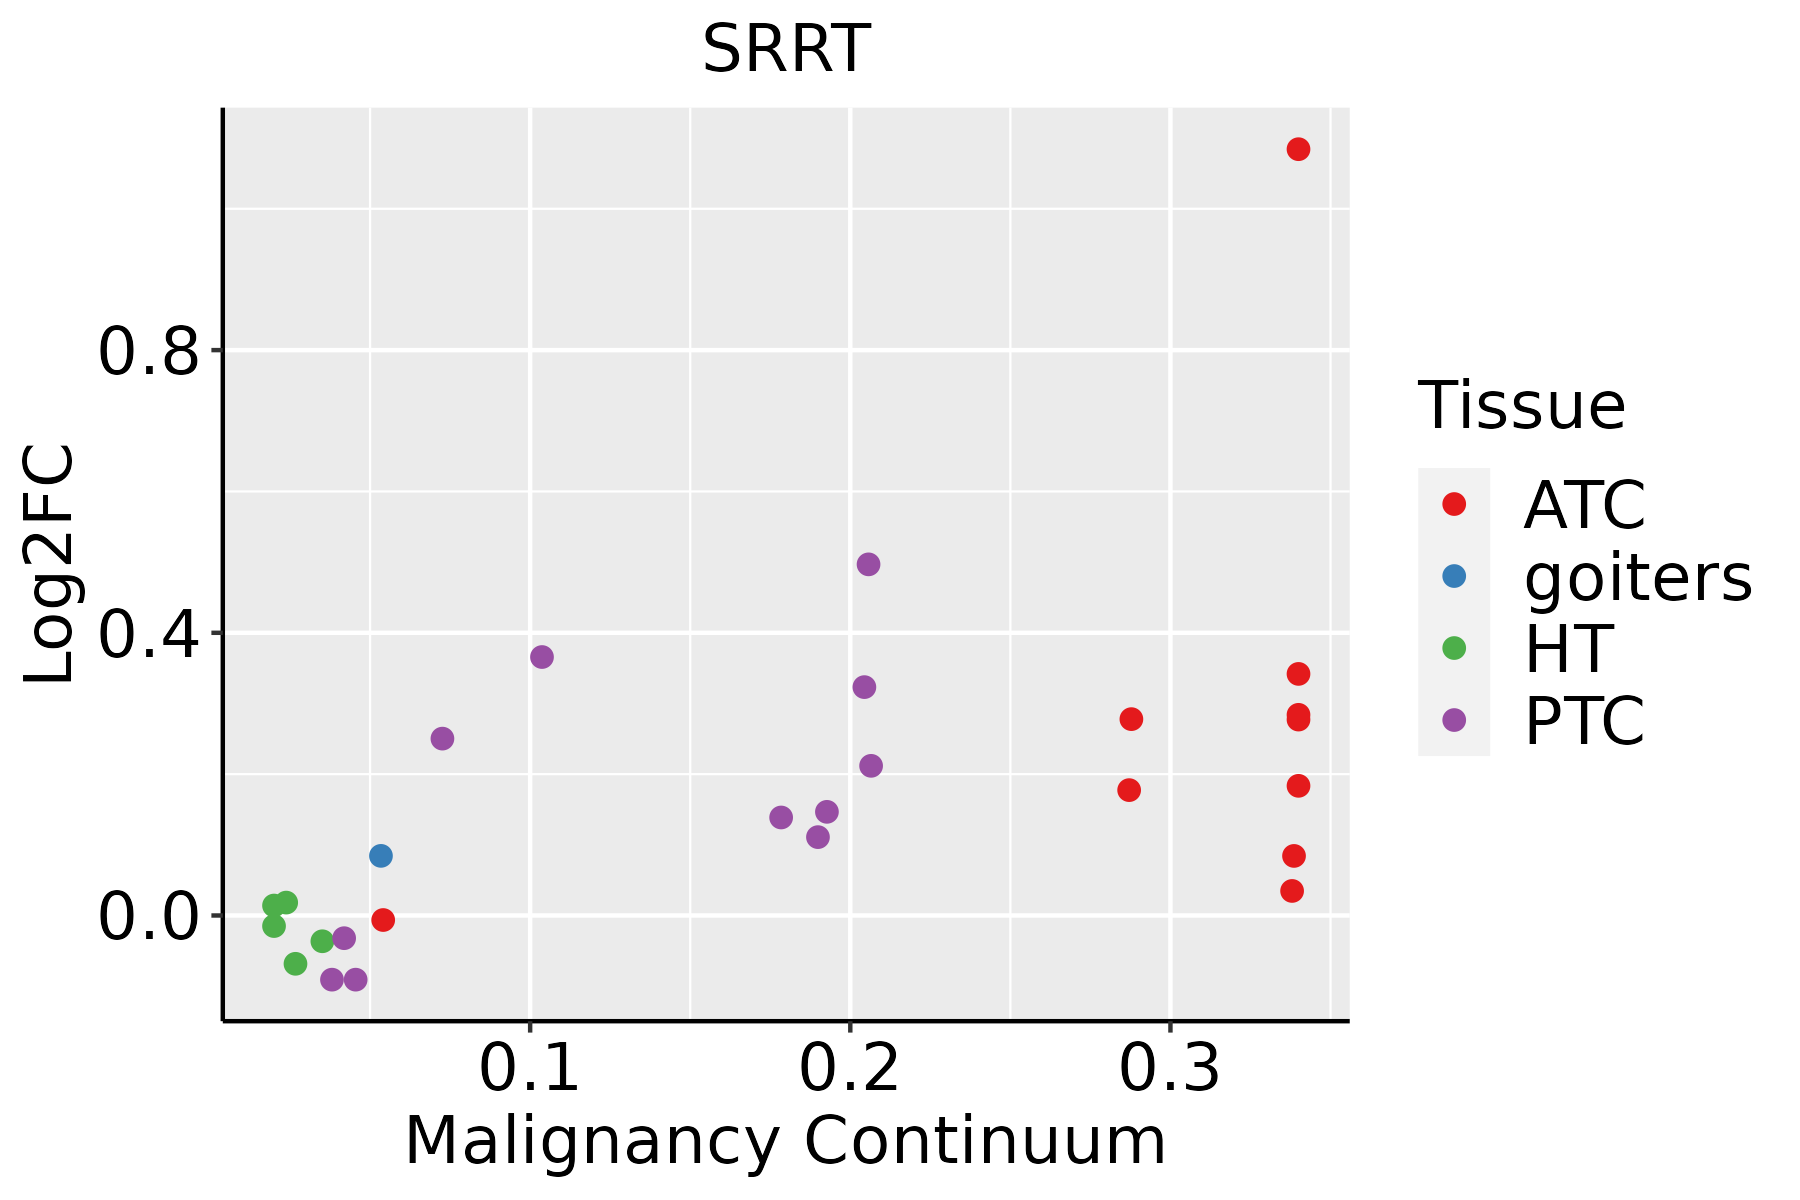
ATC: Anaplastic thyroid cancer
HT: Hashimoto's thyroiditis
PTC: Papillary thyroid cancer
∗log2FC in expression of this searched gene in stem-like cells from each diseased tissue sample relative to stem-like cells in normal samples in each tissue plotted against the malignancy continuum. Samples are colored based on if they are from different disease stage.

Top

Malignant transformation related pathway analysis

check buttonFind out the enriched GO biological processes and KEGG pathways involved in transition from healthy to precancer to cancer
check button Figure of enriched GO biological processes.
TissueDisease StageEnriched GO biological Processes
ColorectumADGO analysis - Figure of enriched GO biological processes: Top 15 enriched GO BP terms are showed in the bar plot of each disease state in each tissue. Each row represents a significant GO biological process which is colored according to the -log10(p.adjust).
ColorectumSERGO analysis - Figure of enriched GO biological processes: Top 15 enriched GO BP terms are showed in the bar plot of each disease state in each tissue. Each row represents a significant GO biological process which is colored according to the -log10(p.adjust).
ColorectumMSSGO analysis - Figure of enriched GO biological processes: Top 15 enriched GO BP terms are showed in the bar plot of each disease state in each tissue. Each row represents a significant GO biological process which is colored according to the -log10(p.adjust).
ColorectumMSI-HGO analysis - Figure of enriched GO biological processes: Top 15 enriched GO BP terms are showed in the bar plot of each disease state in each tissue. Each row represents a significant GO biological process which is colored according to the -log10(p.adjust).
ColorectumFAPGO analysis - Figure of enriched GO biological processes: Top 15 enriched GO BP terms are showed in the bar plot of each disease state in each tissue. Each row represents a significant GO biological process which is colored according to the -log10(p.adjust).
∗Top 15 enriched GO BP terms are showed in the bar plot of each disease state in each tissue. Each row represents a significant GO biological process which is colored according to the -log10(p.adjust).
Page: 1 2 3 4 5 6 7 8 9 

check button Enriched GO biological processes.
GO IDTissueDisease StageDescriptionGene RatioBg Ratiopvaluep.adjustCount
GO:005076914ThyroidPTCpositive regulation of neurogenesis105/5968225/187232.28e-063.05e-05105
GO:005076716ThyroidPTCregulation of neurogenesis156/5968364/187235.86e-067.05e-05156
GO:004668517ThyroidPTCresponse to arsenic-containing substance23/596833/187239.16e-061.04e-0423
GO:005196214ThyroidPTCpositive regulation of nervous system development117/5968272/187236.72e-055.89e-04117
GO:00519608ThyroidPTCregulation of nervous system development177/5968443/187231.72e-041.32e-03177
GO:009872710ThyroidPTCmaintenance of cell number63/5968134/187231.73e-041.32e-0363
GO:00198279ThyroidPTCstem cell population maintenance61/5968131/187233.01e-042.12e-0361
GO:003519616ThyroidPTCproduction of miRNAs involved in gene silencing by miRNA28/596852/187238.33e-045.13e-0328
GO:003105010ThyroidPTCdsRNA processing28/596854/187231.79e-039.68e-0328
GO:007091810ThyroidPTCproduction of small RNA involved in gene silencing by RNA28/596854/187231.79e-039.68e-0328
GO:003447021ThyroidATCncRNA processing216/6293395/187233.14e-183.98e-16216
GO:003466021ThyroidATCncRNA metabolic process240/6293485/187232.03e-139.91e-12240
GO:001072022ThyroidATCpositive regulation of cell development146/6293298/187232.36e-084.56e-07146
GO:005076922ThyroidATCpositive regulation of neurogenesis112/6293225/187233.53e-075.21e-06112
GO:005076723ThyroidATCregulation of neurogenesis168/6293364/187233.73e-075.48e-06168
GO:005196014ThyroidATCregulation of nervous system development195/6293443/187232.62e-063.06e-05195
GO:004668523ThyroidATCresponse to arsenic-containing substance24/629333/187234.98e-065.40e-0524
GO:009872722ThyroidATCmaintenance of cell number70/6293134/187236.45e-066.69e-0570
GO:005196221ThyroidATCpositive regulation of nervous system development126/6293272/187238.17e-068.27e-05126
GO:001982722ThyroidATCstem cell population maintenance67/6293131/187232.48e-052.16e-0467
Page: 1 2 3 4 5 6 7 8 

check button Enriched KEGG pathways.
Pathway IDTissueDisease StageDescriptionGene RatioBg Ratiopvaluep.adjustqvalueCount
Page: 1 

Top

Cell-cell communication analysis

check buttonIdentification of potential cell-cell interactions between two cell types and their ligand-receptor pairs for different disease states
LigandReceptorLRpairPathwayTissueDisease Stage
Page: 1 

Top

Single-cell gene regulatory network inference analysis

check buttonFind out the significant the regulons (TFs) and the target genes of each regulon across cell types for different disease states
TFCell TypeTissueDisease StageTarget GeneRSSRegulon Activity
∗The dot plots of a searched regulon are shown for all cell subpopulations in each disease state of each tissue based on the regulon specific score inferred using pySCENIC and by calculating the average expression.
Page: 1 

Top

Somatic mutation of malignant transformation related genes

check buttonAnnotation of somatic variants for genes involved in malignant transformation
Hugo SymbolVariant ClassVariant ClassificationdbSNP RSHGVScHGVSpHGVSp ShortSWISSPROTBIOTYPESIFTPolyPhenTumor Sample BarcodeTissueHistologySexAgeStageTherapy TypesDrugsOutcome
SRRTSNVMissense_Mutationc.367A>Tp.Met123Leup.M123LQ9BXP5protein_codingtolerated(0.73)benign(0)TCGA-A7-A0CE-01Breastbreast invasive carcinomaFemale<65I/IIChemotherapyadriamycinSD
SRRTSNVMissense_Mutationc.2546N>Gp.Pro849Argp.P849RQ9BXP5protein_codingtolerated(0.15)benign(0.151)TCGA-A7-A0DA-01Breastbreast invasive carcinomaFemale<65I/IIChemotherapyadriamycinSD
SRRTSNVMissense_Mutationc.2467C>Tp.Pro823Serp.P823SQ9BXP5protein_codingtolerated(0.08)benign(0.157)TCGA-A8-A095-01Breastbreast invasive carcinomaFemale<65I/IIChemotherapy5-fluorouracilCR
SRRTSNVMissense_Mutationrs201528871c.1801N>Tp.Arg601Trpp.R601WQ9BXP5protein_codingdeleterious(0)possibly_damaging(0.544)TCGA-AR-A24Q-01Breastbreast invasive carcinomaFemale<65I/IIChemotherapydoxorubicinSD
SRRTSNVMissense_Mutationnovelc.456N>Gp.Phe152Leup.F152LQ9BXP5protein_codingtolerated(0.38)probably_damaging(0.973)TCGA-BH-A0B6-01Breastbreast invasive carcinomaFemale<65I/IIUnknownUnknownSD
SRRTSNVMissense_Mutationrs199528372c.2242N>Ap.Ala748Thrp.A748TQ9BXP5protein_codingtolerated(0.36)benign(0.041)TCGA-E9-A22H-01Breastbreast invasive carcinomaFemale<65I/IIChemotherapydoxorubicinSD
SRRTinsertionFrame_Shift_Insnovelc.800_801insATCCCp.Leu268SerfsTer30p.L268Sfs*30Q9BXP5protein_codingTCGA-A8-A08T-01Breastbreast invasive carcinomaFemale<65III/IVUnknownUnknownPD
SRRTSNVMissense_Mutationc.118N>Ap.Asp40Asnp.D40NQ9BXP5protein_codingdeleterious(0.05)benign(0.227)TCGA-C5-A1BQ-01Cervixcervical & endocervical cancerFemale>=65III/IVChemotherapycisplatinCR
SRRTSNVMissense_Mutationc.2230N>Gp.Lys744Glup.K744EQ9BXP5protein_codingtolerated(0.05)possibly_damaging(0.85)TCGA-C5-A1M6-01Cervixcervical & endocervical cancerFemale<65I/IIChemotherapycisplatinPD
SRRTSNVMissense_Mutationc.2594G>Ap.Arg865Glnp.R865QQ9BXP5protein_codingdeleterious(0.01)probably_damaging(0.953)TCGA-C5-A1MH-01Cervixcervical & endocervical cancerFemale>=65III/IVChemotherapycisplatinPD
Page: 1 2 3 4 5 6 7 8 9 10 11 12 

Top

Related drugs of malignant transformation related genes

check buttonIdentification of chemicals and drugs interact with genes involved in malignant transfromation
(DGIdb 4.0)
Entrez IDSymbolCategoryInteraction TypesDrug Claim NameDrug NamePMIDs
Page: 1