
|
|||||
|
 | |
| |
| |
| |
| |
| |
|
Gene: SIX1 |
Gene summary for SIX1 |
| Gene information | Species | Human | Gene symbol | SIX1 | Gene ID | 6495 |
| Gene name | SIX homeobox 1 | |
| Gene Alias | BOS3 | |
| Cytomap | 14q23.1 | |
| Gene Type | protein-coding | GO ID | GO:0000122 | UniProtAcc | Q15475 |
Top |
Malignant transformation analysis |
| Identification of the aberrant gene expression in precancerous and cancerous lesions by comparing the gene expression of stem-like cells in diseased tissues with normal stem cells |
| Entrez ID | Symbol | Replicates | Species | Organ | Tissue | Adj P-value | Log2FC | Malignancy |
| 6495 | SIX1 | GSM4909285 | Human | Breast | IDC | 4.96e-49 | 6.69e-01 | 0.21 |
| 6495 | SIX1 | GSM4909286 | Human | Breast | IDC | 3.85e-08 | 1.72e-01 | 0.1081 |
| 6495 | SIX1 | GSM4909289 | Human | Breast | IDC | 6.15e-05 | 2.84e-01 | 0.1064 |
| 6495 | SIX1 | GSM4909290 | Human | Breast | IDC | 5.92e-12 | 2.65e-01 | 0.2096 |
| 6495 | SIX1 | GSM4909291 | Human | Breast | IDC | 1.38e-09 | 2.62e-01 | 0.1753 |
| 6495 | SIX1 | GSM4909293 | Human | Breast | IDC | 1.19e-30 | 4.61e-01 | 0.1581 |
| 6495 | SIX1 | GSM4909294 | Human | Breast | IDC | 1.79e-07 | 1.91e-01 | 0.2022 |
| 6495 | SIX1 | GSM4909298 | Human | Breast | IDC | 2.52e-23 | 4.03e-01 | 0.1551 |
| 6495 | SIX1 | GSM4909306 | Human | Breast | IDC | 1.77e-06 | 1.59e-01 | 0.1564 |
| 6495 | SIX1 | GSM4909312 | Human | Breast | IDC | 8.07e-06 | 2.27e-01 | 0.1552 |
| 6495 | SIX1 | GSM4909313 | Human | Breast | IDC | 1.84e-02 | 1.44e-01 | 0.0391 |
| 6495 | SIX1 | GSM4909317 | Human | Breast | IDC | 3.47e-25 | 4.67e-01 | 0.1355 |
| 6495 | SIX1 | GSM4909318 | Human | Breast | IDC | 8.25e-03 | 3.28e-01 | 0.2031 |
| 6495 | SIX1 | GSM4909321 | Human | Breast | IDC | 3.32e-03 | 1.66e-01 | 0.1559 |
| 6495 | SIX1 | M1 | Human | Breast | IDC | 5.28e-11 | 2.38e-01 | 0.1577 |
| 6495 | SIX1 | NCCBC14 | Human | Breast | DCIS | 2.06e-18 | 5.62e-01 | 0.2021 |
| 6495 | SIX1 | P2 | Human | Breast | IDC | 1.98e-07 | 2.99e-01 | 0.21 |
| 6495 | SIX1 | LZE4T | Human | Esophagus | ESCC | 9.56e-12 | 3.86e-01 | 0.0811 |
| 6495 | SIX1 | LZE5T | Human | Esophagus | ESCC | 1.00e-09 | 6.27e-01 | 0.0514 |
| 6495 | SIX1 | LZE7T | Human | Esophagus | ESCC | 1.02e-03 | 2.46e-01 | 0.0667 |
| Page: 1 2 3 4 5 |
| Tissue | Expression Dynamics | Abbreviation |
| Breast |  | IDC: Invasive ductal carcinoma |
| DCIS: Ductal carcinoma in situ | ||
| Precancer(BRCA1-mut): Precancerous lesion from BRCA1 mutation carriers | ||
| Esophagus | 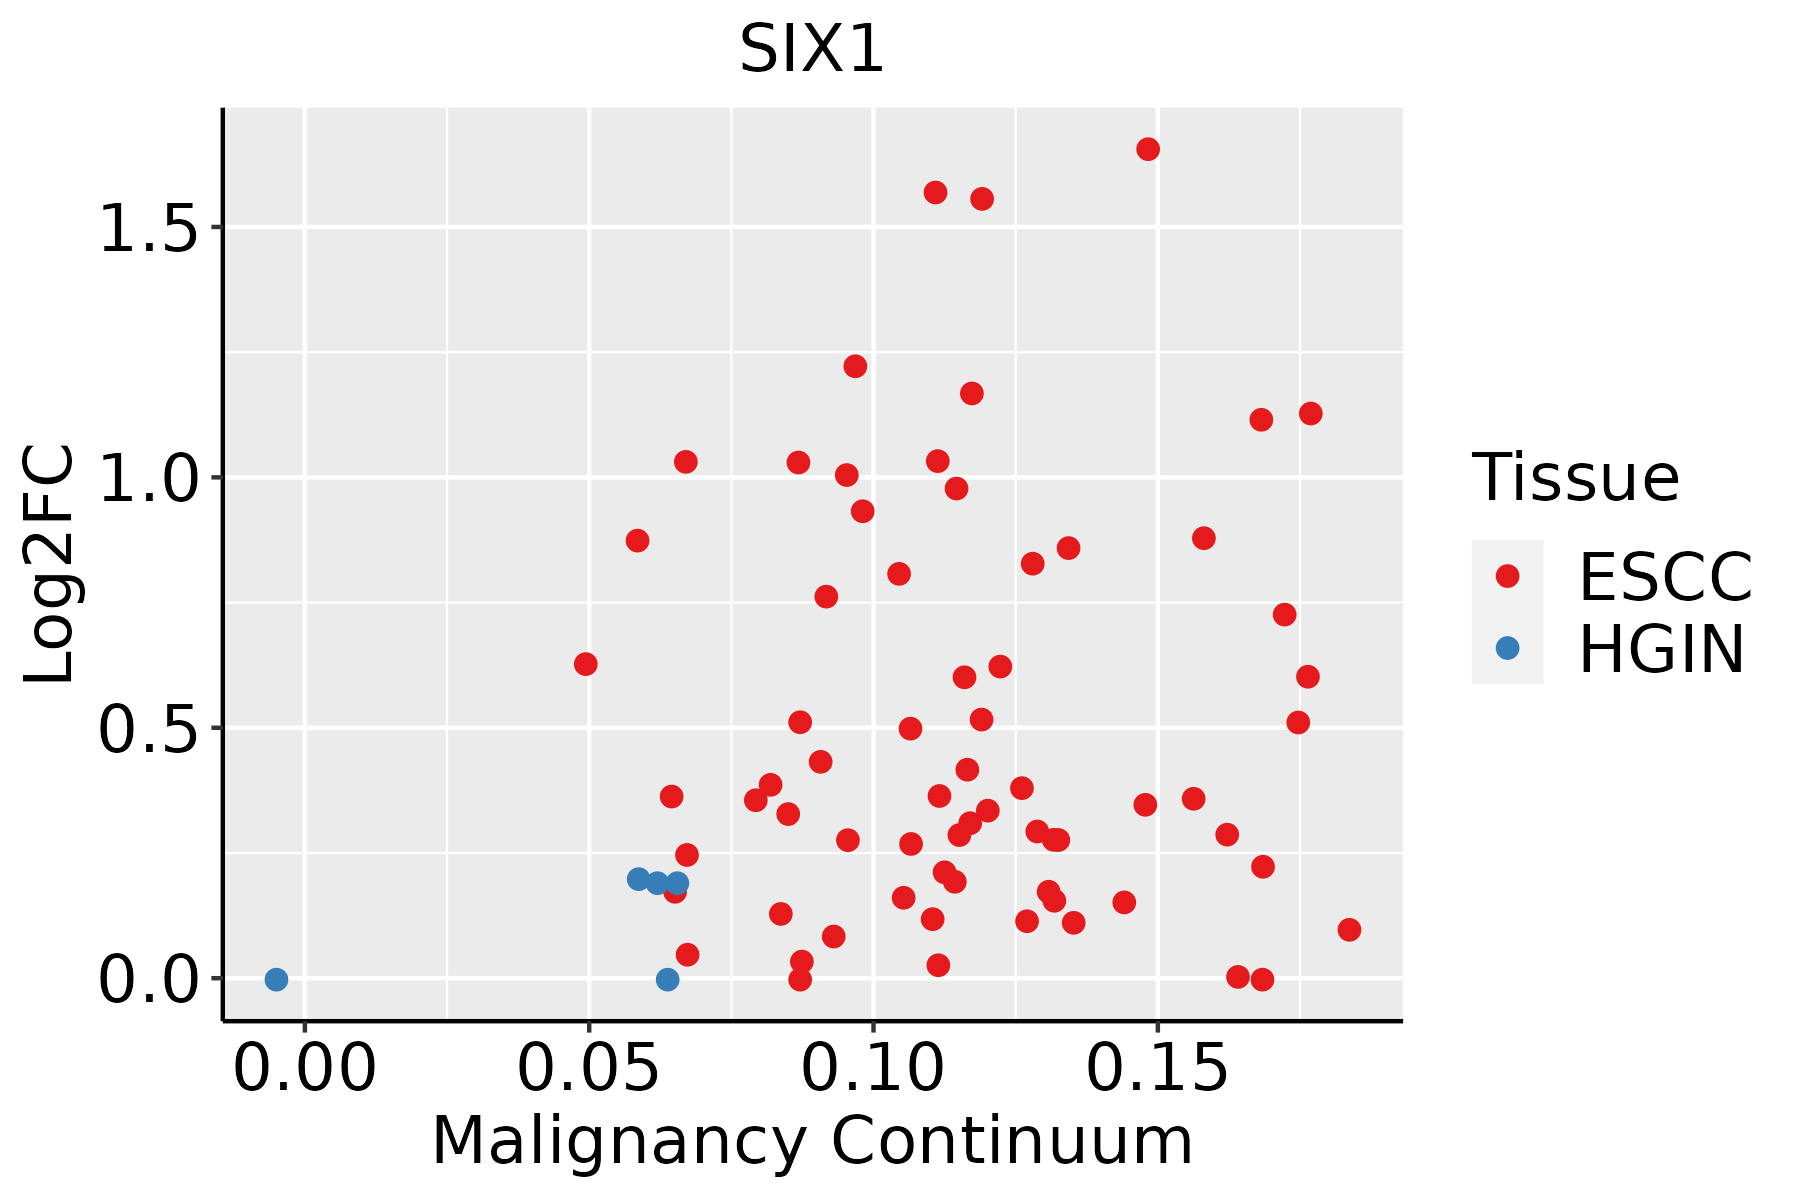 | ESCC: Esophageal squamous cell carcinoma |
| HGIN: High-grade intraepithelial neoplasias | ||
| LGIN: Low-grade intraepithelial neoplasias | ||
| Oral Cavity | 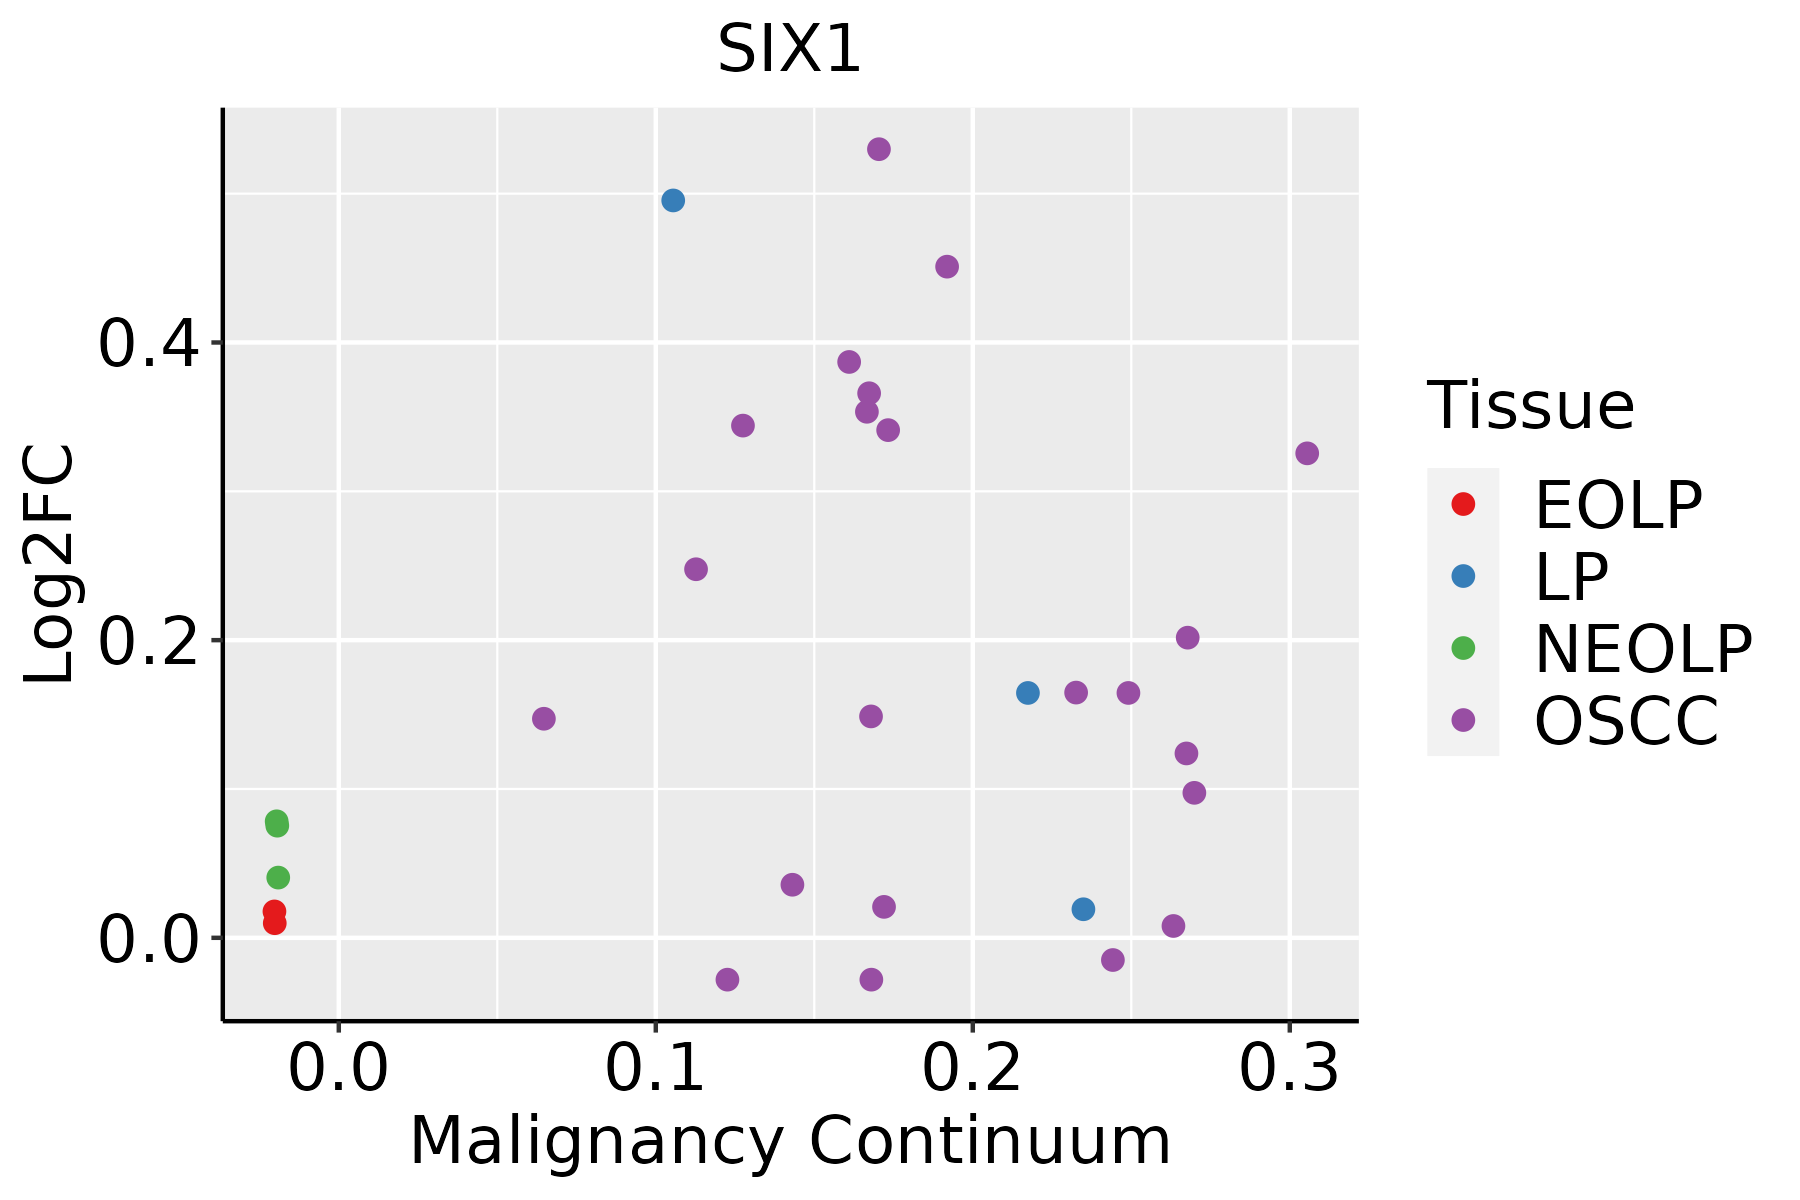 | EOLP: Erosive Oral lichen planus |
| LP: leukoplakia | ||
| NEOLP: Non-erosive oral lichen planus | ||
| OSCC: Oral squamous cell carcinoma |
| ∗log2FC in expression of this searched gene in stem-like cells from each diseased tissue sample relative to stem-like cells in normal samples in each tissue plotted against the malignancy continuum. Samples are colored based on if they are from different disease stage. |
Top |
Malignant transformation related pathway analysis |
| Find out the enriched GO biological processes and KEGG pathways involved in transition from healthy to precancer to cancer |
| Tissue | Disease Stage | Enriched GO biological Processes |
| Colorectum | AD |  |
| Colorectum | SER |  |
| Colorectum | MSS |  |
| Colorectum | MSI-H |  |
| Colorectum | FAP |  |
| ∗Top 15 enriched GO BP terms are showed in the bar plot of each disease state in each tissue. Each row represents a significant GO biological process which is colored according to the -log10(p.adjust). |
| Page: 1 2 3 4 5 6 7 8 9 |
| GO ID | Tissue | Disease Stage | Description | Gene Ratio | Bg Ratio | pvalue | p.adjust | Count |
| GO:00455984 | Esophagus | ESCC | regulation of fat cell differentiation | 79/8552 | 139/18723 | 5.23e-03 | 1.97e-02 | 79 |
| GO:00016559 | Esophagus | ESCC | urogenital system development | 177/8552 | 338/18723 | 7.51e-03 | 2.69e-02 | 177 |
| GO:20000274 | Esophagus | ESCC | regulation of animal organ morphogenesis | 71/8552 | 125/18723 | 7.97e-03 | 2.84e-02 | 71 |
| GO:19048881 | Esophagus | ESCC | cranial skeletal system development | 41/8552 | 68/18723 | 1.07e-02 | 3.66e-02 | 41 |
| GO:00017639 | Esophagus | ESCC | morphogenesis of a branching structure | 106/8552 | 196/18723 | 1.08e-02 | 3.66e-02 | 106 |
| GO:001470615 | Esophagus | ESCC | striated muscle tissue development | 197/8552 | 384/18723 | 1.46e-02 | 4.74e-02 | 197 |
| GO:00104645 | Esophagus | ESCC | regulation of mesenchymal cell proliferation | 19/8552 | 28/18723 | 1.49e-02 | 4.84e-02 | 19 |
| GO:190188810 | Esophagus | ESCC | regulation of cell junction assembly | 109/8552 | 204/18723 | 1.53e-02 | 4.96e-02 | 109 |
| GO:003450415 | Oral cavity | OSCC | protein localization to nucleus | 193/7305 | 290/18723 | 1.22e-21 | 2.35e-19 | 193 |
| GO:007099720 | Oral cavity | OSCC | neuron death | 202/7305 | 361/18723 | 3.75e-11 | 1.23e-09 | 202 |
| GO:190121420 | Oral cavity | OSCC | regulation of neuron death | 174/7305 | 319/18723 | 1.09e-08 | 2.23e-07 | 174 |
| GO:004873220 | Oral cavity | OSCC | gland development | 226/7305 | 436/18723 | 2.78e-08 | 5.39e-07 | 226 |
| GO:005140217 | Oral cavity | OSCC | neuron apoptotic process | 134/7305 | 246/18723 | 5.65e-07 | 8.19e-06 | 134 |
| GO:00454448 | Oral cavity | OSCC | fat cell differentiation | 120/7305 | 229/18723 | 2.48e-05 | 2.32e-04 | 120 |
| GO:005067310 | Oral cavity | OSCC | epithelial cell proliferation | 212/7305 | 437/18723 | 2.82e-05 | 2.61e-04 | 212 |
| GO:004352310 | Oral cavity | OSCC | regulation of neuron apoptotic process | 111/7305 | 212/18723 | 5.12e-05 | 4.27e-04 | 111 |
| GO:00455983 | Oral cavity | OSCC | regulation of fat cell differentiation | 77/7305 | 139/18723 | 6.36e-05 | 5.18e-04 | 77 |
| GO:00456006 | Oral cavity | OSCC | positive regulation of fat cell differentiation | 41/7305 | 66/18723 | 1.20e-04 | 8.60e-04 | 41 |
| GO:00011019 | Oral cavity | OSCC | response to acid chemical | 74/7305 | 135/18723 | 1.38e-04 | 9.76e-04 | 74 |
| GO:00485385 | Oral cavity | OSCC | thymus development | 30/7305 | 45/18723 | 1.58e-04 | 1.10e-03 | 30 |
| Page: 1 2 3 4 5 6 7 8 |
| Pathway ID | Tissue | Disease Stage | Description | Gene Ratio | Bg Ratio | pvalue | p.adjust | qvalue | Count |
| hsa052028 | Esophagus | ESCC | Transcriptional misregulation in cancer | 116/4205 | 193/8465 | 2.08e-03 | 5.95e-03 | 3.05e-03 | 116 |
| hsa0520213 | Esophagus | ESCC | Transcriptional misregulation in cancer | 116/4205 | 193/8465 | 2.08e-03 | 5.95e-03 | 3.05e-03 | 116 |
| Page: 1 |
Top |
Cell-cell communication analysis |
| Identification of potential cell-cell interactions between two cell types and their ligand-receptor pairs for different disease states |
| Ligand | Receptor | LRpair | Pathway | Tissue | Disease Stage |
| Page: 1 |
Top |
Single-cell gene regulatory network inference analysis |
| Find out the significant the regulons (TFs) and the target genes of each regulon across cell types for different disease states |
| TF | Cell Type | Tissue | Disease Stage | Target Gene | RSS | Regulon Activity |
| SIX1 | STM | Breast | IDC | UQCRH,LMO4,CDKN2A, etc. | 2.20e-01 |  |
| SIX1 | COL | Cervix | Healthy | C3,THSD4,SLC34A2, etc. | 3.03e-01 |  |
| SIX1 | STM | Oral cavity | ADJ | KRTCAP3,SIX4,ZNF703, etc. | 7.44e-01 |  |
| SIX1 | INCAF | Oral cavity | NEOLP | CD14,OMD,HHIP, etc. | 7.79e-01 |  |
| ∗The dot plots of a searched regulon are shown for all cell subpopulations in each disease state of each tissue based on the regulon specific score inferred using pySCENIC and by calculating the average expression. |
| Page: 1 |
Top |
Somatic mutation of malignant transformation related genes |
| Annotation of somatic variants for genes involved in malignant transformation |
| Hugo Symbol | Variant Class | Variant Classification | dbSNP RS | HGVSc | HGVSp | HGVSp Short | SWISSPROT | BIOTYPE | SIFT | PolyPhen | Tumor Sample Barcode | Tissue | Histology | Sex | Age | Stage | Therapy Types | Drugs | Outcome |
| SIX1 | SNV | Missense_Mutation | c.731N>T | p.Ser244Leu | p.S244L | Q15475 | protein_coding | tolerated_low_confidence(0.39) | benign(0) | TCGA-A2-A0EQ-01 | Breast | breast invasive carcinoma | Female | <65 | I/II | Chemotherapy | adriamycin | SD | |
| SIX1 | SNV | Missense_Mutation | novel | c.208N>A | p.Leu70Met | p.L70M | Q15475 | protein_coding | deleterious(0) | probably_damaging(0.973) | TCGA-AN-A0AK-01 | Breast | breast invasive carcinoma | Female | >=65 | I/II | Unknown | Unknown | SD |
| SIX1 | SNV | Missense_Mutation | c.775N>A | p.Gly259Ser | p.G259S | Q15475 | protein_coding | tolerated_low_confidence(0.95) | benign(0) | TCGA-AR-A24H-01 | Breast | breast invasive carcinoma | Female | >=65 | I/II | Hormone Therapy | tamoxiphen | SD | |
| SIX1 | SNV | Missense_Mutation | novel | c.340N>C | p.Lys114Gln | p.K114Q | Q15475 | protein_coding | deleterious(0) | possibly_damaging(0.867) | TCGA-2W-A8YY-01 | Cervix | cervical & endocervical cancer | Female | <65 | I/II | Chemotherapy | cisplatin | CR |
| SIX1 | insertion | In_Frame_Ins | novel | c.10_11insCACAGT | p.Met3_Leu4insProGln | p.M3_L4insPQ | Q15475 | protein_coding | TCGA-DS-A1OA-01 | Cervix | cervical & endocervical cancer | Female | >=65 | I/II | Chemotherapy | carboplatin | PD | ||
| SIX1 | SNV | Missense_Mutation | c.554A>C | p.Lys185Thr | p.K185T | Q15475 | protein_coding | tolerated(0.08) | probably_damaging(0.954) | TCGA-AA-3492-01 | Colorectum | colon adenocarcinoma | Female | >=65 | I/II | Unknown | Unknown | SD | |
| SIX1 | SNV | Missense_Mutation | c.603N>A | p.Asn201Lys | p.N201K | Q15475 | protein_coding | tolerated(0.81) | benign(0.015) | TCGA-AA-3875-01 | Colorectum | colon adenocarcinoma | Female | >=65 | I/II | Unknown | Unknown | SD | |
| SIX1 | SNV | Missense_Mutation | c.775N>A | p.Gly259Ser | p.G259S | Q15475 | protein_coding | tolerated_low_confidence(0.95) | benign(0) | TCGA-AA-3877-01 | Colorectum | colon adenocarcinoma | Female | >=65 | I/II | Unknown | Unknown | SD | |
| SIX1 | SNV | Missense_Mutation | novel | c.98N>C | p.Phe33Ser | p.F33S | Q15475 | protein_coding | deleterious(0) | possibly_damaging(0.844) | TCGA-AA-3984-01 | Colorectum | colon adenocarcinoma | Female | <65 | I/II | Unknown | Unknown | SD |
| SIX1 | SNV | Missense_Mutation | c.181N>A | p.Gly61Ser | p.G61S | Q15475 | protein_coding | deleterious(0) | benign(0.327) | TCGA-AY-6197-01 | Colorectum | colon adenocarcinoma | Male | <65 | I/II | Unknown | Unknown | SD |
| Page: 1 2 3 4 5 |
Top |
Related drugs of malignant transformation related genes |
| Identification of chemicals and drugs interact with genes involved in malignant transfromation |
| (DGIdb 4.0) |
| Entrez ID | Symbol | Category | Interaction Types | Drug Claim Name | Drug Name | PMIDs |
| Page: 1 |

Copyright 2023-Present -The University of Texas Health Science Center at Houston |