
|
|||||
|
 | |
| |
| |
| |
| |
| |
|
Gene: SAR1A |
Gene summary for SAR1A |
| Gene information | Species | Human | Gene symbol | SAR1A | Gene ID | 56681 |
| Gene name | secretion associated Ras related GTPase 1A | |
| Gene Alias | SAR1 | |
| Cytomap | 10q22.1 | |
| Gene Type | protein-coding | GO ID | GO:0003400 | UniProtAcc | Q5SQT9 |
Top |
Malignant transformation analysis |
| Identification of the aberrant gene expression in precancerous and cancerous lesions by comparing the gene expression of stem-like cells in diseased tissues with normal stem cells |
| Entrez ID | Symbol | Replicates | Species | Organ | Tissue | Adj P-value | Log2FC | Malignancy |
| 56681 | SAR1A | AEH-subject2 | Human | Endometrium | AEH | 1.80e-10 | -3.28e-01 | -0.2525 |
| 56681 | SAR1A | AEH-subject3 | Human | Endometrium | AEH | 1.82e-05 | -3.01e-01 | -0.2576 |
| 56681 | SAR1A | EEC-subject2 | Human | Endometrium | EEC | 4.23e-08 | -2.85e-01 | -0.2607 |
| 56681 | SAR1A | EEC-subject3 | Human | Endometrium | EEC | 1.30e-19 | -3.30e-01 | -0.2525 |
| 56681 | SAR1A | EEC-subject4 | Human | Endometrium | EEC | 2.08e-05 | -2.00e-01 | -0.2571 |
| 56681 | SAR1A | GSM5276934 | Human | Endometrium | EEC | 8.84e-03 | 2.37e-01 | -0.0913 |
| 56681 | SAR1A | GSM6177620_NYU_UCEC1_lib1_lib1 | Human | Endometrium | EEC | 4.11e-25 | -2.14e-01 | -0.1869 |
| 56681 | SAR1A | GSM6177620_NYU_UCEC1_lib2_lib2 | Human | Endometrium | EEC | 8.40e-18 | -1.29e-01 | -0.1875 |
| 56681 | SAR1A | GSM6177620_NYU_UCEC1_lib3_lib3 | Human | Endometrium | EEC | 6.23e-28 | -2.76e-01 | -0.1883 |
| 56681 | SAR1A | GSM6177621_NYU_UCEC2_lib1_lib1 | Human | Endometrium | EEC | 3.27e-18 | 3.73e-02 | -0.1934 |
| 56681 | SAR1A | GSM6177622_NYU_UCEC3_lib1_lib1 | Human | Endometrium | EEC | 2.99e-36 | -2.34e-01 | -0.1917 |
| 56681 | SAR1A | GSM6177622_NYU_UCEC3_lib2_lib2 | Human | Endometrium | EEC | 4.90e-28 | -3.03e-01 | -0.1916 |
| 56681 | SAR1A | LZE4T | Human | Esophagus | ESCC | 1.68e-10 | 2.50e-01 | 0.0811 |
| 56681 | SAR1A | LZE7T | Human | Esophagus | ESCC | 1.34e-04 | 2.47e-01 | 0.0667 |
| 56681 | SAR1A | LZE8T | Human | Esophagus | ESCC | 1.30e-09 | 9.77e-02 | 0.067 |
| 56681 | SAR1A | LZE20T | Human | Esophagus | ESCC | 1.86e-05 | 1.48e-01 | 0.0662 |
| 56681 | SAR1A | LZE24T | Human | Esophagus | ESCC | 7.61e-14 | 5.75e-01 | 0.0596 |
| 56681 | SAR1A | LZE6T | Human | Esophagus | ESCC | 8.81e-04 | 2.66e-01 | 0.0845 |
| 56681 | SAR1A | P1T-E | Human | Esophagus | ESCC | 2.34e-03 | 2.96e-01 | 0.0875 |
| 56681 | SAR1A | P2T-E | Human | Esophagus | ESCC | 1.19e-21 | 5.38e-01 | 0.1177 |
| Page: 1 2 3 4 5 6 7 |
| Tissue | Expression Dynamics | Abbreviation |
| Endometrium | 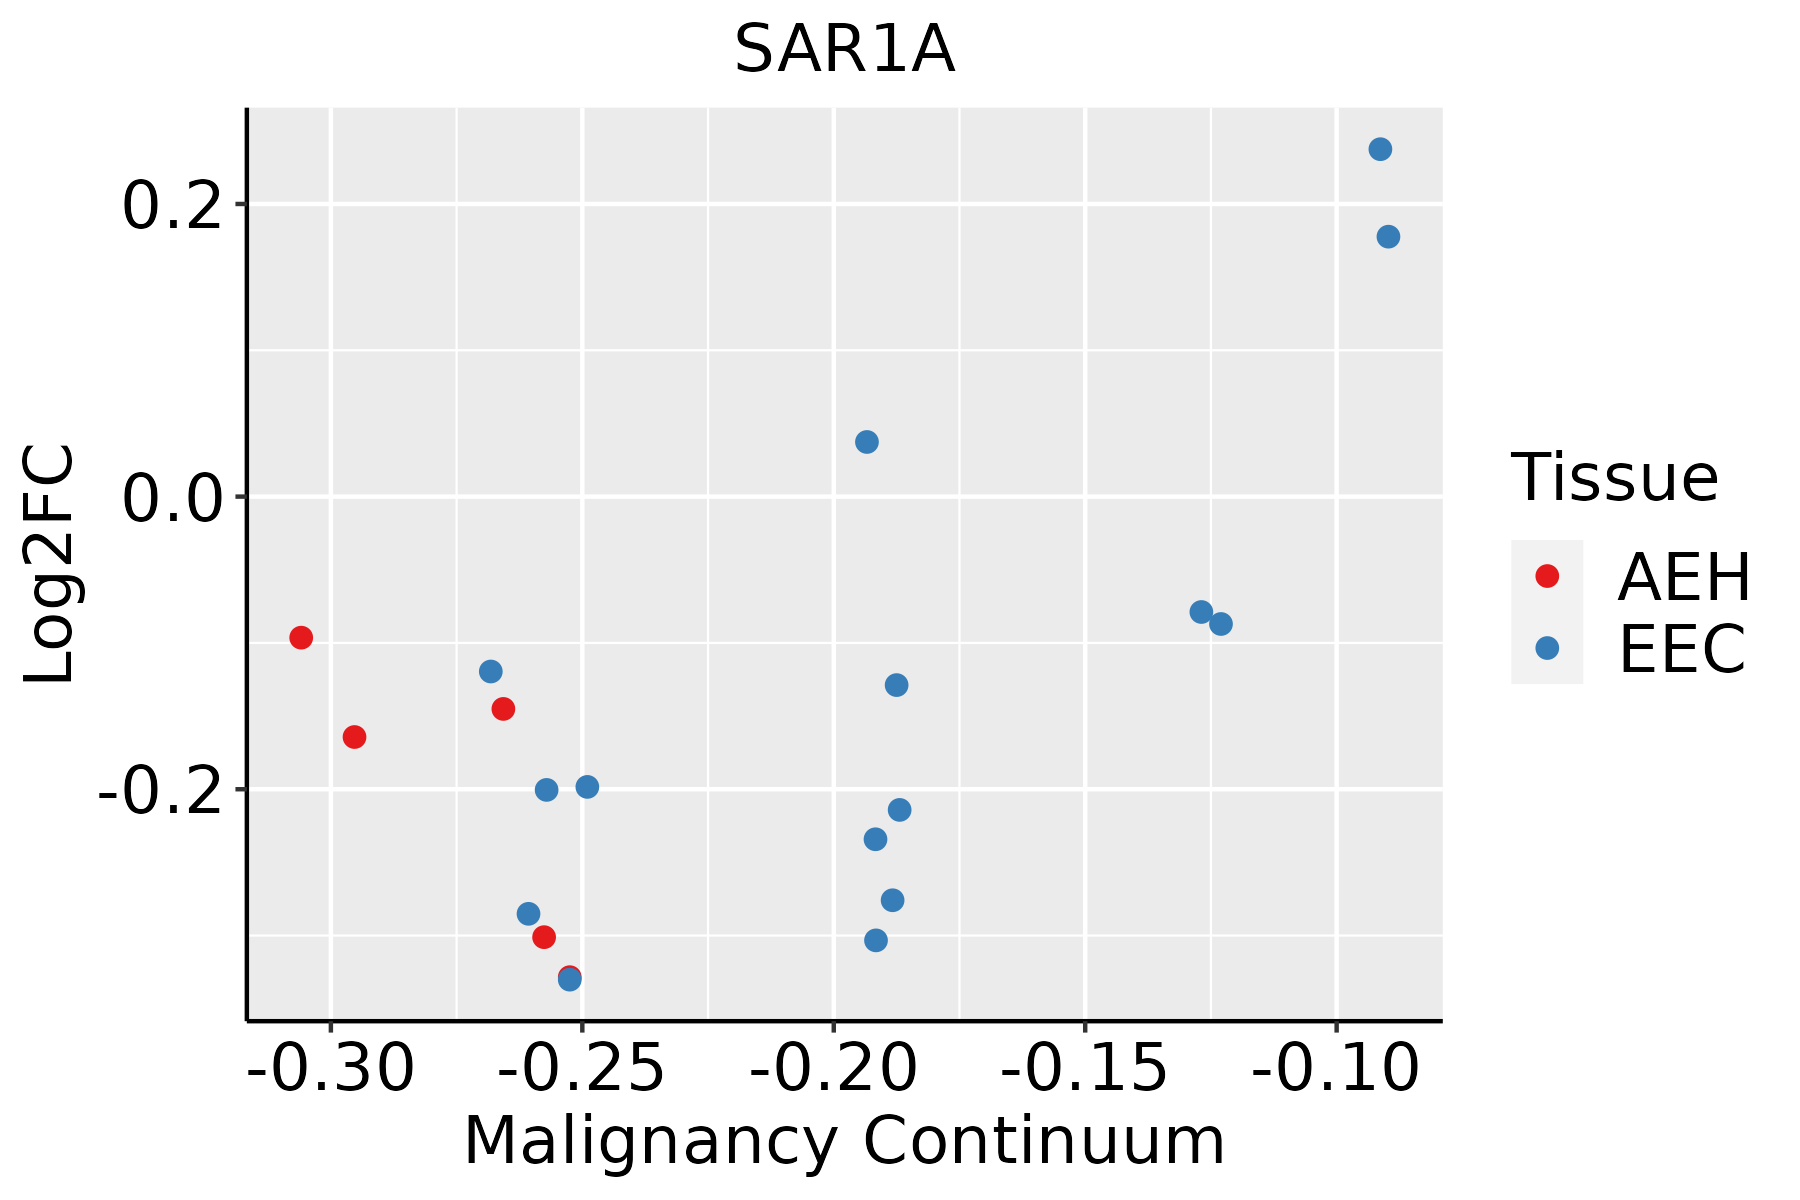 | AEH: Atypical endometrial hyperplasia |
| EEC: Endometrioid Cancer | ||
| Esophagus |  | ESCC: Esophageal squamous cell carcinoma |
| HGIN: High-grade intraepithelial neoplasias | ||
| LGIN: Low-grade intraepithelial neoplasias | ||
| Liver | 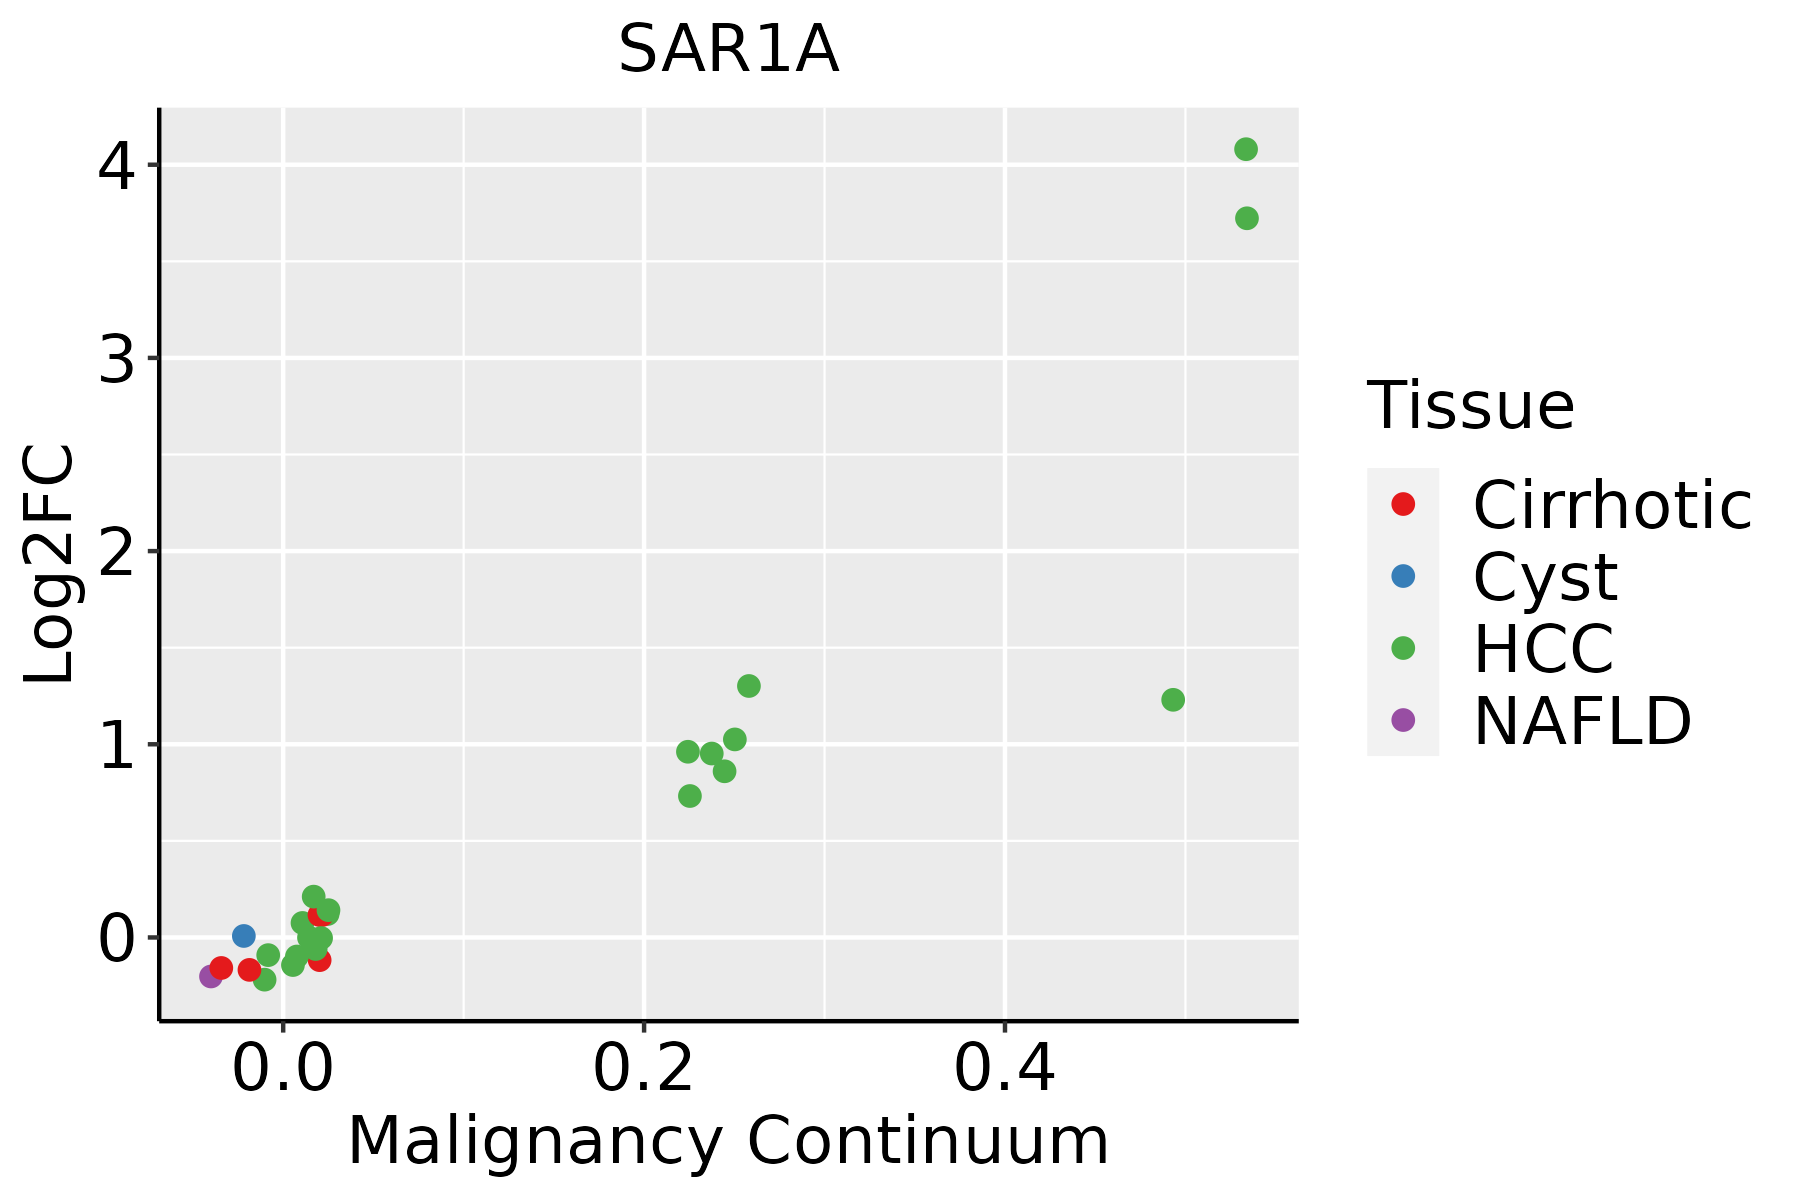 | HCC: Hepatocellular carcinoma |
| NAFLD: Non-alcoholic fatty liver disease | ||
| Oral Cavity | 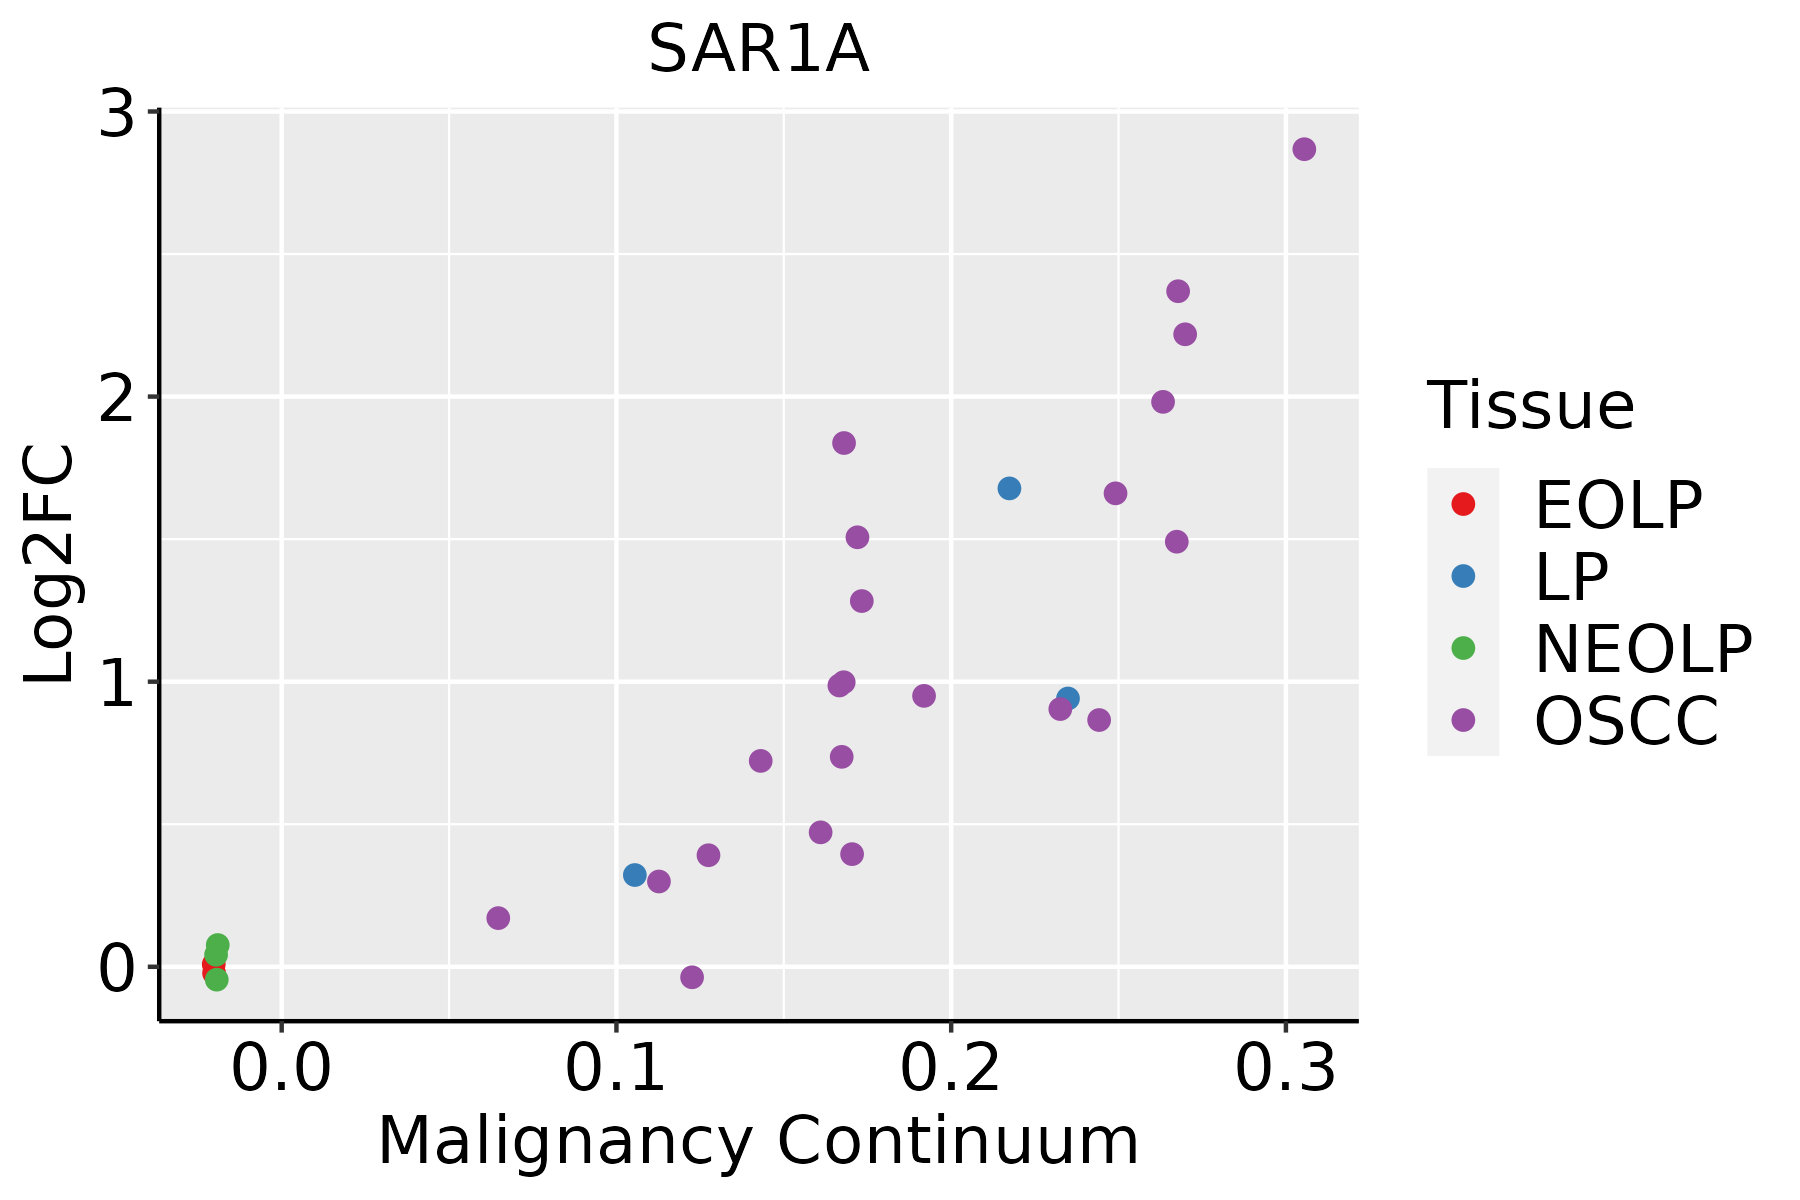 | EOLP: Erosive Oral lichen planus |
| LP: leukoplakia | ||
| NEOLP: Non-erosive oral lichen planus | ||
| OSCC: Oral squamous cell carcinoma | ||
| Skin | 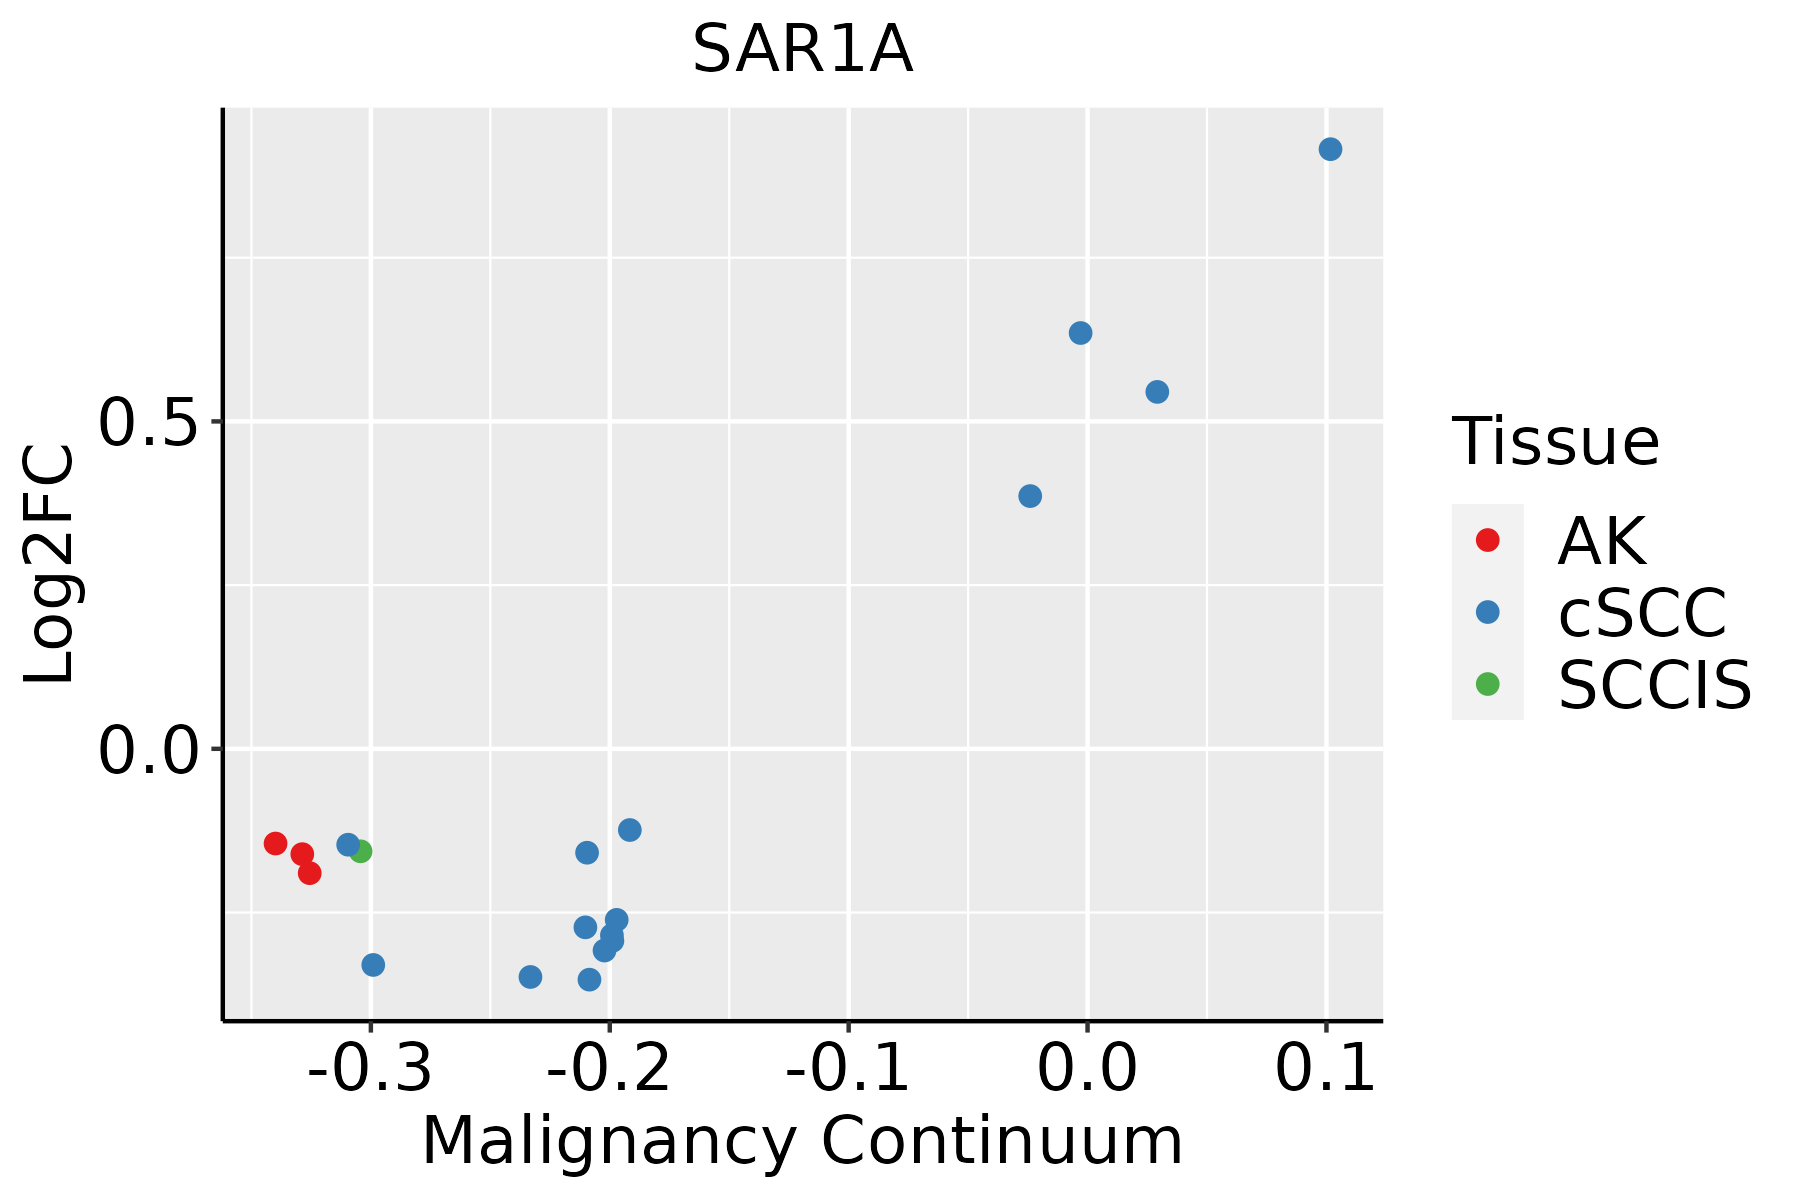 | AK: Actinic keratosis |
| cSCC: Cutaneous squamous cell carcinoma | ||
| SCCIS:squamous cell carcinoma in situ | ||
| Thyroid | 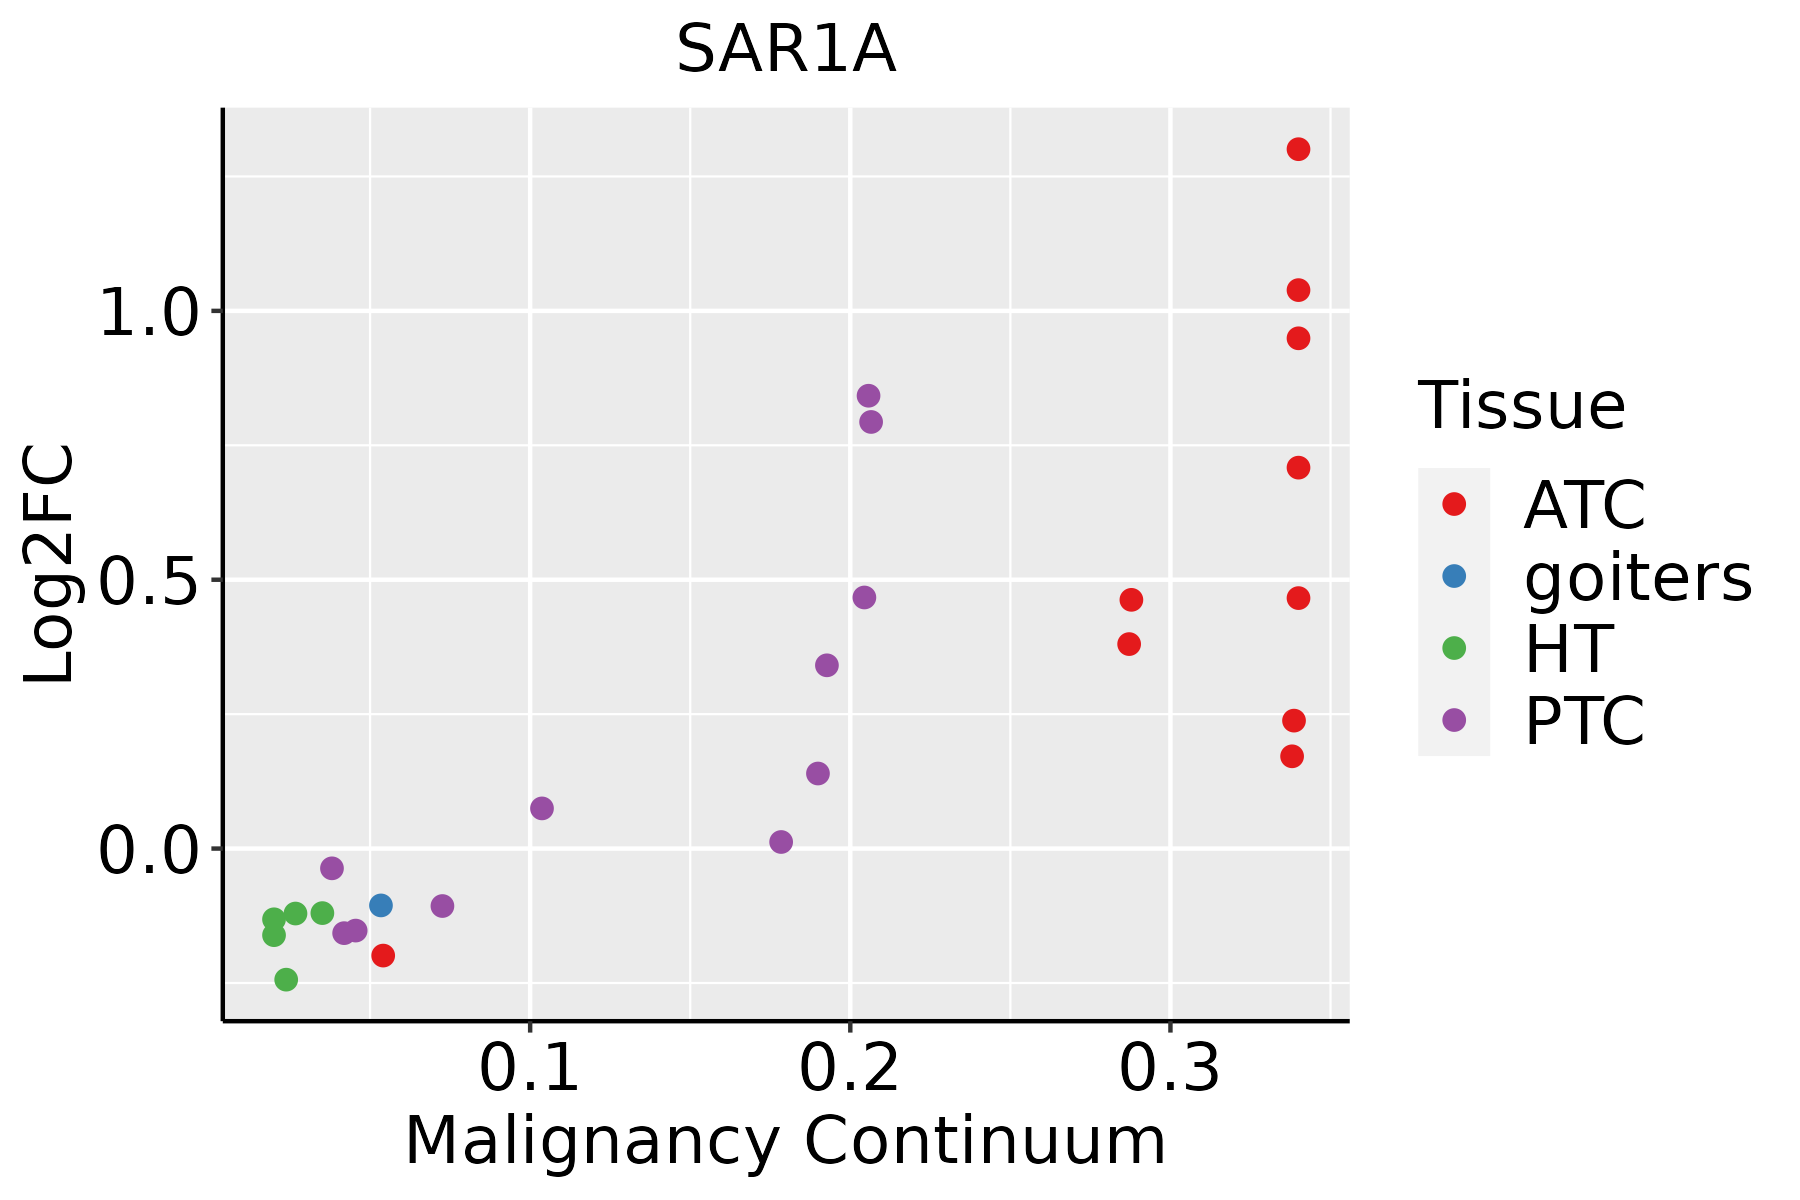 | ATC: Anaplastic thyroid cancer |
| HT: Hashimoto's thyroiditis | ||
| PTC: Papillary thyroid cancer |
| ∗log2FC in expression of this searched gene in stem-like cells from each diseased tissue sample relative to stem-like cells in normal samples in each tissue plotted against the malignancy continuum. Samples are colored based on if they are from different disease stage. |
Top |
Malignant transformation related pathway analysis |
| Find out the enriched GO biological processes and KEGG pathways involved in transition from healthy to precancer to cancer |
| Tissue | Disease Stage | Enriched GO biological Processes |
| Colorectum | AD |  |
| Colorectum | SER |  |
| Colorectum | MSS |  |
| Colorectum | MSI-H |  |
| Colorectum | FAP |  |
| ∗Top 15 enriched GO BP terms are showed in the bar plot of each disease state in each tissue. Each row represents a significant GO biological process which is colored according to the -log10(p.adjust). |
| Page: 1 2 3 4 5 6 7 8 9 |
| GO ID | Tissue | Disease Stage | Description | Gene Ratio | Bg Ratio | pvalue | p.adjust | Count |
| GO:009031610 | Oral cavity | OSCC | positive regulation of intracellular protein transport | 110/7305 | 160/18723 | 2.10e-14 | 1.19e-12 | 110 |
| GO:000690019 | Oral cavity | OSCC | vesicle budding from membrane | 49/7305 | 61/18723 | 4.73e-11 | 1.50e-09 | 49 |
| GO:00069037 | Oral cavity | OSCC | vesicle targeting | 38/7305 | 45/18723 | 4.49e-10 | 1.19e-08 | 38 |
| GO:00516509 | Oral cavity | OSCC | establishment of vesicle localization | 101/7305 | 161/18723 | 8.79e-10 | 2.17e-08 | 101 |
| GO:00516489 | Oral cavity | OSCC | vesicle localization | 105/7305 | 177/18723 | 3.30e-08 | 6.30e-07 | 105 |
| GO:00325276 | Oral cavity | OSCC | protein exit from endoplasmic reticulum | 36/7305 | 48/18723 | 4.31e-07 | 6.36e-06 | 36 |
| GO:00481995 | Oral cavity | OSCC | vesicle targeting, to, from or within Golgi | 19/7305 | 21/18723 | 1.41e-06 | 1.86e-05 | 19 |
| GO:00901145 | Oral cavity | OSCC | COPII-coated vesicle budding | 24/7305 | 29/18723 | 1.74e-06 | 2.26e-05 | 24 |
| GO:00069016 | Oral cavity | OSCC | vesicle coating | 16/7305 | 17/18723 | 3.07e-06 | 3.72e-05 | 16 |
| GO:00482074 | Oral cavity | OSCC | vesicle targeting, rough ER to cis-Golgi | 12/7305 | 13/18723 | 1.03e-04 | 7.67e-04 | 12 |
| GO:00482084 | Oral cavity | OSCC | COPII vesicle coating | 12/7305 | 13/18723 | 1.03e-04 | 7.67e-04 | 12 |
| GO:00708614 | Oral cavity | OSCC | regulation of protein exit from endoplasmic reticulum | 20/7305 | 27/18723 | 2.32e-04 | 1.51e-03 | 20 |
| GO:0060628 | Oral cavity | OSCC | regulation of ER to Golgi vesicle-mediated transport | 12/7305 | 15/18723 | 1.49e-03 | 7.13e-03 | 12 |
| GO:00901103 | Oral cavity | OSCC | COPII-coated vesicle cargo loading | 11/7305 | 15/18723 | 7.49e-03 | 2.75e-02 | 11 |
| GO:004819316 | Oral cavity | LP | Golgi vesicle transport | 141/4623 | 296/18723 | 6.11e-18 | 1.06e-15 | 141 |
| GO:003238616 | Oral cavity | LP | regulation of intracellular transport | 145/4623 | 337/18723 | 8.58e-14 | 8.27e-12 | 145 |
| GO:003238819 | Oral cavity | LP | positive regulation of intracellular transport | 97/4623 | 202/18723 | 4.79e-13 | 4.30e-11 | 97 |
| GO:003315719 | Oral cavity | LP | regulation of intracellular protein transport | 106/4623 | 229/18723 | 7.85e-13 | 6.68e-11 | 106 |
| GO:001605013 | Oral cavity | LP | vesicle organization | 128/4623 | 300/18723 | 4.96e-12 | 3.98e-10 | 128 |
| GO:1904951110 | Oral cavity | LP | positive regulation of establishment of protein localization | 132/4623 | 319/18723 | 3.06e-11 | 2.00e-09 | 132 |
| Page: 1 2 3 4 5 6 7 8 9 10 11 12 13 |
| Pathway ID | Tissue | Disease Stage | Description | Gene Ratio | Bg Ratio | pvalue | p.adjust | qvalue | Count |
| hsa0414126 | Endometrium | AEH | Protein processing in endoplasmic reticulum | 62/1197 | 174/8465 | 5.97e-13 | 1.39e-11 | 1.01e-11 | 62 |
| hsa04141111 | Endometrium | AEH | Protein processing in endoplasmic reticulum | 62/1197 | 174/8465 | 5.97e-13 | 1.39e-11 | 1.01e-11 | 62 |
| hsa0414127 | Endometrium | EEC | Protein processing in endoplasmic reticulum | 64/1237 | 174/8465 | 2.17e-13 | 5.09e-12 | 3.80e-12 | 64 |
| hsa0513418 | Endometrium | EEC | Legionellosis | 17/1237 | 57/8465 | 2.42e-03 | 1.47e-02 | 1.10e-02 | 17 |
| hsa0414136 | Endometrium | EEC | Protein processing in endoplasmic reticulum | 64/1237 | 174/8465 | 2.17e-13 | 5.09e-12 | 3.80e-12 | 64 |
| hsa0513419 | Endometrium | EEC | Legionellosis | 17/1237 | 57/8465 | 2.42e-03 | 1.47e-02 | 1.10e-02 | 17 |
| hsa04141211 | Esophagus | ESCC | Protein processing in endoplasmic reticulum | 147/4205 | 174/8465 | 3.29e-22 | 1.10e-19 | 5.64e-20 | 147 |
| hsa0513428 | Esophagus | ESCC | Legionellosis | 42/4205 | 57/8465 | 1.83e-04 | 6.90e-04 | 3.53e-04 | 42 |
| hsa04141310 | Esophagus | ESCC | Protein processing in endoplasmic reticulum | 147/4205 | 174/8465 | 3.29e-22 | 1.10e-19 | 5.64e-20 | 147 |
| hsa0513436 | Esophagus | ESCC | Legionellosis | 42/4205 | 57/8465 | 1.83e-04 | 6.90e-04 | 3.53e-04 | 42 |
| hsa0414114 | Liver | Cirrhotic | Protein processing in endoplasmic reticulum | 114/2530 | 174/8465 | 1.16e-22 | 9.67e-21 | 5.96e-21 | 114 |
| hsa0513412 | Liver | Cirrhotic | Legionellosis | 28/2530 | 57/8465 | 1.71e-03 | 8.01e-03 | 4.94e-03 | 28 |
| hsa0414115 | Liver | Cirrhotic | Protein processing in endoplasmic reticulum | 114/2530 | 174/8465 | 1.16e-22 | 9.67e-21 | 5.96e-21 | 114 |
| hsa0513413 | Liver | Cirrhotic | Legionellosis | 28/2530 | 57/8465 | 1.71e-03 | 8.01e-03 | 4.94e-03 | 28 |
| hsa0414122 | Liver | HCC | Protein processing in endoplasmic reticulum | 146/4020 | 174/8465 | 7.34e-24 | 2.46e-21 | 1.37e-21 | 146 |
| hsa0414132 | Liver | HCC | Protein processing in endoplasmic reticulum | 146/4020 | 174/8465 | 7.34e-24 | 2.46e-21 | 1.37e-21 | 146 |
| hsa0414130 | Oral cavity | OSCC | Protein processing in endoplasmic reticulum | 143/3704 | 174/8465 | 6.82e-26 | 2.28e-23 | 1.16e-23 | 143 |
| hsa0513425 | Oral cavity | OSCC | Legionellosis | 42/3704 | 57/8465 | 4.18e-06 | 2.15e-05 | 1.10e-05 | 42 |
| hsa04141113 | Oral cavity | OSCC | Protein processing in endoplasmic reticulum | 143/3704 | 174/8465 | 6.82e-26 | 2.28e-23 | 1.16e-23 | 143 |
| hsa05134111 | Oral cavity | OSCC | Legionellosis | 42/3704 | 57/8465 | 4.18e-06 | 2.15e-05 | 1.10e-05 | 42 |
| Page: 1 2 |
Top |
Cell-cell communication analysis |
| Identification of potential cell-cell interactions between two cell types and their ligand-receptor pairs for different disease states |
| Ligand | Receptor | LRpair | Pathway | Tissue | Disease Stage |
| Page: 1 |
Top |
Single-cell gene regulatory network inference analysis |
| Find out the significant the regulons (TFs) and the target genes of each regulon across cell types for different disease states |
| TF | Cell Type | Tissue | Disease Stage | Target Gene | RSS | Regulon Activity |
| ∗The dot plots of a searched regulon are shown for all cell subpopulations in each disease state of each tissue based on the regulon specific score inferred using pySCENIC and by calculating the average expression. |
| Page: 1 |
Top |
Somatic mutation of malignant transformation related genes |
| Annotation of somatic variants for genes involved in malignant transformation |
| Hugo Symbol | Variant Class | Variant Classification | dbSNP RS | HGVSc | HGVSp | HGVSp Short | SWISSPROT | BIOTYPE | SIFT | PolyPhen | Tumor Sample Barcode | Tissue | Histology | Sex | Age | Stage | Therapy Types | Drugs | Outcome |
| SAR1A | SNV | Missense_Mutation | c.317C>G | p.Ser106Cys | p.S106C | Q9NR31 | protein_coding | deleterious(0.01) | benign(0.342) | TCGA-IR-A3LA-01 | Cervix | cervical & endocervical cancer | Female | <65 | I/II | Chemotherapy | cisplatin | CR | |
| SAR1A | SNV | Missense_Mutation | rs750456522 | c.251G>A | p.Arg84His | p.R84H | Q9NR31 | protein_coding | deleterious(0) | probably_damaging(0.97) | TCGA-AZ-4315-01 | Colorectum | colon adenocarcinoma | Male | <65 | I/II | Unknown | Unknown | SD |
| SAR1A | SNV | Missense_Mutation | c.562N>A | p.Glu188Lys | p.E188K | Q9NR31 | protein_coding | deleterious(0) | benign(0.341) | TCGA-DM-A28F-01 | Colorectum | colon adenocarcinoma | Male | >=65 | III/IV | Unknown | Unknown | SD | |
| SAR1A | SNV | Missense_Mutation | novel | c.566N>A | p.Gly189Asp | p.G189D | Q9NR31 | protein_coding | deleterious(0.02) | probably_damaging(0.965) | TCGA-AG-A002-01 | Colorectum | rectum adenocarcinoma | Male | <65 | I/II | Unknown | Unknown | SD |
| SAR1A | SNV | Missense_Mutation | novel | c.468N>T | p.Gln156His | p.Q156H | Q9NR31 | protein_coding | tolerated(0.41) | benign(0.013) | TCGA-A5-A0G2-01 | Endometrium | uterine corpus endometrioid carcinoma | Female | <65 | III/IV | Unknown | Unknown | SD |
| SAR1A | SNV | Missense_Mutation | c.508N>A | p.Ala170Thr | p.A170T | Q9NR31 | protein_coding | tolerated(0.53) | benign(0) | TCGA-AX-A0J1-01 | Endometrium | uterine corpus endometrioid carcinoma | Female | >=65 | I/II | Unknown | Unknown | SD | |
| SAR1A | SNV | Missense_Mutation | c.443N>A | p.Arg148His | p.R148H | Q9NR31 | protein_coding | deleterious(0.05) | benign(0.311) | TCGA-B5-A0JY-01 | Endometrium | uterine corpus endometrioid carcinoma | Female | <65 | III/IV | Chemotherapy | doxorubicin | SD | |
| SAR1A | SNV | Missense_Mutation | c.464N>T | p.Gly155Val | p.G155V | Q9NR31 | protein_coding | deleterious(0.02) | probably_damaging(0.94) | TCGA-B5-A11E-01 | Endometrium | uterine corpus endometrioid carcinoma | Female | <65 | I/II | Unknown | Unknown | SD | |
| SAR1A | SNV | Missense_Mutation | c.548N>C | p.Arg183Thr | p.R183T | Q9NR31 | protein_coding | deleterious(0) | possibly_damaging(0.699) | TCGA-BG-A0W1-01 | Endometrium | uterine corpus endometrioid carcinoma | Female | >=65 | I/II | Unknown | Unknown | SD | |
| SAR1A | SNV | Missense_Mutation | c.418G>T | p.Asp140Tyr | p.D140Y | Q9NR31 | protein_coding | tolerated(0.19) | possibly_damaging(0.59) | TCGA-D1-A103-01 | Endometrium | uterine corpus endometrioid carcinoma | Female | >=65 | I/II | Unknown | Unknown | SD |
| Page: 1 2 3 |
Top |
Related drugs of malignant transformation related genes |
| Identification of chemicals and drugs interact with genes involved in malignant transfromation |
| (DGIdb 4.0) |
| Entrez ID | Symbol | Category | Interaction Types | Drug Claim Name | Drug Name | PMIDs |
| Page: 1 |

Copyright 2023-Present -The University of Texas Health Science Center at Houston |