| Tissue | Expression Dynamics | Abbreviation |
| Breast | 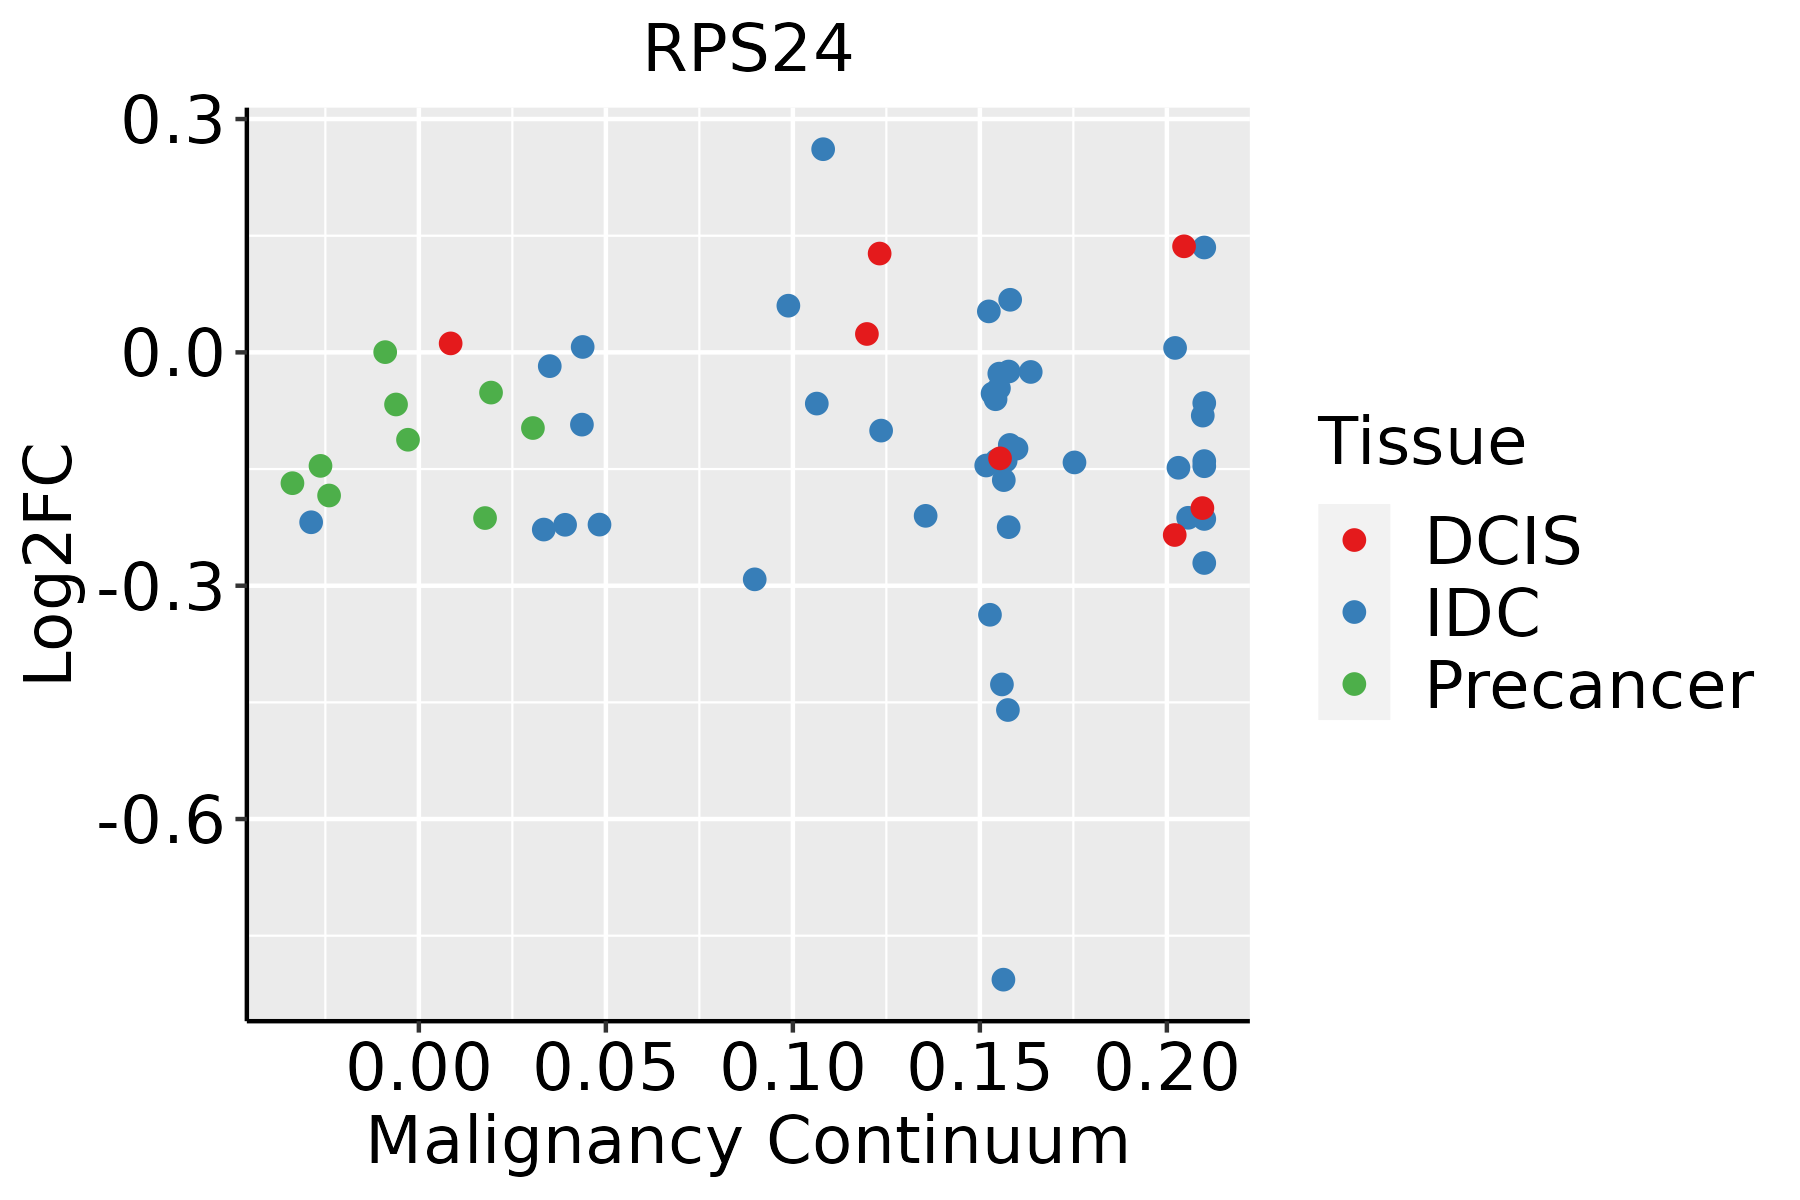 | IDC: Invasive ductal carcinoma |
| DCIS: Ductal carcinoma in situ |
| Precancer(BRCA1-mut): Precancerous lesion from BRCA1 mutation carriers |
| Cervix |  | CC: Cervix cancer |
| HSIL_HPV: HPV-infected high-grade squamous intraepithelial lesions |
| N_HPV: HPV-infected normal cervix |
| Colorectum (GSE201348) |  | FAP: Familial adenomatous polyposis |
| CRC: Colorectal cancer |
| Colorectum (HTA11) |  | AD: Adenomas |
| SER: Sessile serrated lesions |
| MSI-H: Microsatellite-high colorectal cancer |
| MSS: Microsatellite stable colorectal cancer |
| Endometrium | 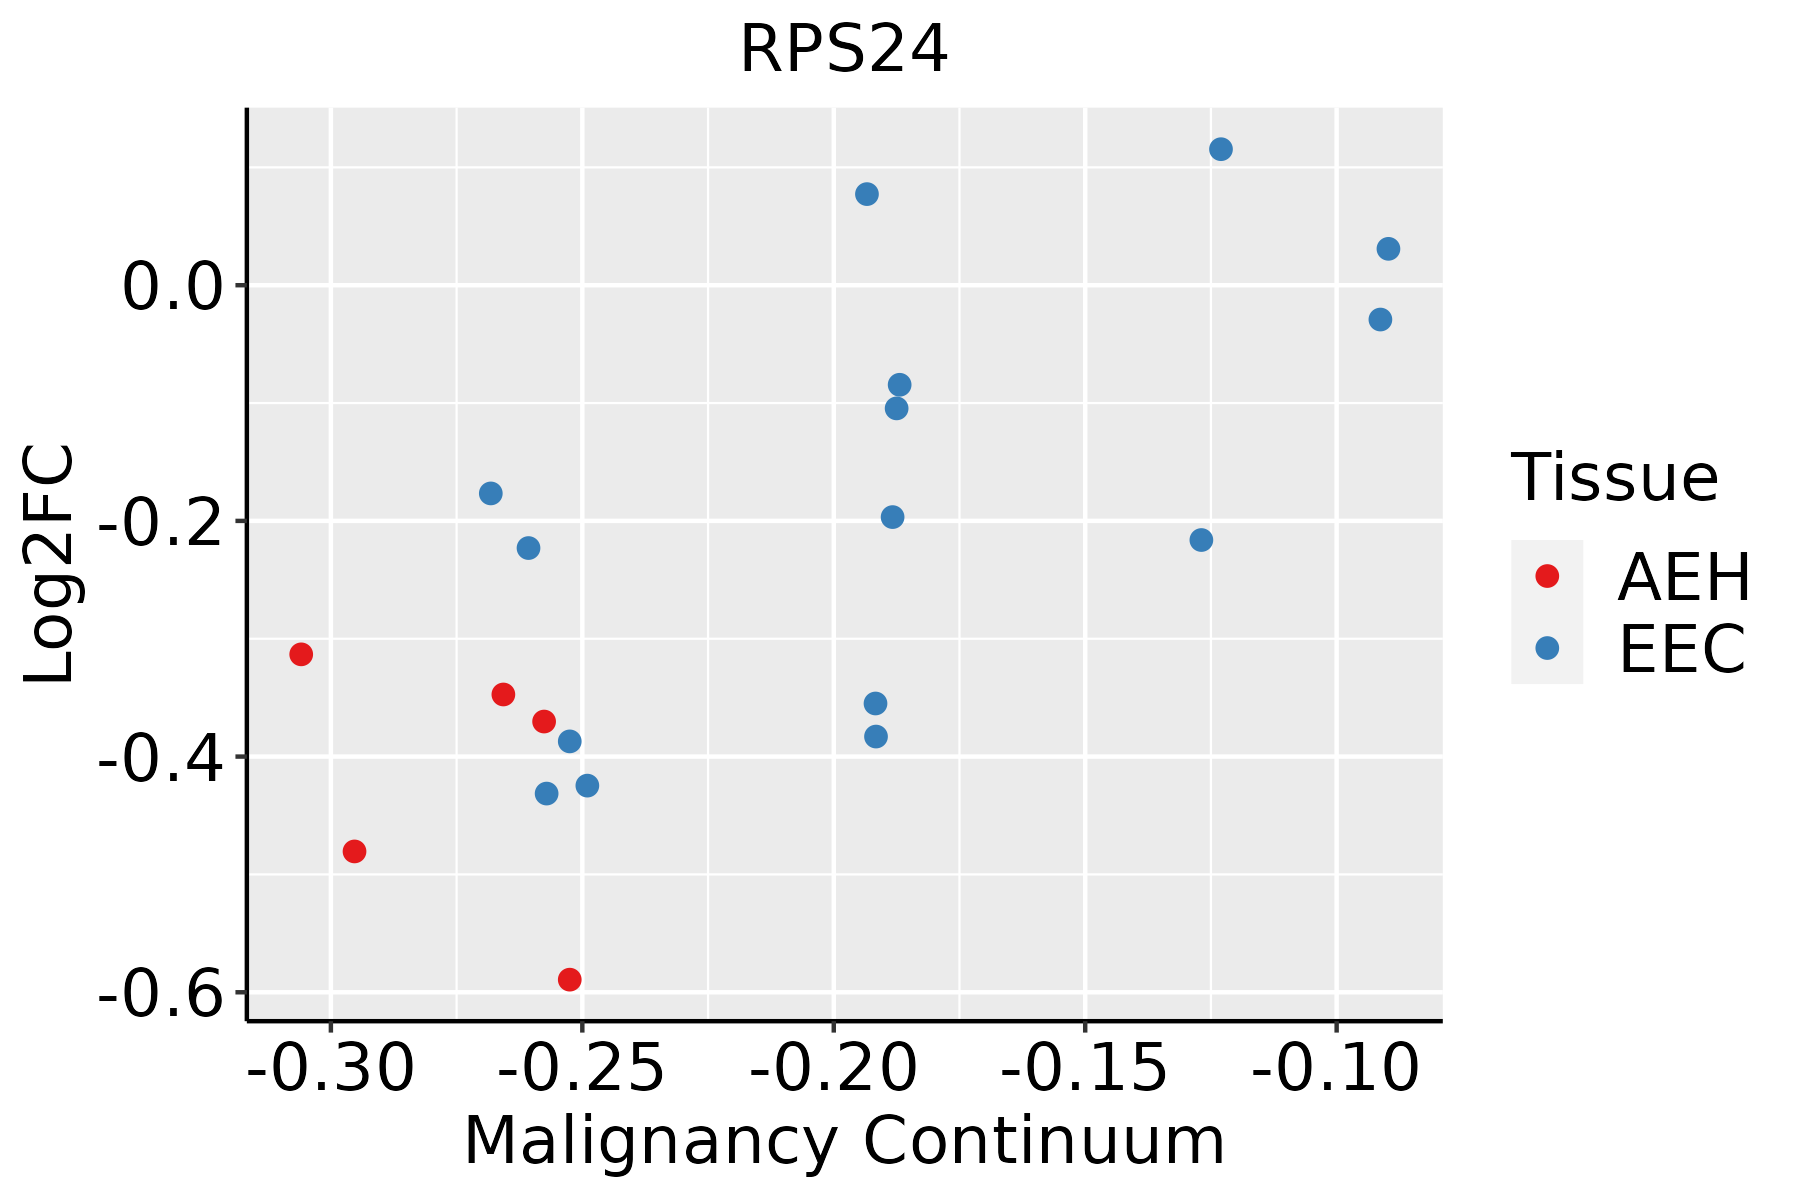 | AEH: Atypical endometrial hyperplasia |
| EEC: Endometrioid Cancer |
| Esophagus | 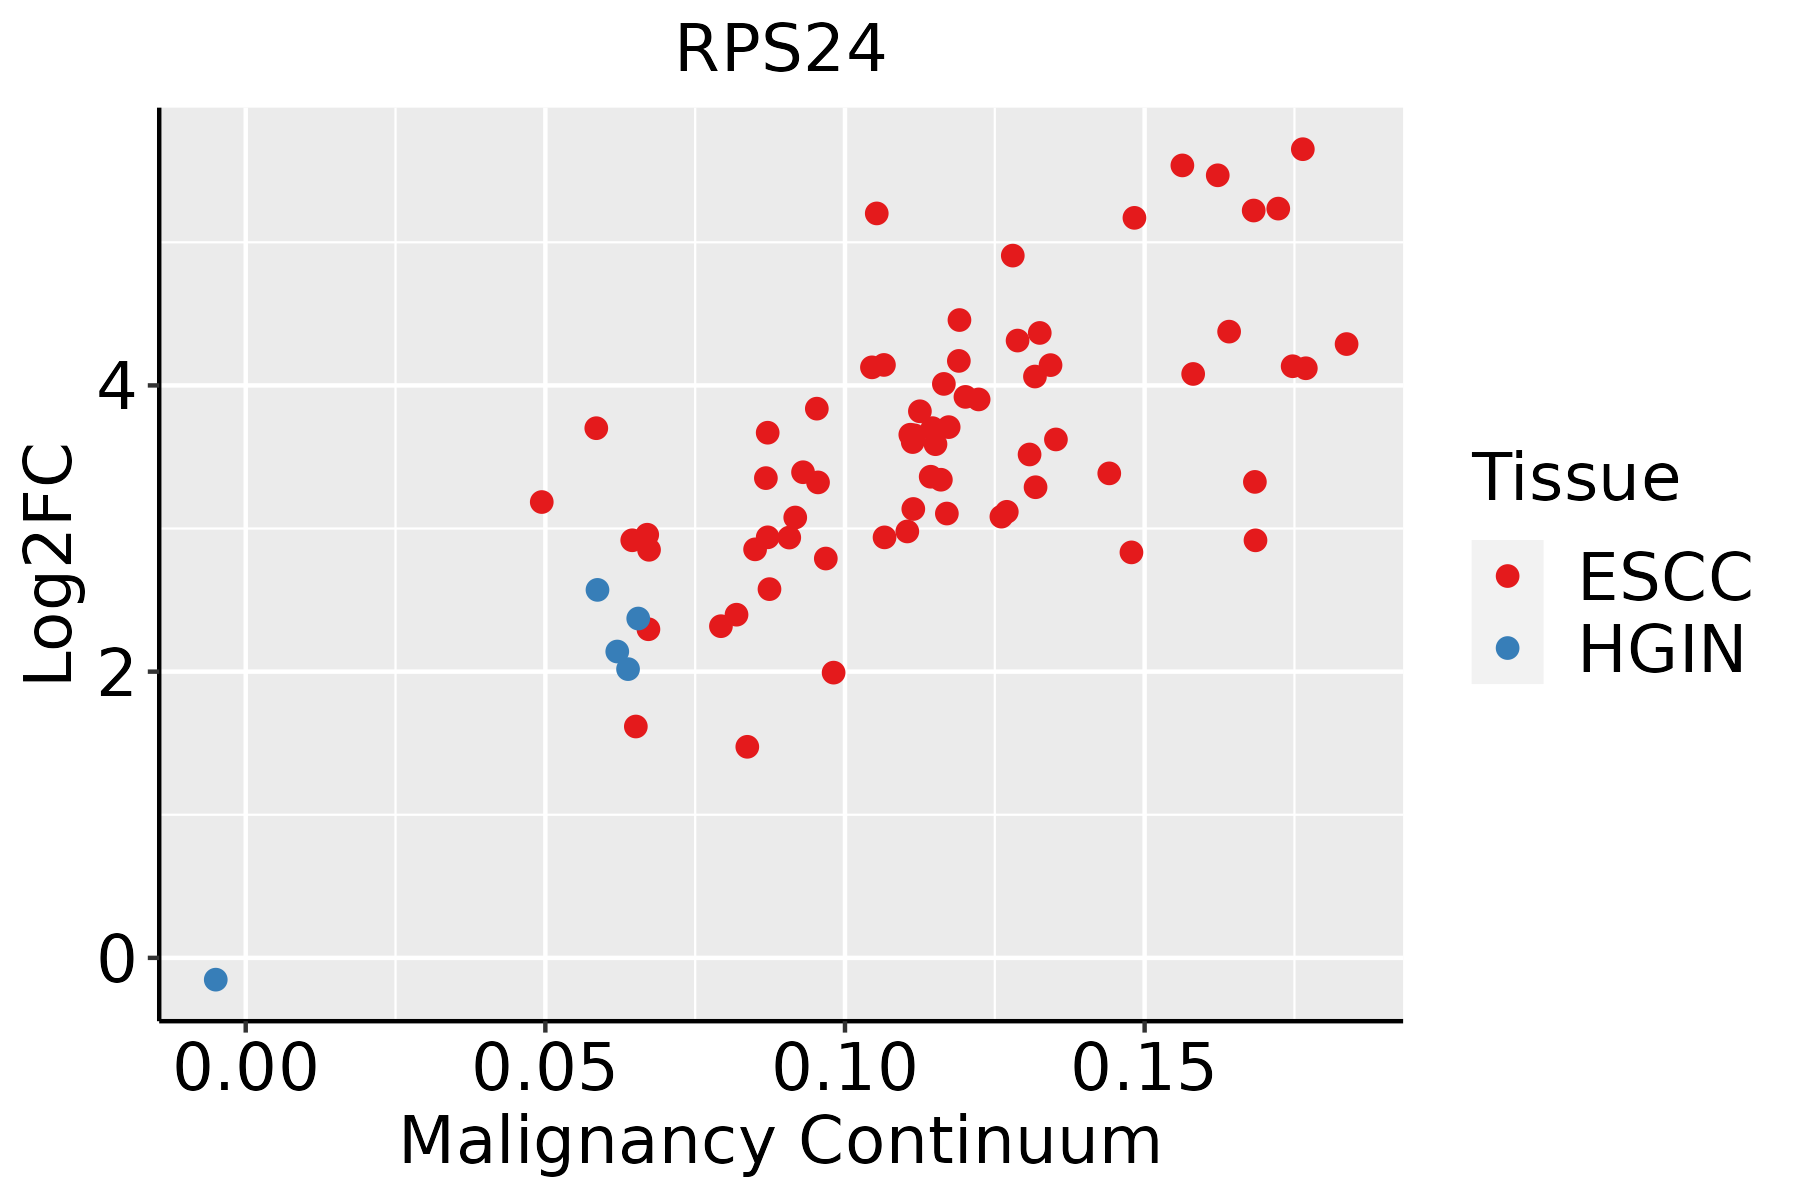 | ESCC: Esophageal squamous cell carcinoma |
| HGIN: High-grade intraepithelial neoplasias |
| LGIN: Low-grade intraepithelial neoplasias |
| GC |  | CAG: Chronic atrophic gastritis |
| CAG with IM: Chronic atrophic gastritis with intestinal metaplasia |
| CSG: Chronic superficial gastritis |
| GC: Gastric cancer |
| SIM: Severe intestinal metaplasia |
| WIM: Wild intestinal metaplasia |
| Liver | 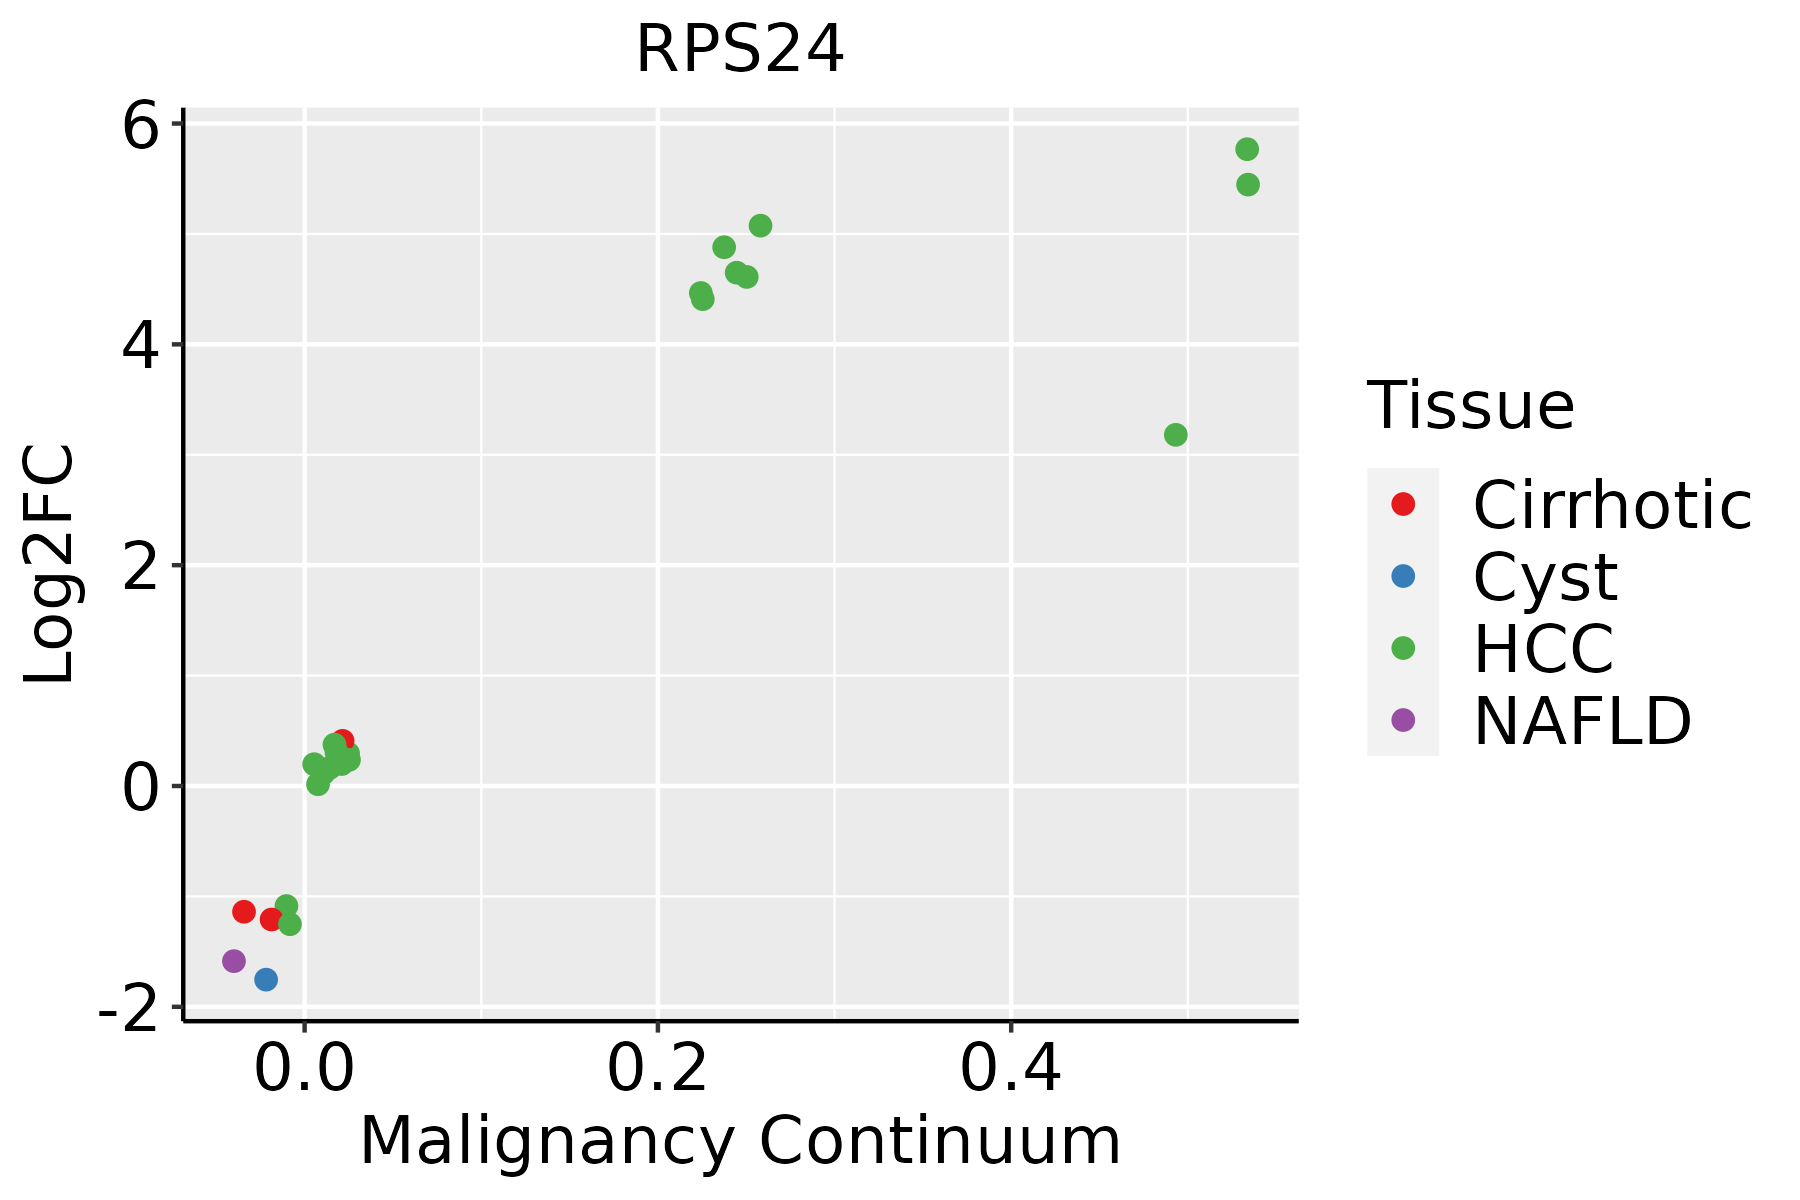 | HCC: Hepatocellular carcinoma |
| NAFLD: Non-alcoholic fatty liver disease |
| Lung |  | AAH: Atypical adenomatous hyperplasia |
| AIS: Adenocarcinoma in situ |
| IAC: Invasive lung adenocarcinoma |
| MIA: Minimally invasive adenocarcinoma |
| Oral Cavity |  | EOLP: Erosive Oral lichen planus |
| LP: leukoplakia |
| NEOLP: Non-erosive oral lichen planus |
| OSCC: Oral squamous cell carcinoma |
| Prostate |  | BPH: Benign Prostatic Hyperplasia |
| Skin |  | AK: Actinic keratosis |
| cSCC: Cutaneous squamous cell carcinoma |
| SCCIS:squamous cell carcinoma in situ |
| Thyroid |  | ATC: Anaplastic thyroid cancer |
| HT: Hashimoto's thyroiditis |
| PTC: Papillary thyroid cancer |
| GO ID | Tissue | Disease Stage | Description | Gene Ratio | Bg Ratio | pvalue | p.adjust | Count |
| GO:003410127 | Esophagus | HGIN | erythrocyte homeostasis | 34/2587 | 129/18723 | 1.16e-04 | 2.43e-03 | 34 |
| GO:00325435 | Esophagus | HGIN | mitochondrial translation | 23/2587 | 76/18723 | 1.61e-04 | 3.16e-03 | 23 |
| GO:000226227 | Esophagus | HGIN | myeloid cell homeostasis | 37/2587 | 157/18723 | 6.63e-04 | 9.04e-03 | 37 |
| GO:01400534 | Esophagus | HGIN | mitochondrial gene expression | 27/2587 | 108/18723 | 1.34e-03 | 1.57e-02 | 27 |
| GO:004887227 | Esophagus | HGIN | homeostasis of number of cells | 54/2587 | 272/18723 | 3.50e-03 | 3.23e-02 | 54 |
| GO:0022613111 | Esophagus | ESCC | ribonucleoprotein complex biogenesis | 365/8552 | 463/18723 | 1.74e-49 | 1.11e-45 | 365 |
| GO:0042254111 | Esophagus | ESCC | ribosome biogenesis | 252/8552 | 299/18723 | 3.27e-44 | 1.04e-40 | 252 |
| GO:003447015 | Esophagus | ESCC | ncRNA processing | 300/8552 | 395/18723 | 3.09e-35 | 3.26e-32 | 300 |
| GO:0016072110 | Esophagus | ESCC | rRNA metabolic process | 197/8552 | 236/18723 | 1.31e-33 | 1.18e-30 | 197 |
| GO:0006364110 | Esophagus | ESCC | rRNA processing | 189/8552 | 225/18723 | 4.88e-33 | 3.87e-30 | 189 |
| GO:0002181111 | Esophagus | ESCC | cytoplasmic translation | 135/8552 | 148/18723 | 4.17e-32 | 2.65e-29 | 135 |
| GO:003466012 | Esophagus | ESCC | ncRNA metabolic process | 346/8552 | 485/18723 | 4.35e-31 | 2.51e-28 | 346 |
| GO:014005313 | Esophagus | ESCC | mitochondrial gene expression | 93/8552 | 108/18723 | 1.96e-18 | 2.03e-16 | 93 |
| GO:0042274111 | Esophagus | ESCC | ribosomal small subunit biogenesis | 67/8552 | 73/18723 | 6.62e-17 | 5.38e-15 | 67 |
| GO:003254314 | Esophagus | ESCC | mitochondrial translation | 68/8552 | 76/18723 | 1.02e-15 | 6.86e-14 | 68 |
| GO:0002262111 | Esophagus | ESCC | myeloid cell homeostasis | 104/8552 | 157/18723 | 1.49e-07 | 2.36e-06 | 104 |
| GO:0034101111 | Esophagus | ESCC | erythrocyte homeostasis | 88/8552 | 129/18723 | 1.81e-07 | 2.84e-06 | 88 |
| GO:0048872111 | Esophagus | ESCC | homeostasis of number of cells | 163/8552 | 272/18723 | 1.40e-06 | 1.69e-05 | 163 |
| GO:00021817 | Liver | NAFLD | cytoplasmic translation | 93/1882 | 148/18723 | 1.44e-55 | 8.41e-52 | 93 |
| GO:00226137 | Liver | NAFLD | ribonucleoprotein complex biogenesis | 76/1882 | 463/18723 | 1.19e-05 | 3.67e-04 | 76 |
| Pathway ID | Tissue | Disease Stage | Description | Gene Ratio | Bg Ratio | pvalue | p.adjust | qvalue | Count |
| hsa0301018 | Breast | Precancer | Ribosome | 80/684 | 167/8465 | 7.33e-44 | 2.32e-41 | 1.77e-41 | 80 |
| hsa0517118 | Breast | Precancer | Coronavirus disease - COVID-19 | 81/684 | 232/8465 | 3.74e-32 | 2.36e-30 | 1.81e-30 | 81 |
| hsa0301019 | Breast | Precancer | Ribosome | 80/684 | 167/8465 | 7.33e-44 | 2.32e-41 | 1.77e-41 | 80 |
| hsa0517119 | Breast | Precancer | Coronavirus disease - COVID-19 | 81/684 | 232/8465 | 3.74e-32 | 2.36e-30 | 1.81e-30 | 81 |
| hsa0301024 | Breast | IDC | Ribosome | 83/867 | 167/8465 | 6.07e-39 | 9.87e-37 | 7.38e-37 | 83 |
| hsa0517124 | Breast | IDC | Coronavirus disease - COVID-19 | 86/867 | 232/8465 | 1.50e-28 | 9.72e-27 | 7.27e-27 | 86 |
| hsa0301034 | Breast | IDC | Ribosome | 83/867 | 167/8465 | 6.07e-39 | 9.87e-37 | 7.38e-37 | 83 |
| hsa0517134 | Breast | IDC | Coronavirus disease - COVID-19 | 86/867 | 232/8465 | 1.50e-28 | 9.72e-27 | 7.27e-27 | 86 |
| hsa0301044 | Breast | DCIS | Ribosome | 82/846 | 167/8465 | 8.69e-39 | 1.40e-36 | 1.03e-36 | 82 |
| hsa0517144 | Breast | DCIS | Coronavirus disease - COVID-19 | 86/846 | 232/8465 | 2.42e-29 | 1.56e-27 | 1.15e-27 | 86 |
| hsa0301054 | Breast | DCIS | Ribosome | 82/846 | 167/8465 | 8.69e-39 | 1.40e-36 | 1.03e-36 | 82 |
| hsa0517154 | Breast | DCIS | Coronavirus disease - COVID-19 | 86/846 | 232/8465 | 2.42e-29 | 1.56e-27 | 1.15e-27 | 86 |
| hsa0517120 | Cervix | CC | Coronavirus disease - COVID-19 | 111/1267 | 232/8465 | 1.82e-33 | 5.90e-31 | 3.49e-31 | 111 |
| hsa0301020 | Cervix | CC | Ribosome | 85/1267 | 167/8465 | 3.17e-28 | 5.14e-26 | 3.04e-26 | 85 |
| hsa05171110 | Cervix | CC | Coronavirus disease - COVID-19 | 111/1267 | 232/8465 | 1.82e-33 | 5.90e-31 | 3.49e-31 | 111 |
| hsa03010110 | Cervix | CC | Ribosome | 85/1267 | 167/8465 | 3.17e-28 | 5.14e-26 | 3.04e-26 | 85 |
| hsa0301025 | Cervix | HSIL_HPV | Ribosome | 80/459 | 167/8465 | 9.61e-58 | 2.82e-55 | 2.28e-55 | 80 |
| hsa0517125 | Cervix | HSIL_HPV | Coronavirus disease - COVID-19 | 91/459 | 232/8465 | 2.14e-56 | 3.13e-54 | 2.53e-54 | 91 |
| hsa0301035 | Cervix | HSIL_HPV | Ribosome | 80/459 | 167/8465 | 9.61e-58 | 2.82e-55 | 2.28e-55 | 80 |
| hsa0517135 | Cervix | HSIL_HPV | Coronavirus disease - COVID-19 | 91/459 | 232/8465 | 2.14e-56 | 3.13e-54 | 2.53e-54 | 91 |
| Hugo Symbol | Variant Class | Variant Classification | dbSNP RS | HGVSc | HGVSp | HGVSp Short | SWISSPROT | BIOTYPE | SIFT | PolyPhen | Tumor Sample Barcode | Tissue | Histology | Sex | Age | Stage | Therapy Types | Drugs | Outcome |
| RPS24 | SNV | Missense_Mutation | novel | c.526G>T | p.Val176Leu | p.V176L | P62847 | protein_coding | deleterious_low_confidence(0) | benign(0.003) | TCGA-AR-A5QM-01 | Breast | breast invasive carcinoma | Female | <65 | I/II | Hormone Therapy | anastrozole | PD |
| RPS24 | SNV | Missense_Mutation | | c.454G>C | p.Asp152His | p.D152H | P62847 | protein_coding | deleterious_low_confidence(0) | benign(0.154) | TCGA-MU-A51Y-01 | Cervix | cervical & endocervical cancer | Female | <65 | I/II | Unknown | Unknown | SD |
| RPS24 | SNV | Missense_Mutation | novel | c.320N>A | p.Arg107Gln | p.R107Q | P62847 | protein_coding | tolerated_low_confidence(0.12) | benign(0.195) | TCGA-AA-A00N-01 | Colorectum | colon adenocarcinoma | Male | >=65 | I/II | Unknown | Unknown | PD |
| RPS24 | SNV | Missense_Mutation | novel | c.462N>T | p.Lys154Asn | p.K154N | P62847 | protein_coding | deleterious_low_confidence(0.01) | benign(0.339) | TCGA-CA-6717-01 | Colorectum | colon adenocarcinoma | Male | <65 | I/II | Chemotherapy | oxaliplatin | CR |
| RPS24 | SNV | Missense_Mutation | | c.142T>A | p.Tyr48Asn | p.Y48N | P62847 | protein_coding | deleterious_low_confidence(0) | probably_damaging(0.995) | TCGA-CK-5916-01 | Colorectum | colon adenocarcinoma | Female | >=65 | I/II | Unknown | Unknown | PD |
| RPS24 | SNV | Missense_Mutation | | c.535T>C | p.Cys179Arg | p.C179R | P62847 | protein_coding | deleterious_low_confidence(0) | benign(0) | TCGA-CK-5916-01 | Colorectum | colon adenocarcinoma | Female | >=65 | I/II | Unknown | Unknown | PD |
| RPS24 | SNV | Missense_Mutation | | c.428G>T | p.Arg143Ile | p.R143I | P62847 | protein_coding | deleterious_low_confidence(0) | benign(0) | TCGA-F5-6814-01 | Colorectum | rectum adenocarcinoma | Male | <65 | I/II | Unknown | Unknown | SD |
| RPS24 | SNV | Missense_Mutation | novel | c.418N>A | p.Ala140Thr | p.A140T | P62847 | protein_coding | deleterious_low_confidence(0.02) | benign(0.003) | TCGA-A5-A0G1-01 | Endometrium | uterine corpus endometrioid carcinoma | Female | >=65 | I/II | Unknown | Unknown | SD |
| RPS24 | SNV | Missense_Mutation | novel | c.104N>C | p.Val35Ala | p.V35A | P62847 | protein_coding | deleterious_low_confidence(0.03) | possibly_damaging(0.838) | TCGA-A5-A0G2-01 | Endometrium | uterine corpus endometrioid carcinoma | Female | <65 | III/IV | Unknown | Unknown | SD |
| RPS24 | SNV | Missense_Mutation | novel | c.462N>T | p.Lys154Asn | p.K154N | P62847 | protein_coding | deleterious_low_confidence(0.01) | benign(0.339) | TCGA-A5-A2K5-01 | Endometrium | uterine corpus endometrioid carcinoma | Female | >=65 | I/II | Unknown | Unknown | SD |


