
|
|||||
|
 | |
| |
| |
| |
| |
| |
|
Gene: RNF180 |
Gene summary for RNF180 |
| Gene information | Species | Human | Gene symbol | RNF180 | Gene ID | 285671 |
| Gene name | ring finger protein 180 | |
| Gene Alias | RINES | |
| Cytomap | 5q12.3 | |
| Gene Type | protein-coding | GO ID | GO:0000209 | UniProtAcc | Q86T96 |
Top |
Malignant transformation analysis |
| Identification of the aberrant gene expression in precancerous and cancerous lesions by comparing the gene expression of stem-like cells in diseased tissues with normal stem cells |
| Entrez ID | Symbol | Replicates | Species | Organ | Tissue | Adj P-value | Log2FC | Malignancy |
| 285671 | RNF180 | HTA11_3410_2000001011 | Human | Colorectum | AD | 2.32e-22 | 5.64e-01 | 0.0155 |
| 285671 | RNF180 | HTA11_2487_2000001011 | Human | Colorectum | SER | 1.12e-23 | 8.14e-01 | -0.1808 |
| 285671 | RNF180 | HTA11_2951_2000001011 | Human | Colorectum | AD | 2.22e-10 | 6.19e-01 | 0.0216 |
| 285671 | RNF180 | HTA11_1938_2000001011 | Human | Colorectum | AD | 1.35e-40 | 1.77e+00 | -0.0811 |
| 285671 | RNF180 | HTA11_78_2000001011 | Human | Colorectum | AD | 2.12e-28 | 8.76e-01 | -0.1088 |
| 285671 | RNF180 | HTA11_347_2000001011 | Human | Colorectum | AD | 4.63e-29 | 7.25e-01 | -0.1954 |
| 285671 | RNF180 | HTA11_411_2000001011 | Human | Colorectum | SER | 2.64e-05 | 7.46e-01 | -0.2602 |
| 285671 | RNF180 | HTA11_2112_2000001011 | Human | Colorectum | SER | 5.97e-09 | 8.06e-01 | -0.2196 |
| 285671 | RNF180 | HTA11_3361_2000001011 | Human | Colorectum | AD | 4.64e-14 | 5.35e-01 | -0.1207 |
| 285671 | RNF180 | HTA11_83_2000001011 | Human | Colorectum | SER | 2.06e-12 | 6.89e-01 | -0.1526 |
| 285671 | RNF180 | HTA11_696_2000001011 | Human | Colorectum | AD | 8.73e-38 | 8.26e-01 | -0.1464 |
| 285671 | RNF180 | HTA11_866_2000001011 | Human | Colorectum | AD | 2.83e-21 | 5.62e-01 | -0.1001 |
| 285671 | RNF180 | HTA11_1391_2000001011 | Human | Colorectum | AD | 1.89e-21 | 6.65e-01 | -0.059 |
| 285671 | RNF180 | HTA11_2992_2000001011 | Human | Colorectum | SER | 8.71e-09 | 4.51e-01 | -0.1706 |
| 285671 | RNF180 | HTA11_546_2000001011 | Human | Colorectum | AD | 6.29e-04 | 3.34e-01 | -0.0842 |
| 285671 | RNF180 | HTA11_9341_2000001011 | Human | Colorectum | SER | 1.66e-04 | 8.24e-01 | -0.00410000000000005 |
| 285671 | RNF180 | HTA11_7862_2000001011 | Human | Colorectum | AD | 1.06e-21 | 8.58e-01 | -0.0179 |
| 285671 | RNF180 | HTA11_866_3004761011 | Human | Colorectum | AD | 3.43e-15 | 5.98e-01 | 0.096 |
| 285671 | RNF180 | HTA11_99999970781_79442 | Human | Colorectum | MSS | 5.60e-105 | 2.06e+00 | 0.294 |
| 285671 | RNF180 | HTA11_99999965062_69753 | Human | Colorectum | MSI-H | 2.19e-19 | 1.62e+00 | 0.3487 |
| Page: 1 2 3 |
| Tissue | Expression Dynamics | Abbreviation |
| Colorectum (GSE201348) | 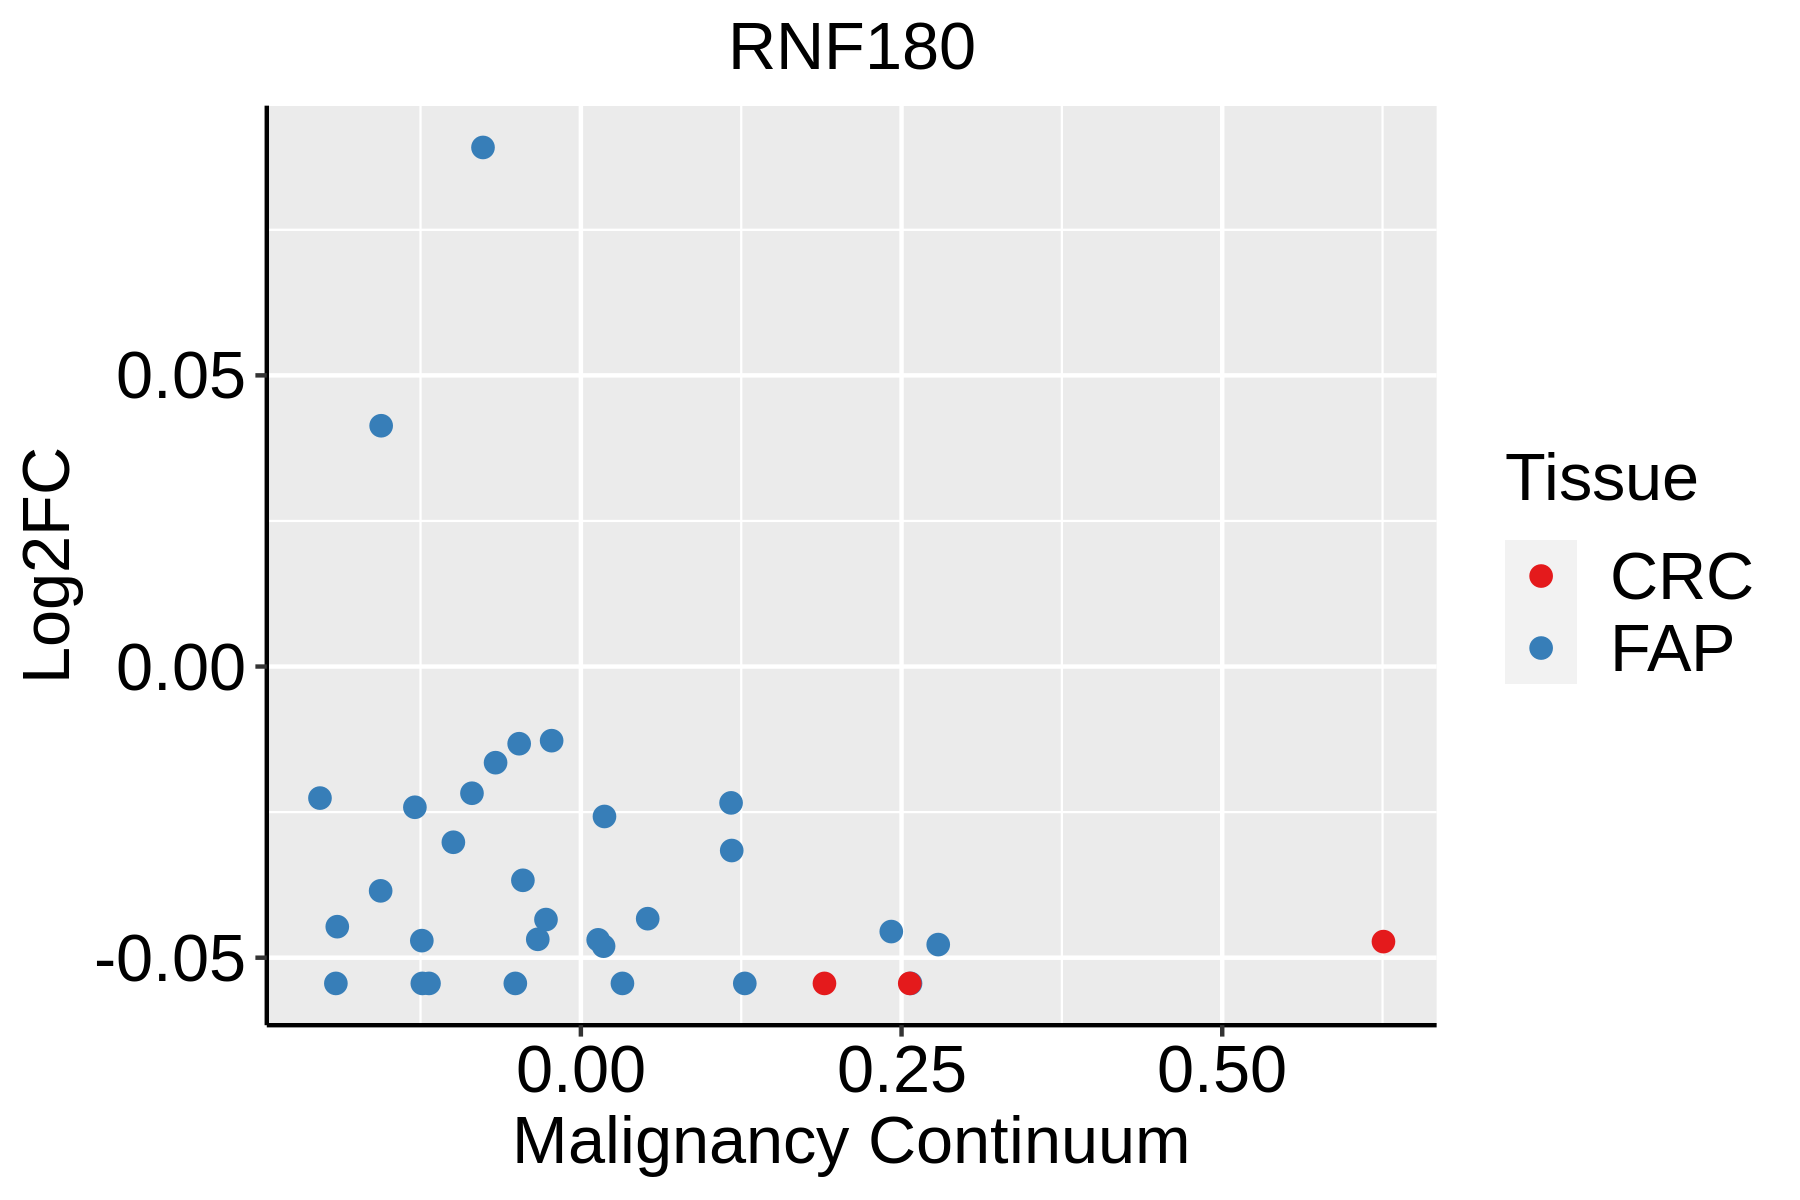 | FAP: Familial adenomatous polyposis |
| CRC: Colorectal cancer | ||
| Colorectum (HTA11) |  | AD: Adenomas |
| SER: Sessile serrated lesions | ||
| MSI-H: Microsatellite-high colorectal cancer | ||
| MSS: Microsatellite stable colorectal cancer | ||
| Endometrium | 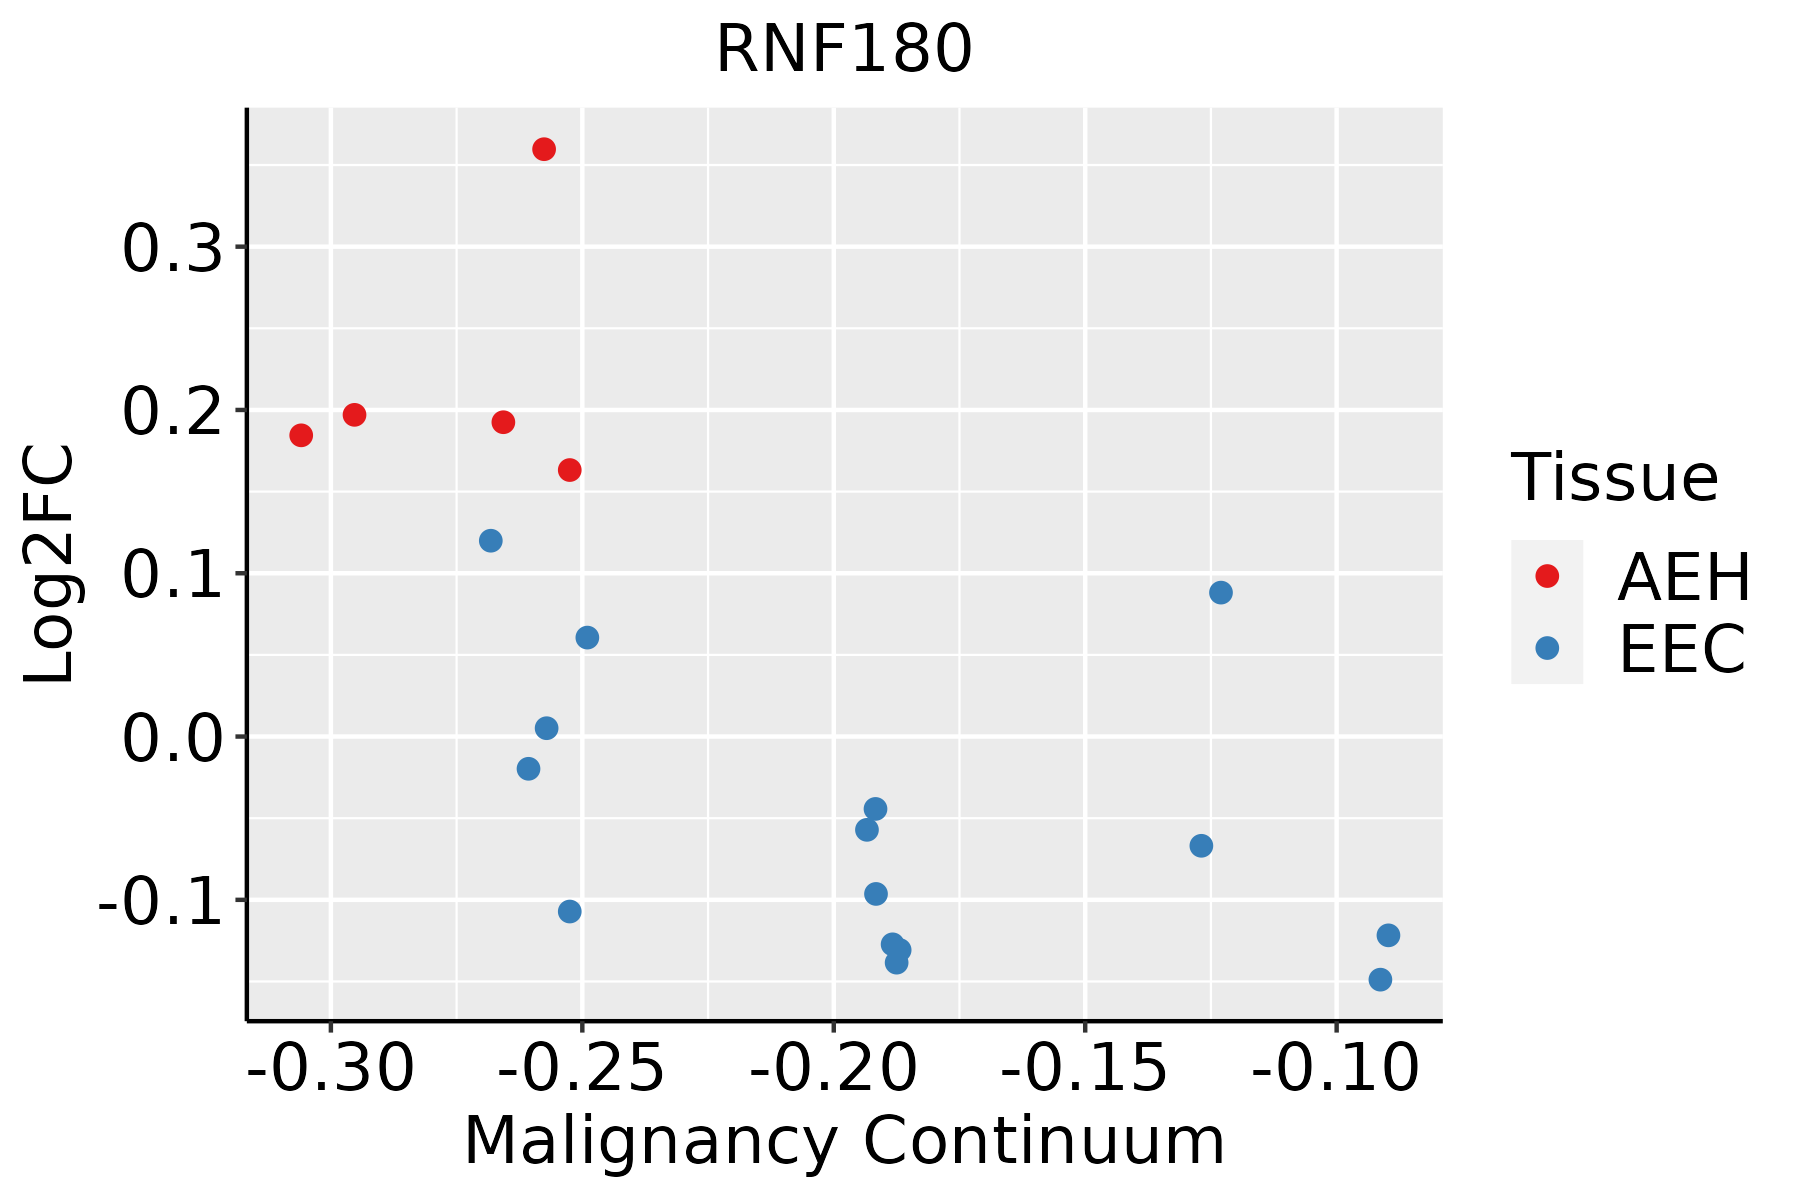 | AEH: Atypical endometrial hyperplasia |
| EEC: Endometrioid Cancer | ||
| Lung | 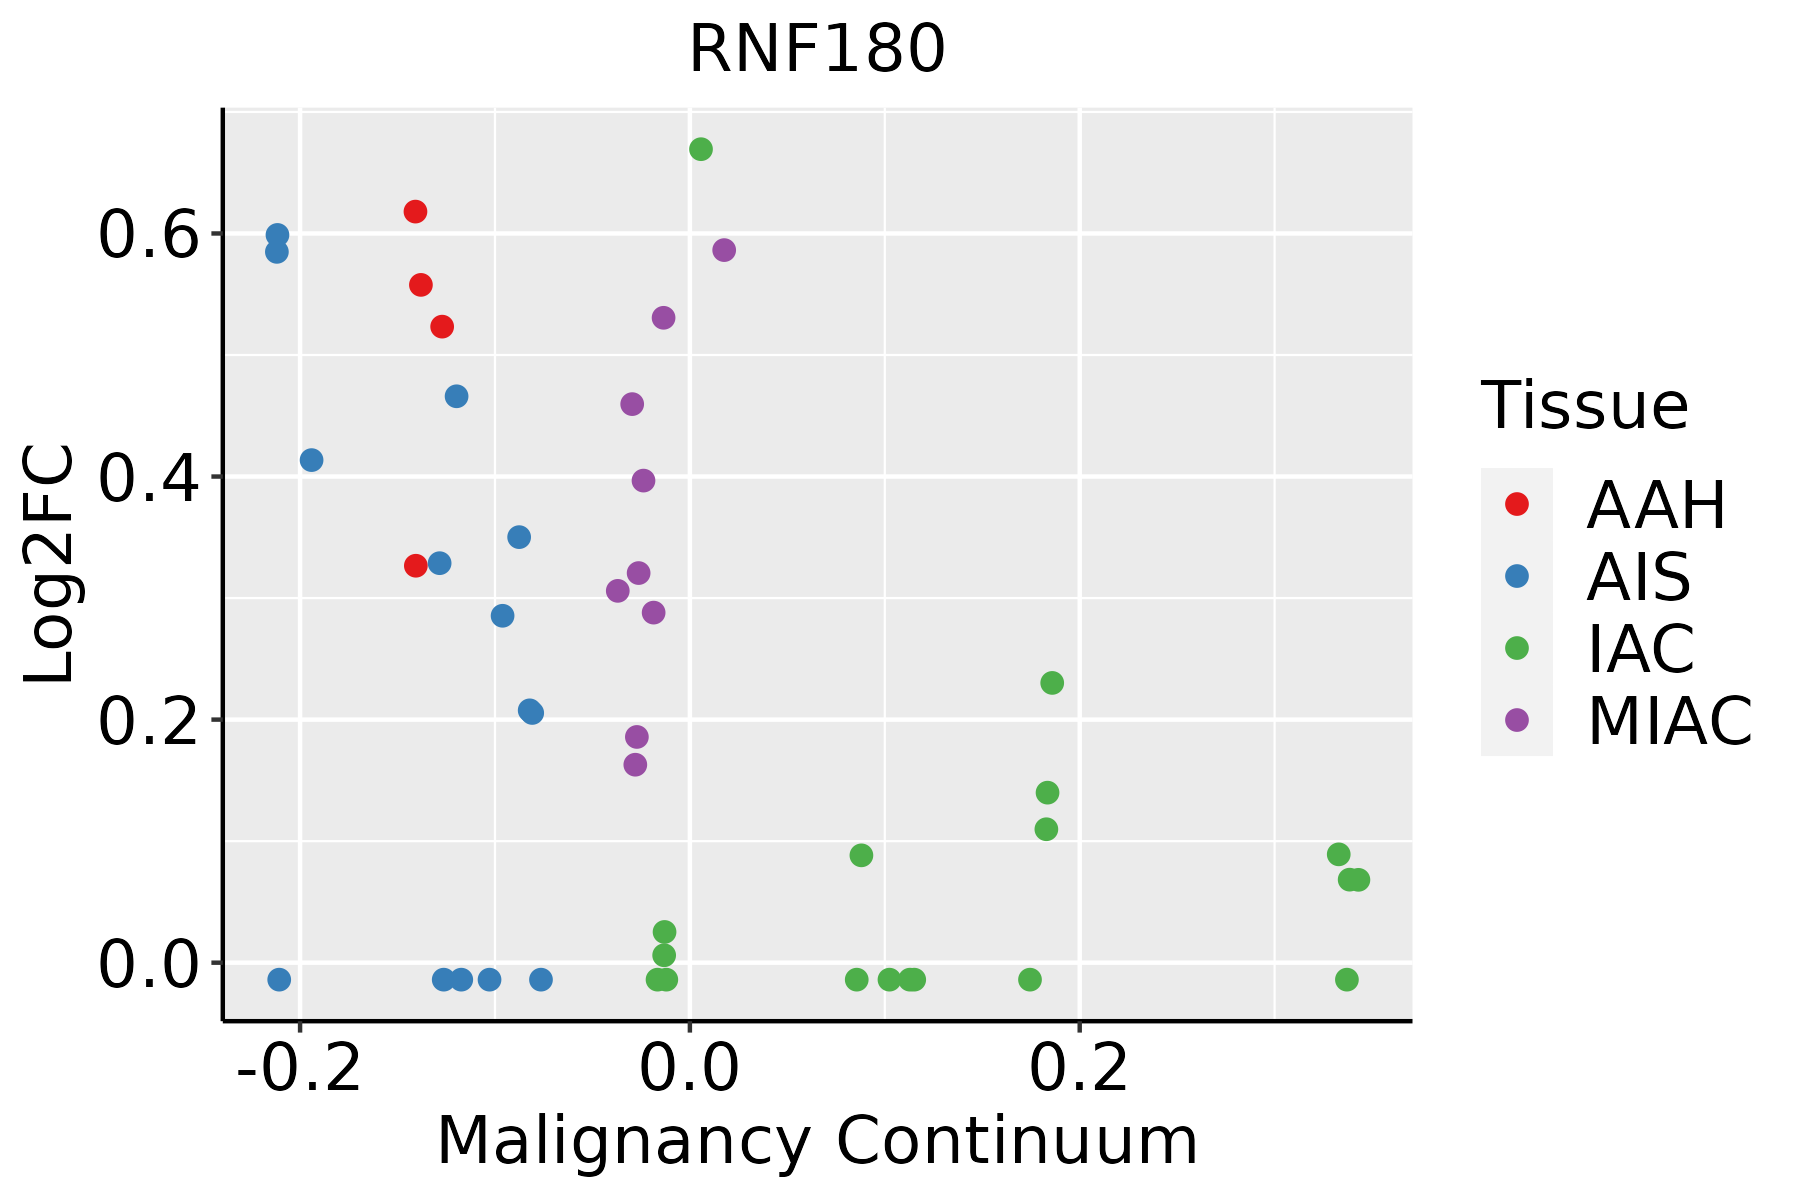 | AAH: Atypical adenomatous hyperplasia |
| AIS: Adenocarcinoma in situ | ||
| IAC: Invasive lung adenocarcinoma | ||
| MIA: Minimally invasive adenocarcinoma | ||
| Thyroid | 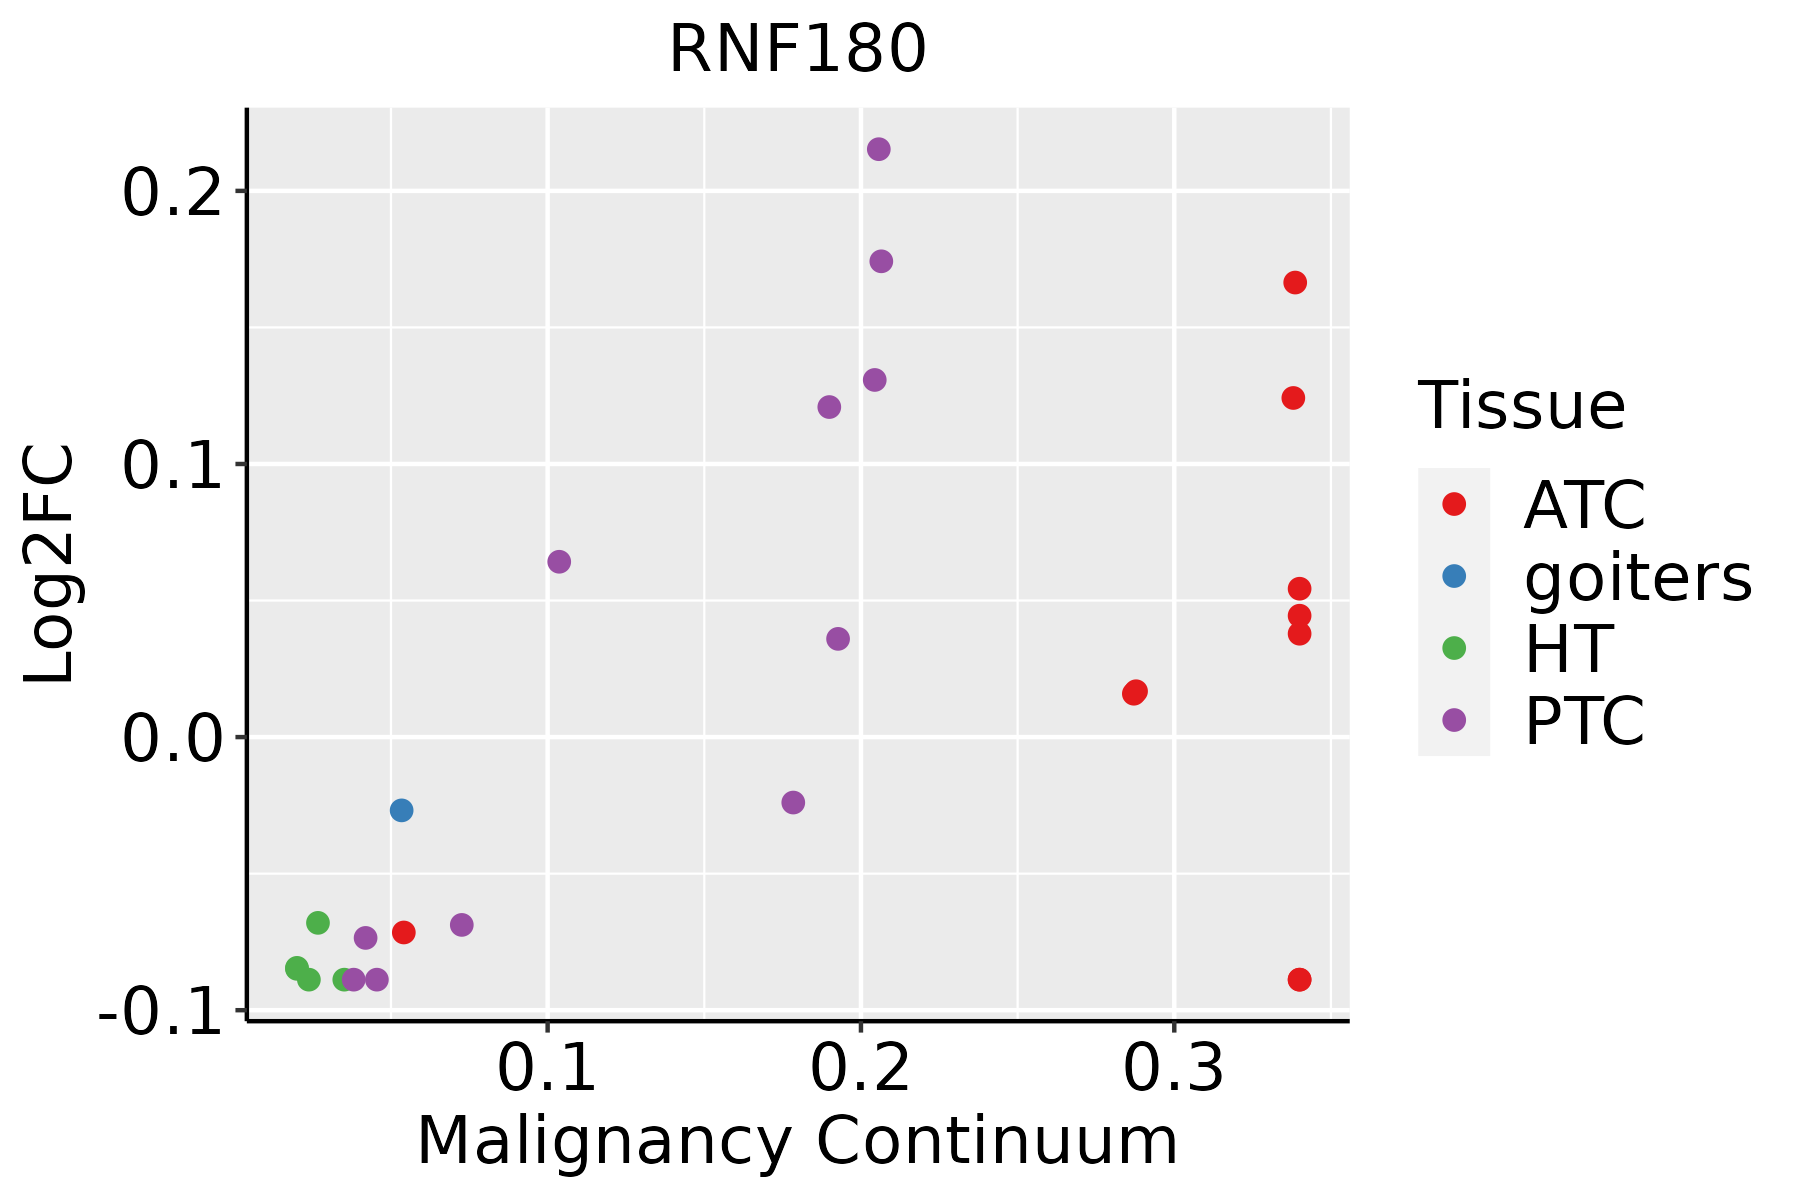 | ATC: Anaplastic thyroid cancer |
| HT: Hashimoto's thyroiditis | ||
| PTC: Papillary thyroid cancer |
| ∗log2FC in expression of this searched gene in stem-like cells from each diseased tissue sample relative to stem-like cells in normal samples in each tissue plotted against the malignancy continuum. Samples are colored based on if they are from different disease stage. |
Top |
Malignant transformation related pathway analysis |
| Find out the enriched GO biological processes and KEGG pathways involved in transition from healthy to precancer to cancer |
| Tissue | Disease Stage | Enriched GO biological Processes |
| Colorectum | AD |  |
| Colorectum | SER |  |
| Colorectum | MSS |  |
| Colorectum | MSI-H |  |
| Colorectum | FAP |  |
| ∗Top 15 enriched GO BP terms are showed in the bar plot of each disease state in each tissue. Each row represents a significant GO biological process which is colored according to the -log10(p.adjust). |
| Page: 1 2 3 4 5 6 7 8 9 |
| GO ID | Tissue | Disease Stage | Description | Gene Ratio | Bg Ratio | pvalue | p.adjust | Count |
| GO:190180016 | Endometrium | EEC | positive regulation of proteasomal protein catabolic process | 29/2168 | 114/18723 | 3.02e-05 | 5.26e-04 | 29 |
| GO:190332213 | Endometrium | EEC | positive regulation of protein modification by small protein conjugation or removal | 33/2168 | 138/18723 | 3.49e-05 | 5.90e-04 | 33 |
| GO:003139813 | Endometrium | EEC | positive regulation of protein ubiquitination | 29/2168 | 119/18723 | 7.05e-05 | 1.04e-03 | 29 |
| GO:000020913 | Endometrium | EEC | protein polyubiquitination | 46/2168 | 236/18723 | 2.65e-04 | 3.04e-03 | 46 |
| GO:004217613 | Lung | AIS | regulation of protein catabolic process | 92/1849 | 391/18723 | 1.34e-15 | 3.91e-12 | 92 |
| GO:000989613 | Lung | AIS | positive regulation of catabolic process | 103/1849 | 492/18723 | 9.59e-14 | 1.86e-10 | 103 |
| GO:004573213 | Lung | AIS | positive regulation of protein catabolic process | 60/1849 | 231/18723 | 1.47e-12 | 2.14e-09 | 60 |
| GO:003133113 | Lung | AIS | positive regulation of cellular catabolic process | 89/1849 | 427/18723 | 6.12e-12 | 4.46e-09 | 89 |
| GO:190336213 | Lung | AIS | regulation of cellular protein catabolic process | 62/1849 | 255/18723 | 1.37e-11 | 6.13e-09 | 62 |
| GO:200005813 | Lung | AIS | regulation of ubiquitin-dependent protein catabolic process | 43/1849 | 164/18723 | 1.55e-09 | 2.91e-07 | 43 |
| GO:190332013 | Lung | AIS | regulation of protein modification by small protein conjugation or removal | 55/1849 | 242/18723 | 2.75e-09 | 4.92e-07 | 55 |
| GO:190336413 | Lung | AIS | positive regulation of cellular protein catabolic process | 41/1849 | 155/18723 | 2.79e-09 | 4.92e-07 | 41 |
| GO:190305013 | Lung | AIS | regulation of proteolysis involved in cellular protein catabolic process | 51/1849 | 221/18723 | 5.97e-09 | 9.87e-07 | 51 |
| GO:004586213 | Lung | AIS | positive regulation of proteolysis | 73/1849 | 372/18723 | 7.68e-09 | 1.21e-06 | 73 |
| GO:200006013 | Lung | AIS | positive regulation of ubiquitin-dependent protein catabolic process | 31/1849 | 107/18723 | 2.36e-08 | 3.12e-06 | 31 |
| GO:004316113 | Lung | AIS | proteasome-mediated ubiquitin-dependent protein catabolic process | 77/1849 | 412/18723 | 2.74e-08 | 3.47e-06 | 77 |
| GO:001049813 | Lung | AIS | proteasomal protein catabolic process | 87/1849 | 490/18723 | 4.15e-08 | 5.03e-06 | 87 |
| GO:003139613 | Lung | AIS | regulation of protein ubiquitination | 46/1849 | 210/18723 | 1.71e-07 | 1.72e-05 | 46 |
| GO:000020912 | Lung | AIS | protein polyubiquitination | 49/1849 | 236/18723 | 3.85e-07 | 3.16e-05 | 49 |
| GO:190305212 | Lung | AIS | positive regulation of proteolysis involved in cellular protein catabolic process | 33/1849 | 133/18723 | 4.82e-07 | 3.65e-05 | 33 |
| Page: 1 2 3 4 5 6 7 8 9 10 |
| Pathway ID | Tissue | Disease Stage | Description | Gene Ratio | Bg Ratio | pvalue | p.adjust | qvalue | Count |
| Page: 1 |
Top |
Cell-cell communication analysis |
| Identification of potential cell-cell interactions between two cell types and their ligand-receptor pairs for different disease states |
| Ligand | Receptor | LRpair | Pathway | Tissue | Disease Stage |
| Page: 1 |
Top |
Single-cell gene regulatory network inference analysis |
| Find out the significant the regulons (TFs) and the target genes of each regulon across cell types for different disease states |
| TF | Cell Type | Tissue | Disease Stage | Target Gene | RSS | Regulon Activity |
| ∗The dot plots of a searched regulon are shown for all cell subpopulations in each disease state of each tissue based on the regulon specific score inferred using pySCENIC and by calculating the average expression. |
| Page: 1 |
Top |
Somatic mutation of malignant transformation related genes |
| Annotation of somatic variants for genes involved in malignant transformation |
| Hugo Symbol | Variant Class | Variant Classification | dbSNP RS | HGVSc | HGVSp | HGVSp Short | SWISSPROT | BIOTYPE | SIFT | PolyPhen | Tumor Sample Barcode | Tissue | Histology | Sex | Age | Stage | Therapy Types | Drugs | Outcome |
| RNF180 | SNV | Missense_Mutation | novel | c.1502N>C | p.Ile501Thr | p.I501T | Q86T96 | protein_coding | deleterious(0.04) | benign(0.007) | TCGA-AN-A046-01 | Breast | breast invasive carcinoma | Female | >=65 | I/II | Unknown | Unknown | SD |
| RNF180 | SNV | Missense_Mutation | c.1037C>T | p.Ser346Leu | p.S346L | Q86T96 | protein_coding | tolerated(0.27) | benign(0.203) | TCGA-BH-A0DT-01 | Breast | breast invasive carcinoma | Female | <65 | I/II | Chemotherapy | taxotere | CR | |
| RNF180 | SNV | Missense_Mutation | c.1378N>A | p.Leu460Met | p.L460M | Q86T96 | protein_coding | deleterious(0) | probably_damaging(0.998) | TCGA-BH-A18J-01 | Breast | breast invasive carcinoma | Female | <65 | III/IV | Unknown | Unknown | PD | |
| RNF180 | SNV | Missense_Mutation | novel | c.1497N>C | p.Leu499Phe | p.L499F | Q86T96 | protein_coding | tolerated(0.05) | benign(0.246) | TCGA-PE-A5DE-01 | Breast | breast invasive carcinoma | Female | <65 | I/II | Chemotherapy | taxotere | CR |
| RNF180 | insertion | Frame_Shift_Ins | novel | c.710_711insTTGCTATTACTTTCTCCTCCTTTTCCTTCCTCCTTCCTCCGTGTGG | p.Glu237AspfsTer26 | p.E237Dfs*26 | Q86T96 | protein_coding | TCGA-A8-A07G-01 | Breast | breast invasive carcinoma | Female | >=65 | I/II | Chemotherapy | 5-fluorouracil | CR | ||
| RNF180 | SNV | Missense_Mutation | novel | c.1223N>T | p.His408Leu | p.H408L | Q86T96 | protein_coding | tolerated(0.33) | benign(0.039) | TCGA-VS-A8EL-01 | Cervix | cervical & endocervical cancer | Female | <65 | I/II | Chemotherapy | cisplatin | CR |
| RNF180 | SNV | Missense_Mutation | rs373363351 | c.186G>C | p.Met62Ile | p.M62I | Q86T96 | protein_coding | tolerated(0.06) | benign(0.292) | TCGA-VS-A953-01 | Cervix | cervical & endocervical cancer | Female | <65 | I/II | Unknown | Unknown | PD |
| RNF180 | SNV | Missense_Mutation | c.832N>A | p.Tyr278Asn | p.Y278N | Q86T96 | protein_coding | tolerated(0.44) | benign(0) | TCGA-AA-3693-01 | Colorectum | colon adenocarcinoma | Female | >=65 | III/IV | Unknown | Unknown | SD | |
| RNF180 | SNV | Missense_Mutation | novel | c.1592A>G | p.His531Arg | p.H531R | Q86T96 | protein_coding | tolerated(1) | benign(0) | TCGA-AA-3815-01 | Colorectum | colon adenocarcinoma | Female | >=65 | I/II | Unknown | Unknown | SD |
| RNF180 | SNV | Missense_Mutation | novel | c.443N>G | p.Asp148Gly | p.D148G | Q86T96 | protein_coding | tolerated(0.09) | benign(0.057) | TCGA-AA-3984-01 | Colorectum | colon adenocarcinoma | Female | <65 | I/II | Unknown | Unknown | SD |
| Page: 1 2 3 4 5 6 7 |
Top |
Related drugs of malignant transformation related genes |
| Identification of chemicals and drugs interact with genes involved in malignant transfromation |
| (DGIdb 4.0) |
| Entrez ID | Symbol | Category | Interaction Types | Drug Claim Name | Drug Name | PMIDs |
| Page: 1 |

Copyright 2023-Present -The University of Texas Health Science Center at Houston |