
|
|||||
|
 | |
| |
| |
| |
| |
| |
|
Gene: RIOK3 |
Gene summary for RIOK3 |
| Gene information | Species | Human | Gene symbol | RIOK3 | Gene ID | 8780 |
| Gene name | RIO kinase 3 | |
| Gene Alias | SUDD | |
| Cytomap | 18q11.2 | |
| Gene Type | protein-coding | GO ID | GO:0001816 | UniProtAcc | B0YJ89 |
Top |
Malignant transformation analysis |
| Identification of the aberrant gene expression in precancerous and cancerous lesions by comparing the gene expression of stem-like cells in diseased tissues with normal stem cells |
| Entrez ID | Symbol | Replicates | Species | Organ | Tissue | Adj P-value | Log2FC | Malignancy |
| 8780 | RIOK3 | HTA11_2487_2000001011 | Human | Colorectum | SER | 8.93e-06 | 4.50e-01 | -0.1808 |
| 8780 | RIOK3 | HTA11_1938_2000001011 | Human | Colorectum | AD | 3.65e-02 | 3.31e-01 | -0.0811 |
| 8780 | RIOK3 | HTA11_78_2000001011 | Human | Colorectum | AD | 4.01e-02 | 3.98e-01 | -0.1088 |
| 8780 | RIOK3 | HTA11_347_2000001011 | Human | Colorectum | AD | 7.04e-19 | 6.60e-01 | -0.1954 |
| 8780 | RIOK3 | HTA11_411_2000001011 | Human | Colorectum | SER | 1.30e-06 | 1.23e+00 | -0.2602 |
| 8780 | RIOK3 | HTA11_2112_2000001011 | Human | Colorectum | SER | 1.83e-02 | 7.65e-01 | -0.2196 |
| 8780 | RIOK3 | HTA11_696_2000001011 | Human | Colorectum | AD | 9.31e-05 | 4.26e-01 | -0.1464 |
| 8780 | RIOK3 | HTA11_1391_2000001011 | Human | Colorectum | AD | 5.50e-05 | 4.36e-01 | -0.059 |
| 8780 | RIOK3 | A015-C-203 | Human | Colorectum | FAP | 4.37e-08 | -7.70e-02 | -0.1294 |
| 8780 | RIOK3 | A001-C-108 | Human | Colorectum | FAP | 6.12e-04 | 2.24e-03 | -0.0272 |
| 8780 | RIOK3 | A002-C-205 | Human | Colorectum | FAP | 1.15e-02 | -1.55e-01 | -0.1236 |
| 8780 | RIOK3 | A015-C-106 | Human | Colorectum | FAP | 2.48e-02 | -4.27e-02 | -0.0511 |
| 8780 | RIOK3 | A015-C-104 | Human | Colorectum | FAP | 2.18e-08 | -8.77e-02 | -0.1899 |
| 8780 | RIOK3 | A002-C-016 | Human | Colorectum | FAP | 7.33e-04 | -8.75e-02 | 0.0521 |
| 8780 | RIOK3 | A002-C-116 | Human | Colorectum | FAP | 1.36e-10 | -3.96e-02 | -0.0452 |
| 8780 | RIOK3 | A018-E-020 | Human | Colorectum | FAP | 4.74e-02 | 3.80e-02 | -0.2034 |
| 8780 | RIOK3 | F034 | Human | Colorectum | FAP | 6.79e-06 | -1.27e-01 | -0.0665 |
| 8780 | RIOK3 | CRC-1-8810 | Human | Colorectum | CRC | 2.17e-03 | -1.14e-01 | 0.6257 |
| 8780 | RIOK3 | LZE4T | Human | Esophagus | ESCC | 1.79e-18 | 6.58e-01 | 0.0811 |
| 8780 | RIOK3 | LZE5T | Human | Esophagus | ESCC | 6.89e-05 | 8.09e-01 | 0.0514 |
| Page: 1 2 3 4 5 6 7 8 9 |
| Tissue | Expression Dynamics | Abbreviation |
| Colorectum (GSE201348) |  | FAP: Familial adenomatous polyposis |
| CRC: Colorectal cancer | ||
| Colorectum (HTA11) |  | AD: Adenomas |
| SER: Sessile serrated lesions | ||
| MSI-H: Microsatellite-high colorectal cancer | ||
| MSS: Microsatellite stable colorectal cancer | ||
| Esophagus | 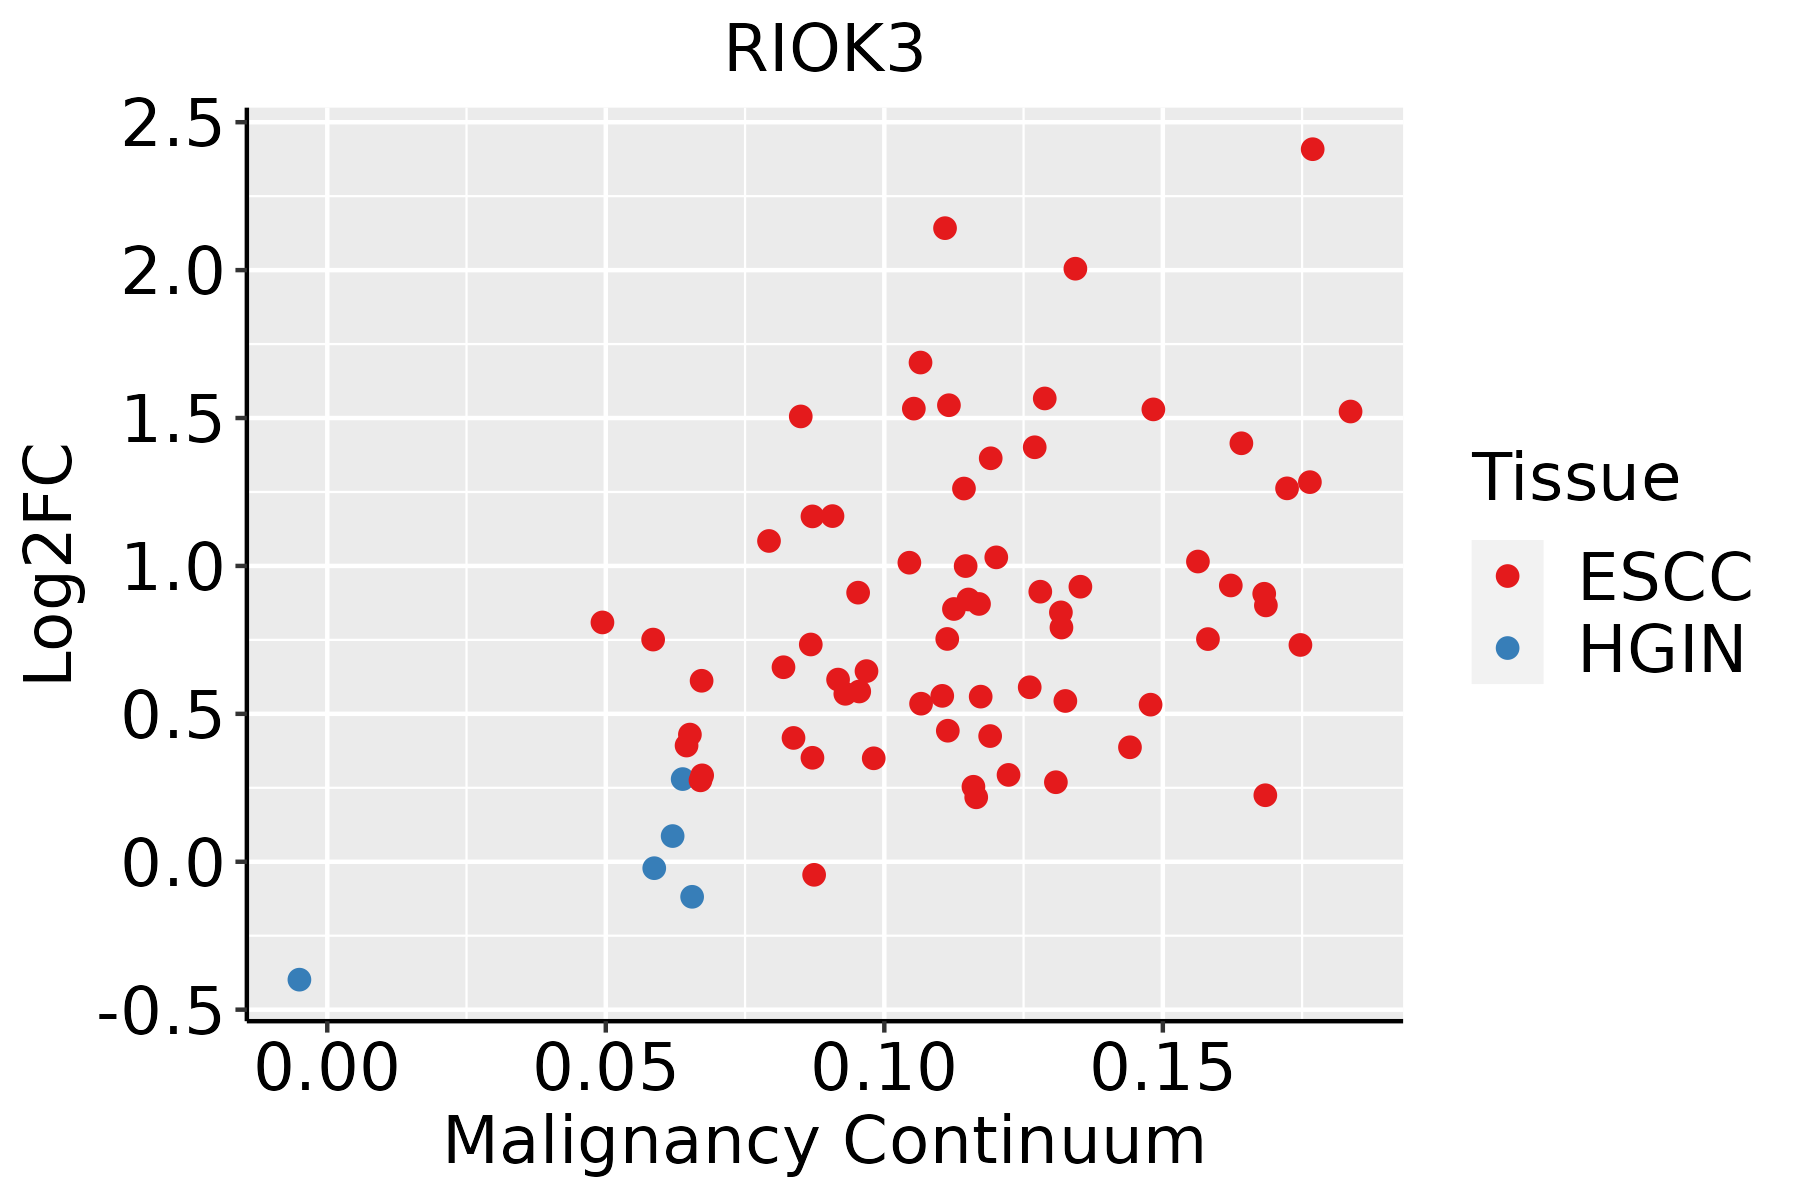 | ESCC: Esophageal squamous cell carcinoma |
| HGIN: High-grade intraepithelial neoplasias | ||
| LGIN: Low-grade intraepithelial neoplasias | ||
| GC | 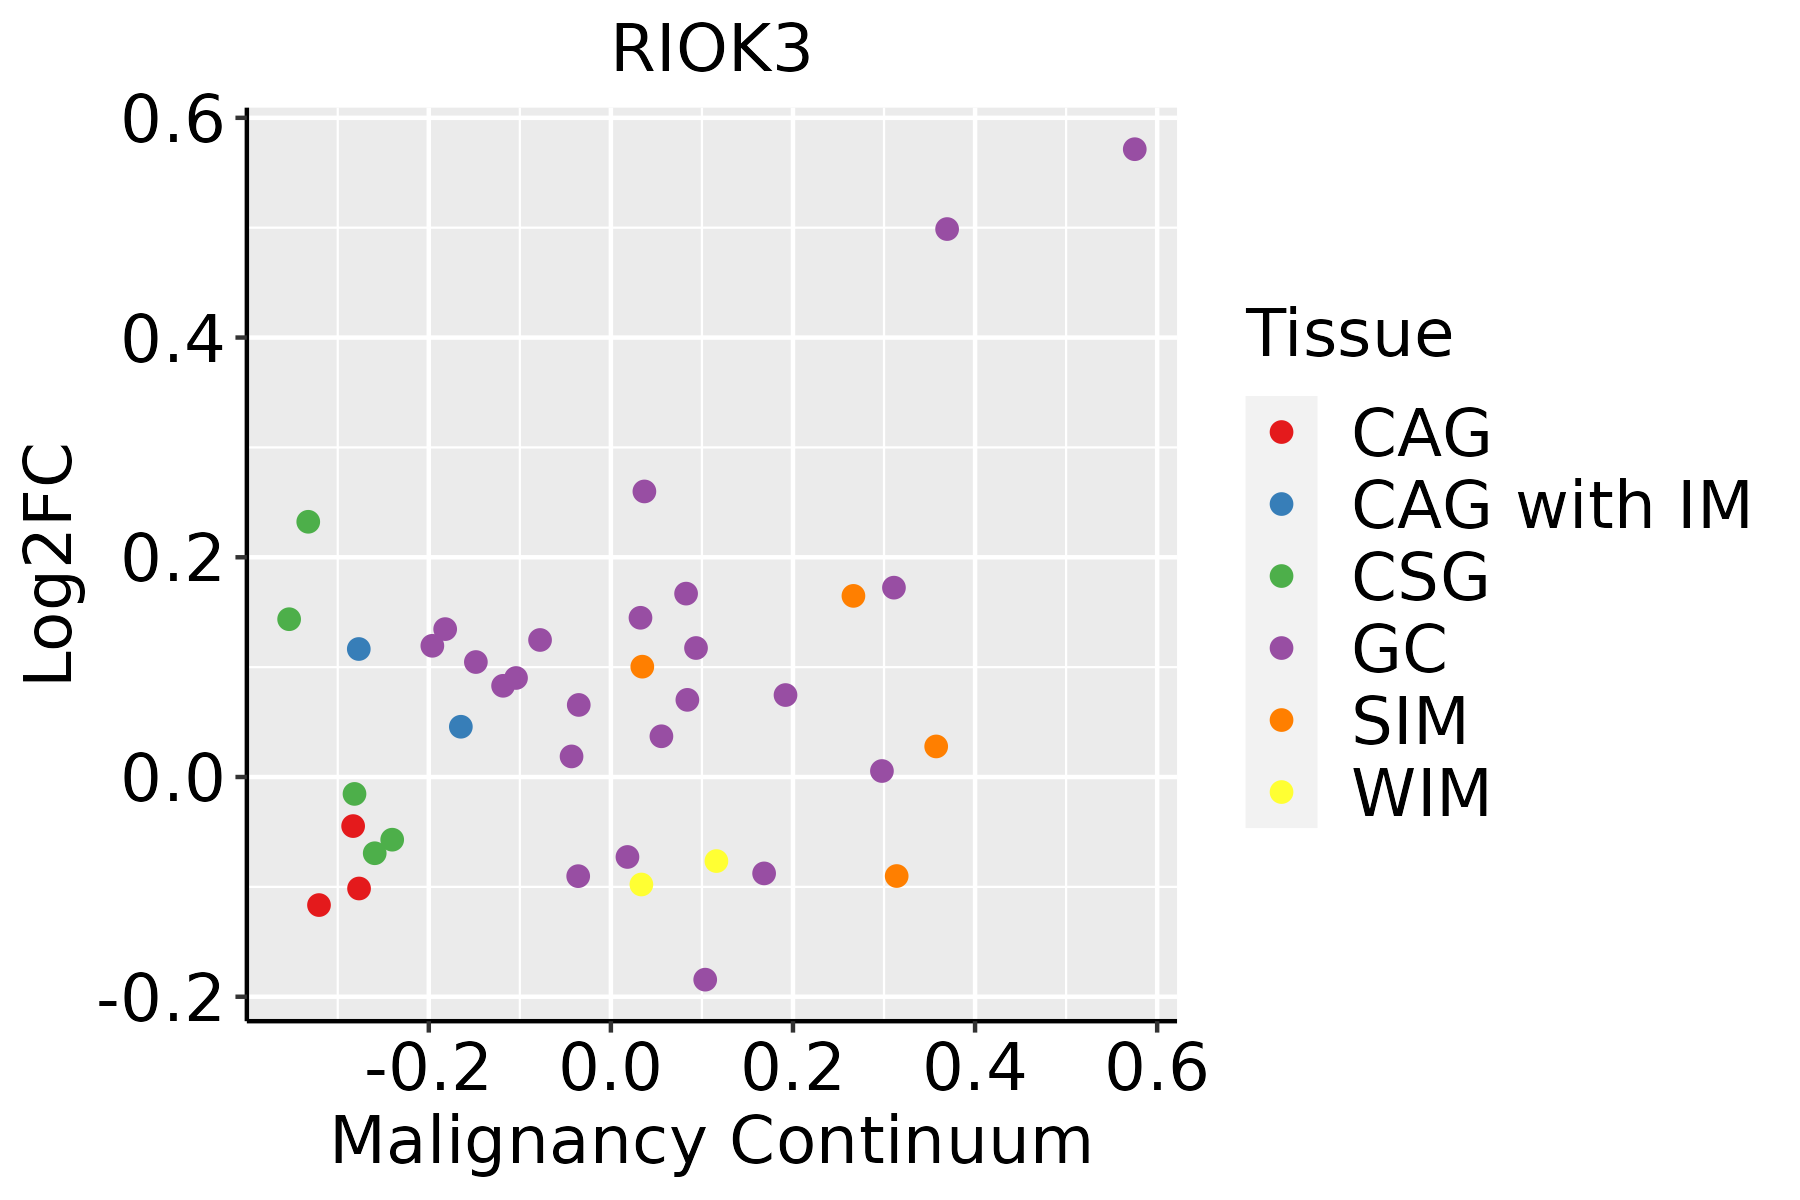 | CAG: Chronic atrophic gastritis |
| CAG with IM: Chronic atrophic gastritis with intestinal metaplasia | ||
| CSG: Chronic superficial gastritis | ||
| GC: Gastric cancer | ||
| SIM: Severe intestinal metaplasia | ||
| WIM: Wild intestinal metaplasia | ||
| Liver | 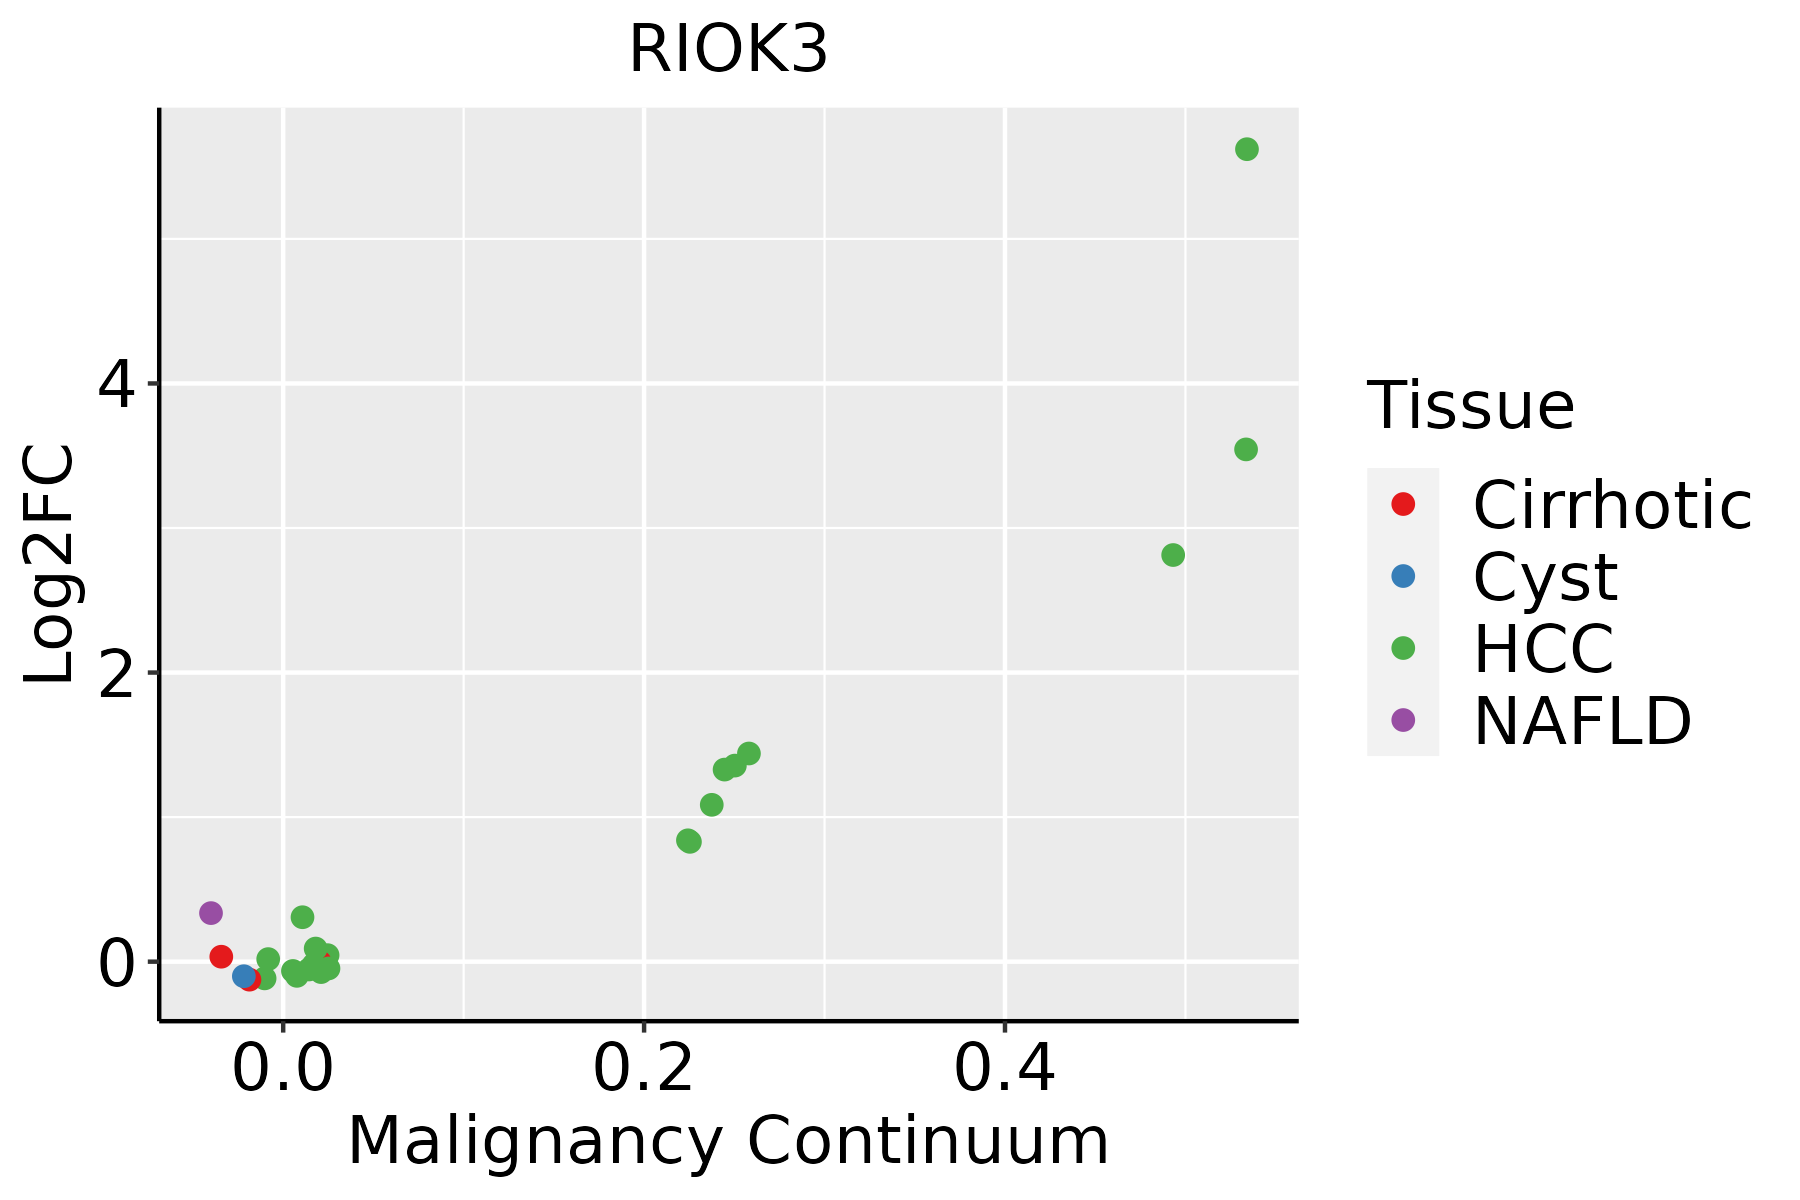 | HCC: Hepatocellular carcinoma |
| NAFLD: Non-alcoholic fatty liver disease | ||
| Oral Cavity |  | EOLP: Erosive Oral lichen planus |
| LP: leukoplakia | ||
| NEOLP: Non-erosive oral lichen planus | ||
| OSCC: Oral squamous cell carcinoma | ||
| Prostate | 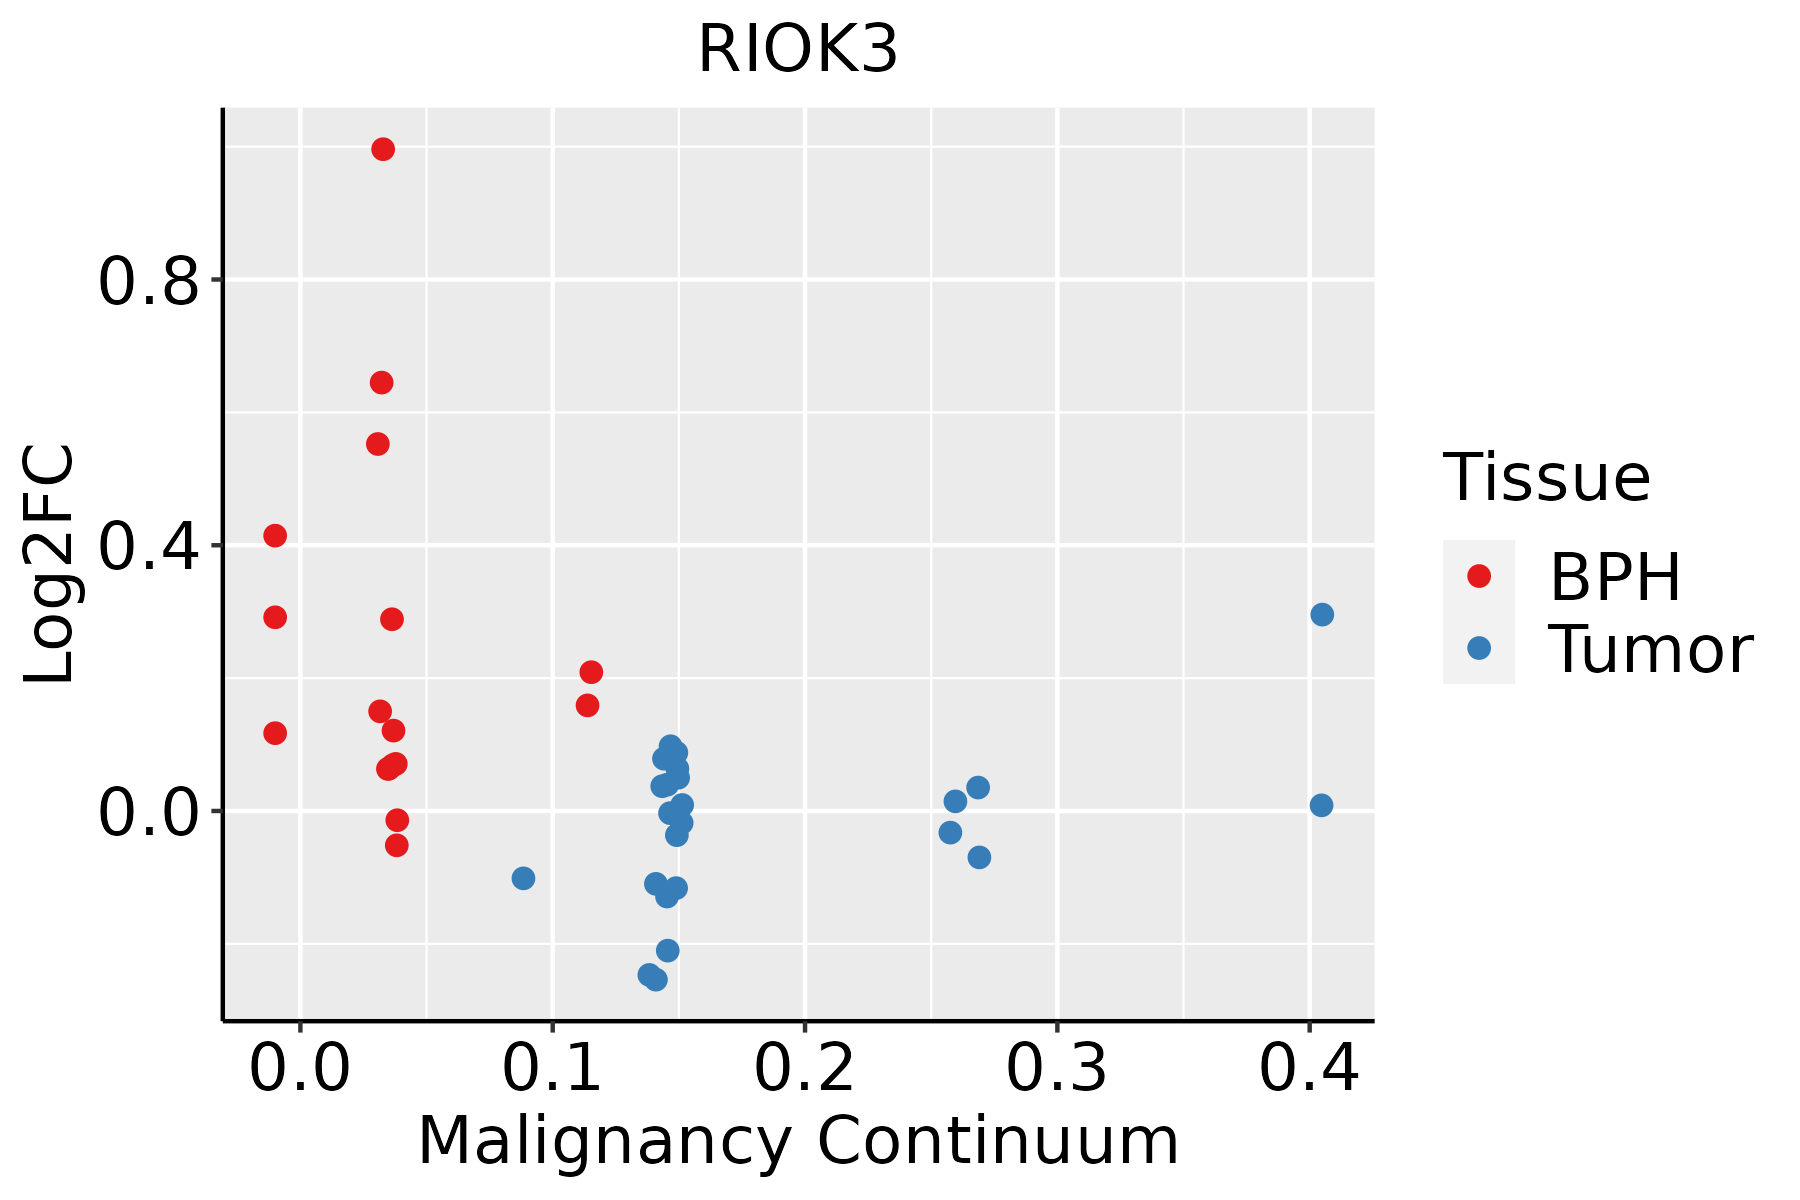 | BPH: Benign Prostatic Hyperplasia |
| Skin | 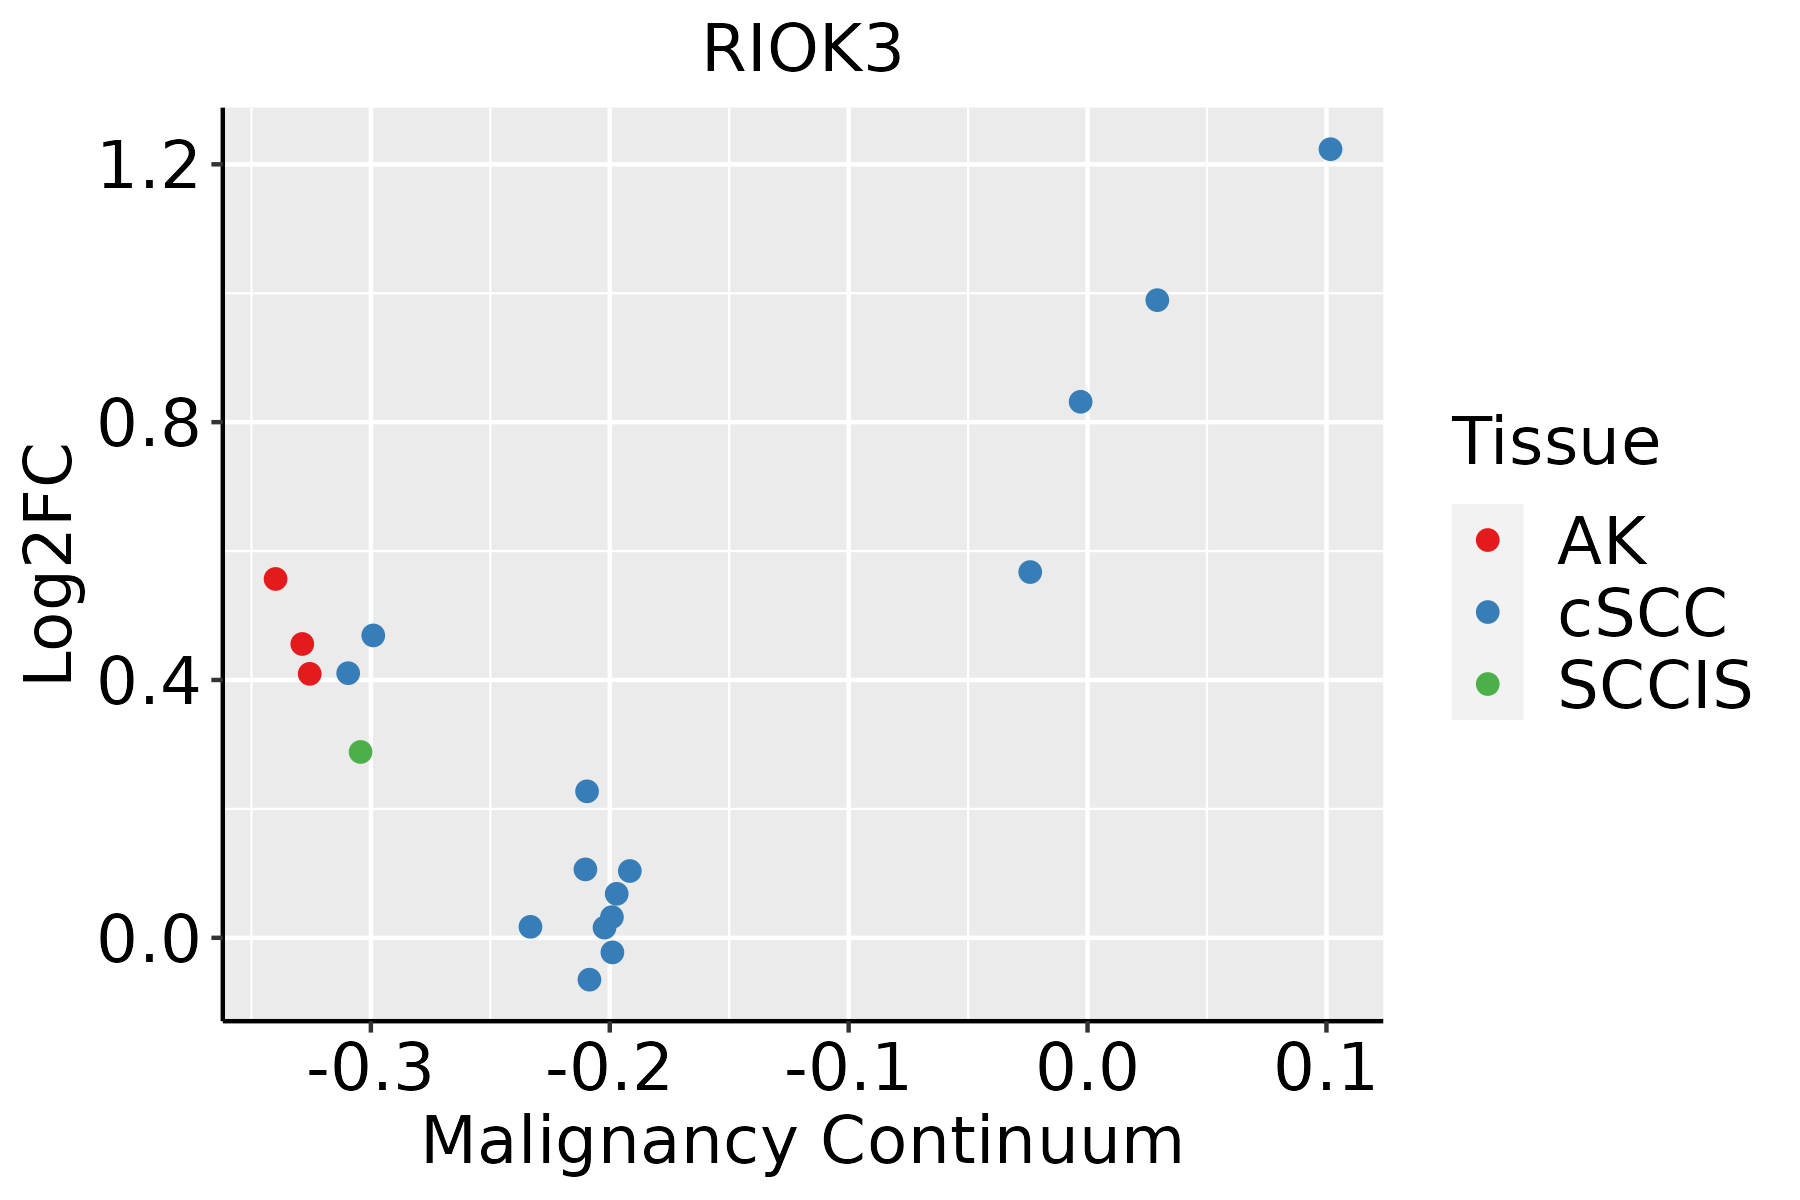 | AK: Actinic keratosis |
| cSCC: Cutaneous squamous cell carcinoma | ||
| SCCIS:squamous cell carcinoma in situ | ||
| Thyroid | 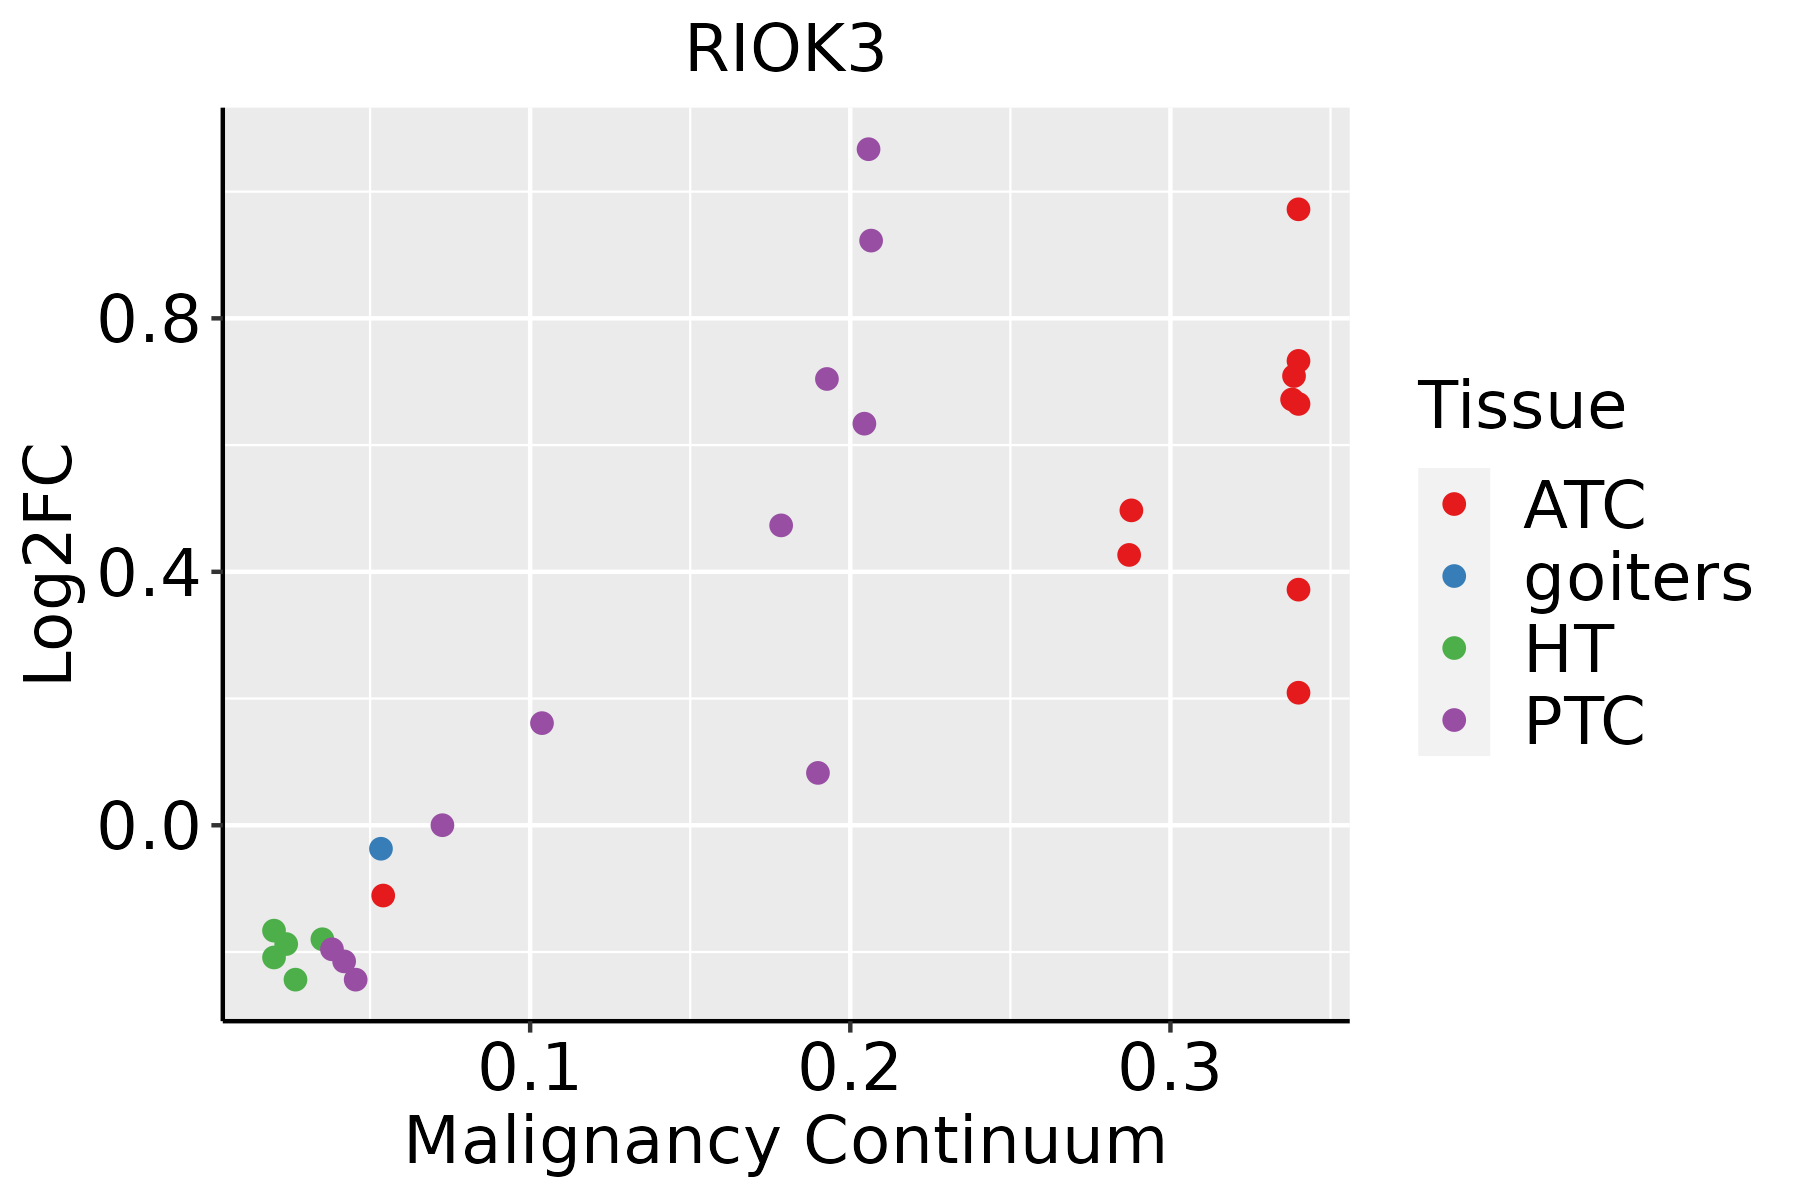 | ATC: Anaplastic thyroid cancer |
| HT: Hashimoto's thyroiditis | ||
| PTC: Papillary thyroid cancer |
| ∗log2FC in expression of this searched gene in stem-like cells from each diseased tissue sample relative to stem-like cells in normal samples in each tissue plotted against the malignancy continuum. Samples are colored based on if they are from different disease stage. |
Top |
Malignant transformation related pathway analysis |
| Find out the enriched GO biological processes and KEGG pathways involved in transition from healthy to precancer to cancer |
| Tissue | Disease Stage | Enriched GO biological Processes |
| Colorectum | AD |  |
| Colorectum | SER |  |
| Colorectum | MSS |  |
| Colorectum | MSI-H |  |
| Colorectum | FAP |  |
| ∗Top 15 enriched GO BP terms are showed in the bar plot of each disease state in each tissue. Each row represents a significant GO biological process which is colored according to the -log10(p.adjust). |
| Page: 1 2 3 4 5 6 7 8 9 |
| GO ID | Tissue | Disease Stage | Description | Gene Ratio | Bg Ratio | pvalue | p.adjust | Count |
| GO:00022211 | Liver | HCC | pattern recognition receptor signaling pathway | 107/7958 | 172/18723 | 1.37e-07 | 2.58e-06 | 107 |
| GO:00516071 | Liver | HCC | defense response to virus | 151/7958 | 265/18723 | 1.27e-06 | 1.85e-05 | 151 |
| GO:01405461 | Liver | HCC | defense response to symbiont | 151/7958 | 265/18723 | 1.27e-06 | 1.85e-05 | 151 |
| GO:00985861 | Liver | HCC | cellular response to virus | 57/7958 | 84/18723 | 2.30e-06 | 3.11e-05 | 57 |
| GO:000724912 | Liver | HCC | I-kappaB kinase/NF-kappaB signaling | 156/7958 | 281/18723 | 6.66e-06 | 8.00e-05 | 156 |
| GO:00324814 | Liver | HCC | positive regulation of type I interferon production | 41/7958 | 58/18723 | 1.29e-05 | 1.44e-04 | 41 |
| GO:004312212 | Liver | HCC | regulation of I-kappaB kinase/NF-kappaB signaling | 138/7958 | 249/18723 | 2.47e-05 | 2.58e-04 | 138 |
| GO:0032479 | Liver | HCC | regulation of type I interferon production | 60/7958 | 95/18723 | 3.84e-05 | 3.80e-04 | 60 |
| GO:0032606 | Liver | HCC | type I interferon production | 60/7958 | 95/18723 | 3.84e-05 | 3.80e-04 | 60 |
| GO:0039531 | Liver | HCC | regulation of viral-induced cytoplasmic pattern recognition receptor signaling pathway | 20/7958 | 24/18723 | 4.92e-05 | 4.70e-04 | 20 |
| GO:00028321 | Liver | HCC | negative regulation of response to biotic stimulus | 66/7958 | 108/18723 | 7.24e-05 | 6.50e-04 | 66 |
| GO:00028312 | Liver | HCC | regulation of response to biotic stimulus | 173/7958 | 327/18723 | 8.55e-05 | 7.48e-04 | 173 |
| GO:0050687 | Liver | HCC | negative regulation of defense response to virus | 18/7958 | 24/18723 | 1.27e-03 | 6.92e-03 | 18 |
| GO:0032728 | Liver | HCC | positive regulation of interferon-beta production | 26/7958 | 39/18723 | 1.99e-03 | 1.01e-02 | 26 |
| GO:00622072 | Liver | HCC | regulation of pattern recognition receptor signaling pathway | 59/7958 | 105/18723 | 3.18e-03 | 1.47e-02 | 59 |
| GO:00450881 | Liver | HCC | regulation of innate immune response | 113/7958 | 218/18723 | 3.27e-03 | 1.50e-02 | 113 |
| GO:0050688 | Liver | HCC | regulation of defense response to virus | 41/7958 | 69/18723 | 3.38e-03 | 1.54e-02 | 41 |
| GO:0071359 | Liver | HCC | cellular response to dsRNA | 16/7958 | 22/18723 | 4.03e-03 | 1.76e-02 | 16 |
| GO:0050777 | Liver | HCC | negative regulation of immune response | 101/7958 | 194/18723 | 4.40e-03 | 1.90e-02 | 101 |
| GO:0032608 | Liver | HCC | interferon-beta production | 34/7958 | 56/18723 | 4.54e-03 | 1.96e-02 | 34 |
| Page: 1 2 3 4 5 6 7 8 9 10 11 12 13 14 15 16 17 18 19 20 21 22 |
| Pathway ID | Tissue | Disease Stage | Description | Gene Ratio | Bg Ratio | pvalue | p.adjust | qvalue | Count |
| Page: 1 |
Top |
Cell-cell communication analysis |
| Identification of potential cell-cell interactions between two cell types and their ligand-receptor pairs for different disease states |
| Ligand | Receptor | LRpair | Pathway | Tissue | Disease Stage |
| Page: 1 |
Top |
Single-cell gene regulatory network inference analysis |
| Find out the significant the regulons (TFs) and the target genes of each regulon across cell types for different disease states |
| TF | Cell Type | Tissue | Disease Stage | Target Gene | RSS | Regulon Activity |
| ∗The dot plots of a searched regulon are shown for all cell subpopulations in each disease state of each tissue based on the regulon specific score inferred using pySCENIC and by calculating the average expression. |
| Page: 1 |
Top |
Somatic mutation of malignant transformation related genes |
| Annotation of somatic variants for genes involved in malignant transformation |
| Hugo Symbol | Variant Class | Variant Classification | dbSNP RS | HGVSc | HGVSp | HGVSp Short | SWISSPROT | BIOTYPE | SIFT | PolyPhen | Tumor Sample Barcode | Tissue | Histology | Sex | Age | Stage | Therapy Types | Drugs | Outcome |
| RIOK3 | SNV | Missense_Mutation | novel | c.1258N>C | p.Trp420Arg | p.W420R | O14730 | protein_coding | deleterious(0) | probably_damaging(0.995) | TCGA-A2-A4RW-01 | Breast | breast invasive carcinoma | Female | <65 | III/IV | Unknown | Unknown | SD |
| RIOK3 | SNV | Missense_Mutation | rs774183551 | c.643C>T | p.Arg215Cys | p.R215C | O14730 | protein_coding | deleterious(0) | probably_damaging(0.925) | TCGA-JW-A852-01 | Cervix | cervical & endocervical cancer | Female | <65 | I/II | Unknown | Unknown | PD |
| RIOK3 | SNV | Missense_Mutation | novel | c.824N>C | p.Asp275Ala | p.D275A | O14730 | protein_coding | deleterious(0.05) | benign(0.012) | TCGA-XS-A8TJ-01 | Cervix | cervical & endocervical cancer | Female | <65 | I/II | Chemotherapy | cisplatin | SD |
| RIOK3 | SNV | Missense_Mutation | novel | c.292C>T | p.Arg98Cys | p.R98C | O14730 | protein_coding | deleterious(0.02) | possibly_damaging(0.794) | TCGA-AA-3949-01 | Colorectum | colon adenocarcinoma | Female | >=65 | III/IV | Unknown | Unknown | SD |
| RIOK3 | SNV | Missense_Mutation | c.341N>T | p.Glu114Val | p.E114V | O14730 | protein_coding | deleterious(0.02) | benign(0.298) | TCGA-AA-3955-01 | Colorectum | colon adenocarcinoma | Male | <65 | III/IV | Chemotherapy | capecitabine | CR | |
| RIOK3 | SNV | Missense_Mutation | c.1202N>T | p.Thr401Met | p.T401M | O14730 | protein_coding | tolerated(0.05) | benign(0.431) | TCGA-G4-6302-01 | Colorectum | colon adenocarcinoma | Female | >=65 | I/II | Unknown | Unknown | SD | |
| RIOK3 | SNV | Missense_Mutation | novel | c.109G>A | p.Asp37Asn | p.D37N | O14730 | protein_coding | deleterious(0.05) | benign(0.021) | TCGA-A5-A0G2-01 | Endometrium | uterine corpus endometrioid carcinoma | Female | <65 | III/IV | Unknown | Unknown | SD |
| RIOK3 | SNV | Missense_Mutation | rs199977739 | c.1009G>A | p.Ala337Thr | p.A337T | O14730 | protein_coding | tolerated(0.94) | benign(0) | TCGA-AJ-A3BG-01 | Endometrium | uterine corpus endometrioid carcinoma | Female | >=65 | I/II | Chemotherapy | carboplatin | PD |
| RIOK3 | SNV | Missense_Mutation | novel | c.292N>T | p.Arg98Cys | p.R98C | O14730 | protein_coding | deleterious(0.02) | possibly_damaging(0.794) | TCGA-AJ-A3EK-01 | Endometrium | uterine corpus endometrioid carcinoma | Female | <65 | I/II | Chemotherapy | carboplatin | CR |
| RIOK3 | SNV | Missense_Mutation | c.481N>T | p.Asp161Tyr | p.D161Y | O14730 | protein_coding | tolerated(0.06) | possibly_damaging(0.641) | TCGA-AP-A056-01 | Endometrium | uterine corpus endometrioid carcinoma | Female | <65 | I/II | Unknown | Unknown | SD |
| Page: 1 2 3 4 5 |
Top |
Related drugs of malignant transformation related genes |
| Identification of chemicals and drugs interact with genes involved in malignant transfromation |
| (DGIdb 4.0) |
| Entrez ID | Symbol | Category | Interaction Types | Drug Claim Name | Drug Name | PMIDs |
| Page: 1 |

Copyright 2023-Present -The University of Texas Health Science Center at Houston |