
|
|||||
|
 | |
| |
| |
| |
| |
| |
|
Gene: RBM8A |
Gene summary for RBM8A |
| Gene information | Species | Human | Gene symbol | RBM8A | Gene ID | 9939 |
| Gene name | RNA binding motif protein 8A | |
| Gene Alias | BOV-1A | |
| Cytomap | 1q21.1 | |
| Gene Type | protein-coding | GO ID | GO:0000184 | UniProtAcc | A0A023T787 |
Top |
Malignant transformation analysis |
| Identification of the aberrant gene expression in precancerous and cancerous lesions by comparing the gene expression of stem-like cells in diseased tissues with normal stem cells |
| Entrez ID | Symbol | Replicates | Species | Organ | Tissue | Adj P-value | Log2FC | Malignancy |
| 9939 | RBM8A | GSM4909281 | Human | Breast | IDC | 4.06e-02 | 3.05e-01 | 0.21 |
| 9939 | RBM8A | GSM4909282 | Human | Breast | IDC | 3.73e-09 | 4.36e-01 | -0.0288 |
| 9939 | RBM8A | GSM4909285 | Human | Breast | IDC | 1.03e-08 | 4.21e-01 | 0.21 |
| 9939 | RBM8A | GSM4909288 | Human | Breast | IDC | 1.47e-02 | 1.58e-01 | 0.0988 |
| 9939 | RBM8A | GSM4909293 | Human | Breast | IDC | 2.97e-06 | 3.48e-01 | 0.1581 |
| 9939 | RBM8A | GSM4909294 | Human | Breast | IDC | 1.07e-03 | -8.99e-02 | 0.2022 |
| 9939 | RBM8A | GSM4909296 | Human | Breast | IDC | 7.15e-09 | 1.18e-01 | 0.1524 |
| 9939 | RBM8A | GSM4909297 | Human | Breast | IDC | 2.32e-14 | -2.25e-01 | 0.1517 |
| 9939 | RBM8A | GSM4909311 | Human | Breast | IDC | 7.13e-35 | -1.92e-01 | 0.1534 |
| 9939 | RBM8A | GSM4909312 | Human | Breast | IDC | 4.89e-10 | -8.84e-02 | 0.1552 |
| 9939 | RBM8A | GSM4909313 | Human | Breast | IDC | 1.87e-03 | -1.06e-01 | 0.0391 |
| 9939 | RBM8A | GSM4909316 | Human | Breast | IDC | 1.61e-08 | 3.86e-01 | 0.21 |
| 9939 | RBM8A | GSM4909318 | Human | Breast | IDC | 4.14e-05 | 3.35e-01 | 0.2031 |
| 9939 | RBM8A | GSM4909319 | Human | Breast | IDC | 1.64e-44 | -4.51e-01 | 0.1563 |
| 9939 | RBM8A | GSM4909320 | Human | Breast | IDC | 3.50e-07 | -3.77e-03 | 0.1575 |
| 9939 | RBM8A | GSM4909321 | Human | Breast | IDC | 5.98e-12 | -1.36e-01 | 0.1559 |
| 9939 | RBM8A | brca1 | Human | Breast | Precancer | 9.07e-20 | 5.22e-01 | -0.0338 |
| 9939 | RBM8A | brca2 | Human | Breast | Precancer | 2.64e-03 | 2.70e-01 | -0.024 |
| 9939 | RBM8A | brca3 | Human | Breast | Precancer | 2.19e-07 | 3.52e-01 | -0.0263 |
| 9939 | RBM8A | M2 | Human | Breast | IDC | 5.64e-13 | 5.12e-01 | 0.21 |
| Page: 1 2 3 4 5 6 7 8 9 10 11 12 13 |
| Tissue | Expression Dynamics | Abbreviation |
| Breast | 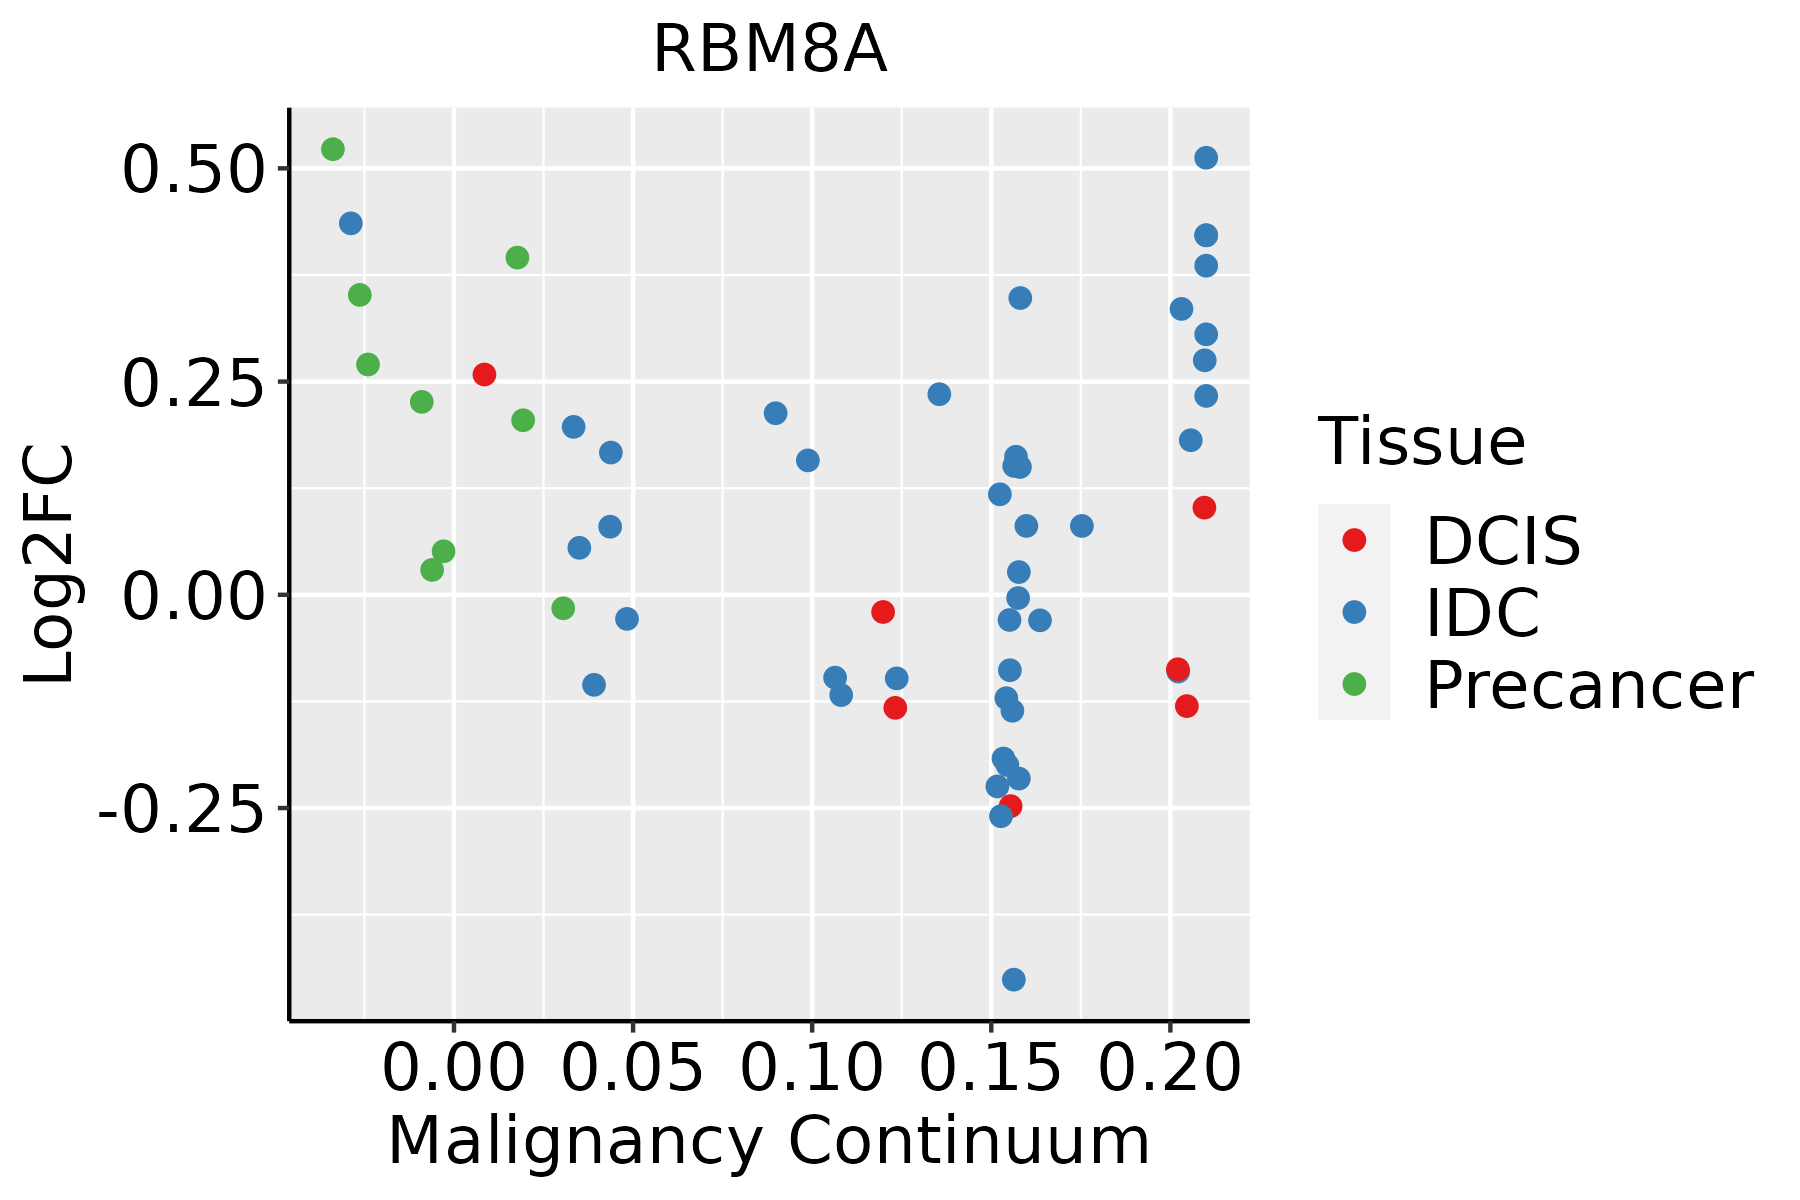 | IDC: Invasive ductal carcinoma |
| DCIS: Ductal carcinoma in situ | ||
| Precancer(BRCA1-mut): Precancerous lesion from BRCA1 mutation carriers | ||
| Cervix | 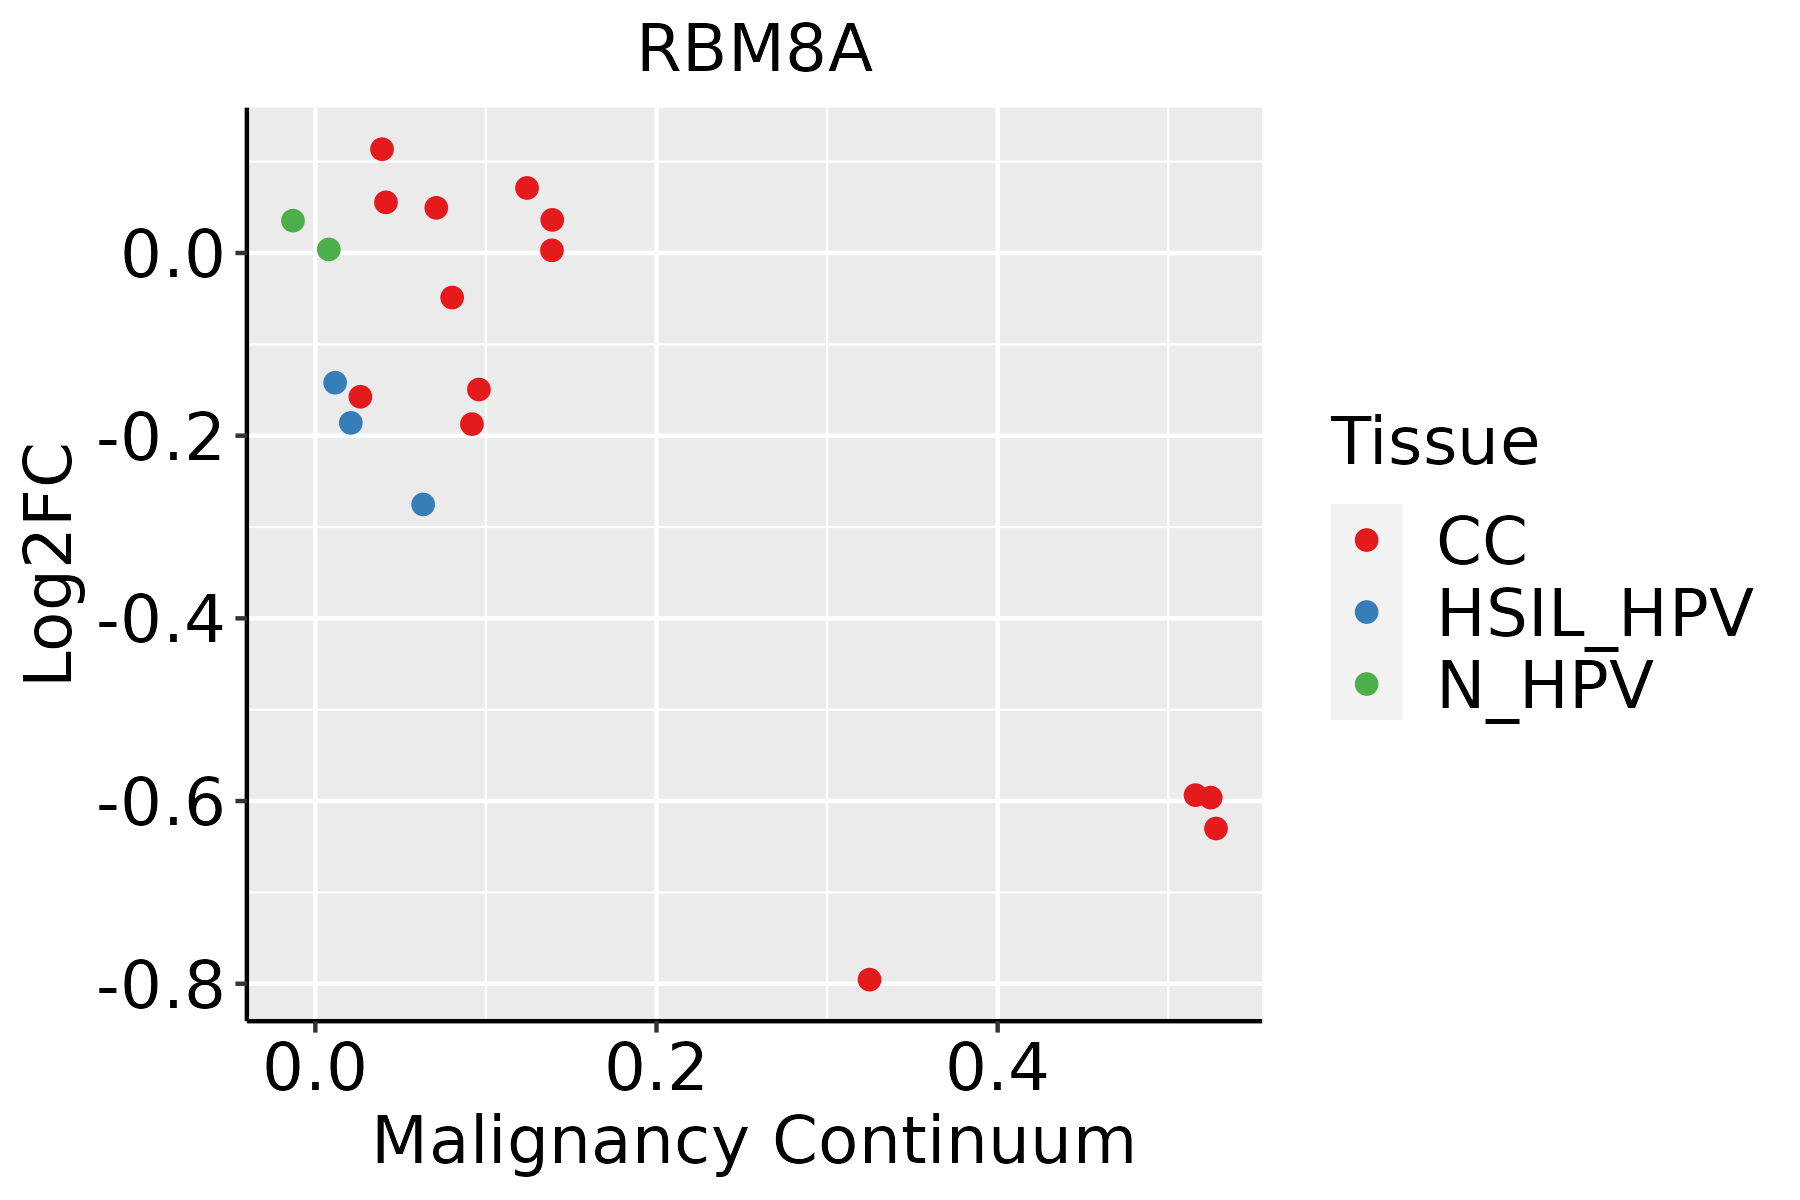 | CC: Cervix cancer |
| HSIL_HPV: HPV-infected high-grade squamous intraepithelial lesions | ||
| N_HPV: HPV-infected normal cervix | ||
| Colorectum (GSE201348) |  | FAP: Familial adenomatous polyposis |
| CRC: Colorectal cancer | ||
| Colorectum (HTA11) |  | AD: Adenomas |
| SER: Sessile serrated lesions | ||
| MSI-H: Microsatellite-high colorectal cancer | ||
| MSS: Microsatellite stable colorectal cancer | ||
| Endometrium | 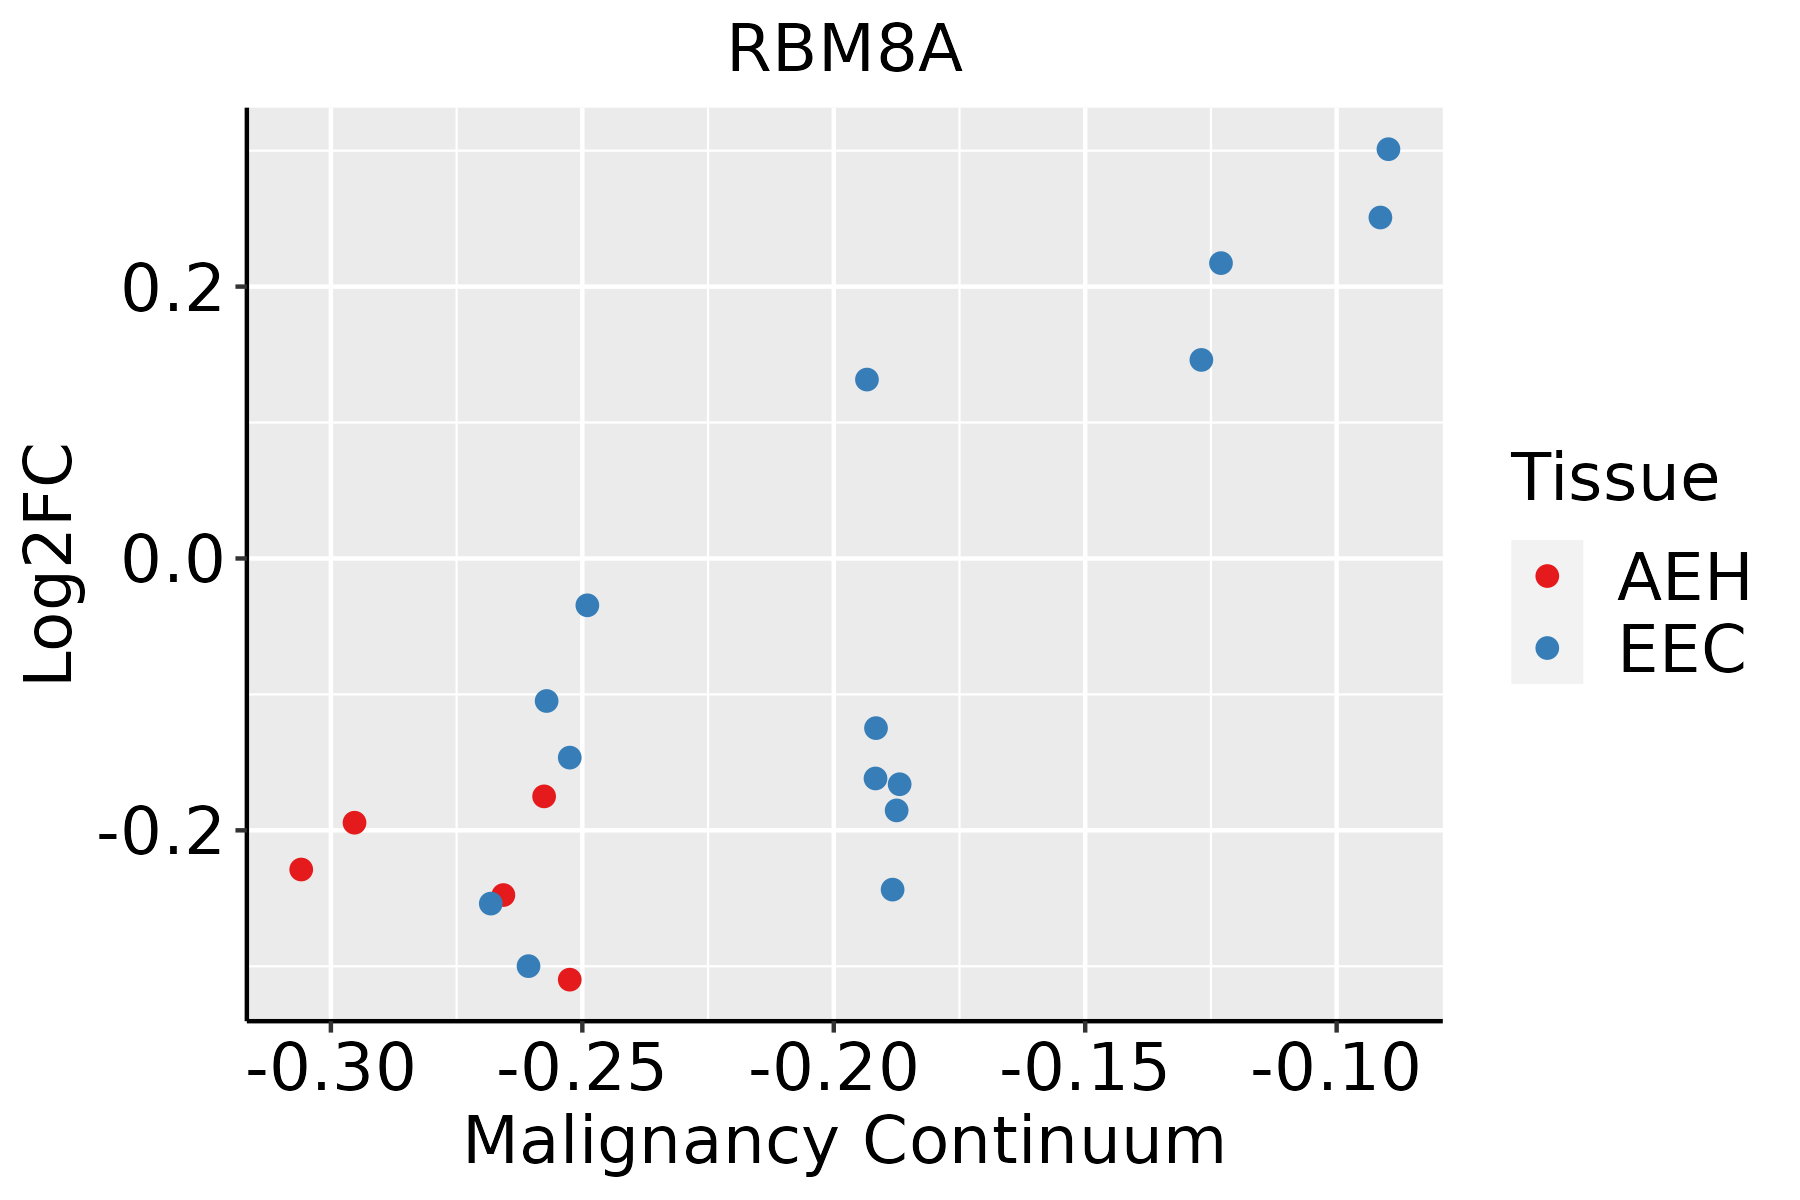 | AEH: Atypical endometrial hyperplasia |
| EEC: Endometrioid Cancer | ||
| Esophagus | 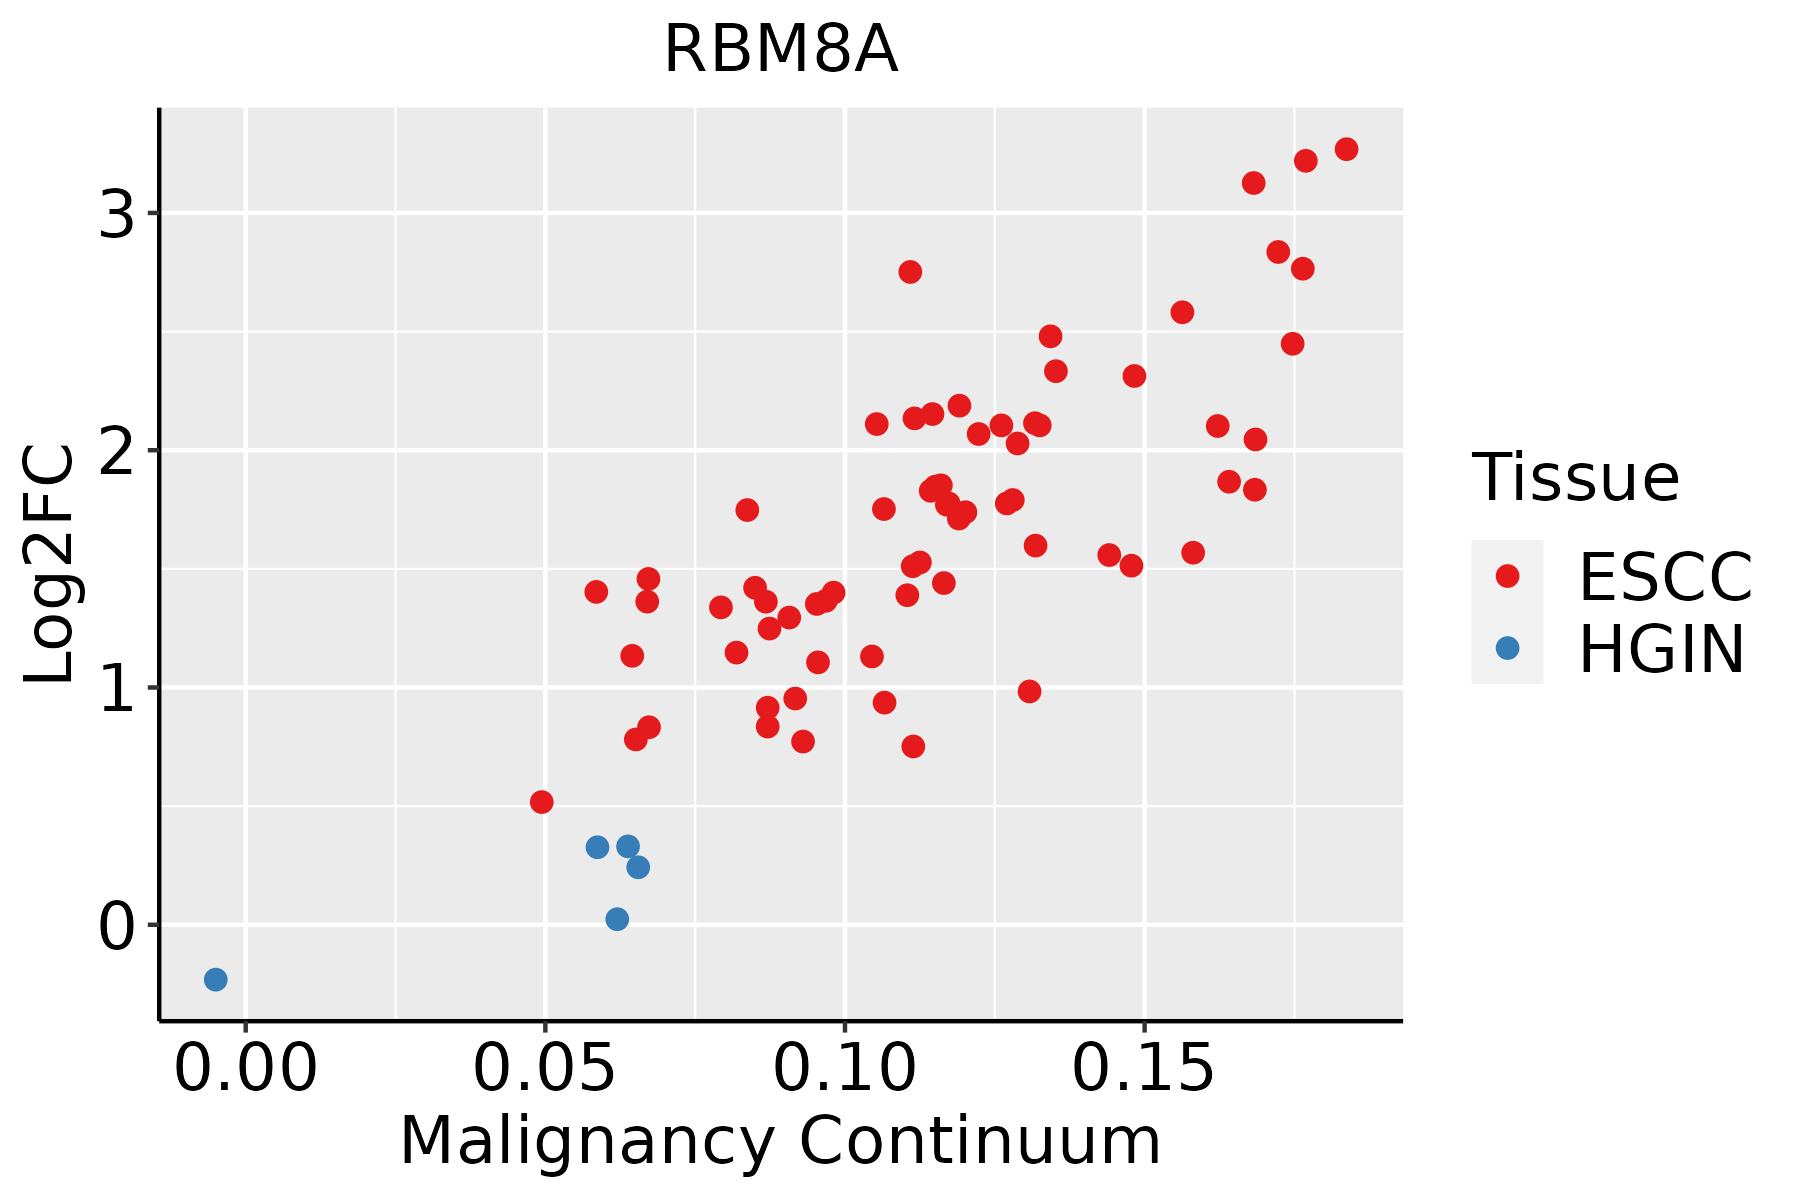 | ESCC: Esophageal squamous cell carcinoma |
| HGIN: High-grade intraepithelial neoplasias | ||
| LGIN: Low-grade intraepithelial neoplasias | ||
| Liver | 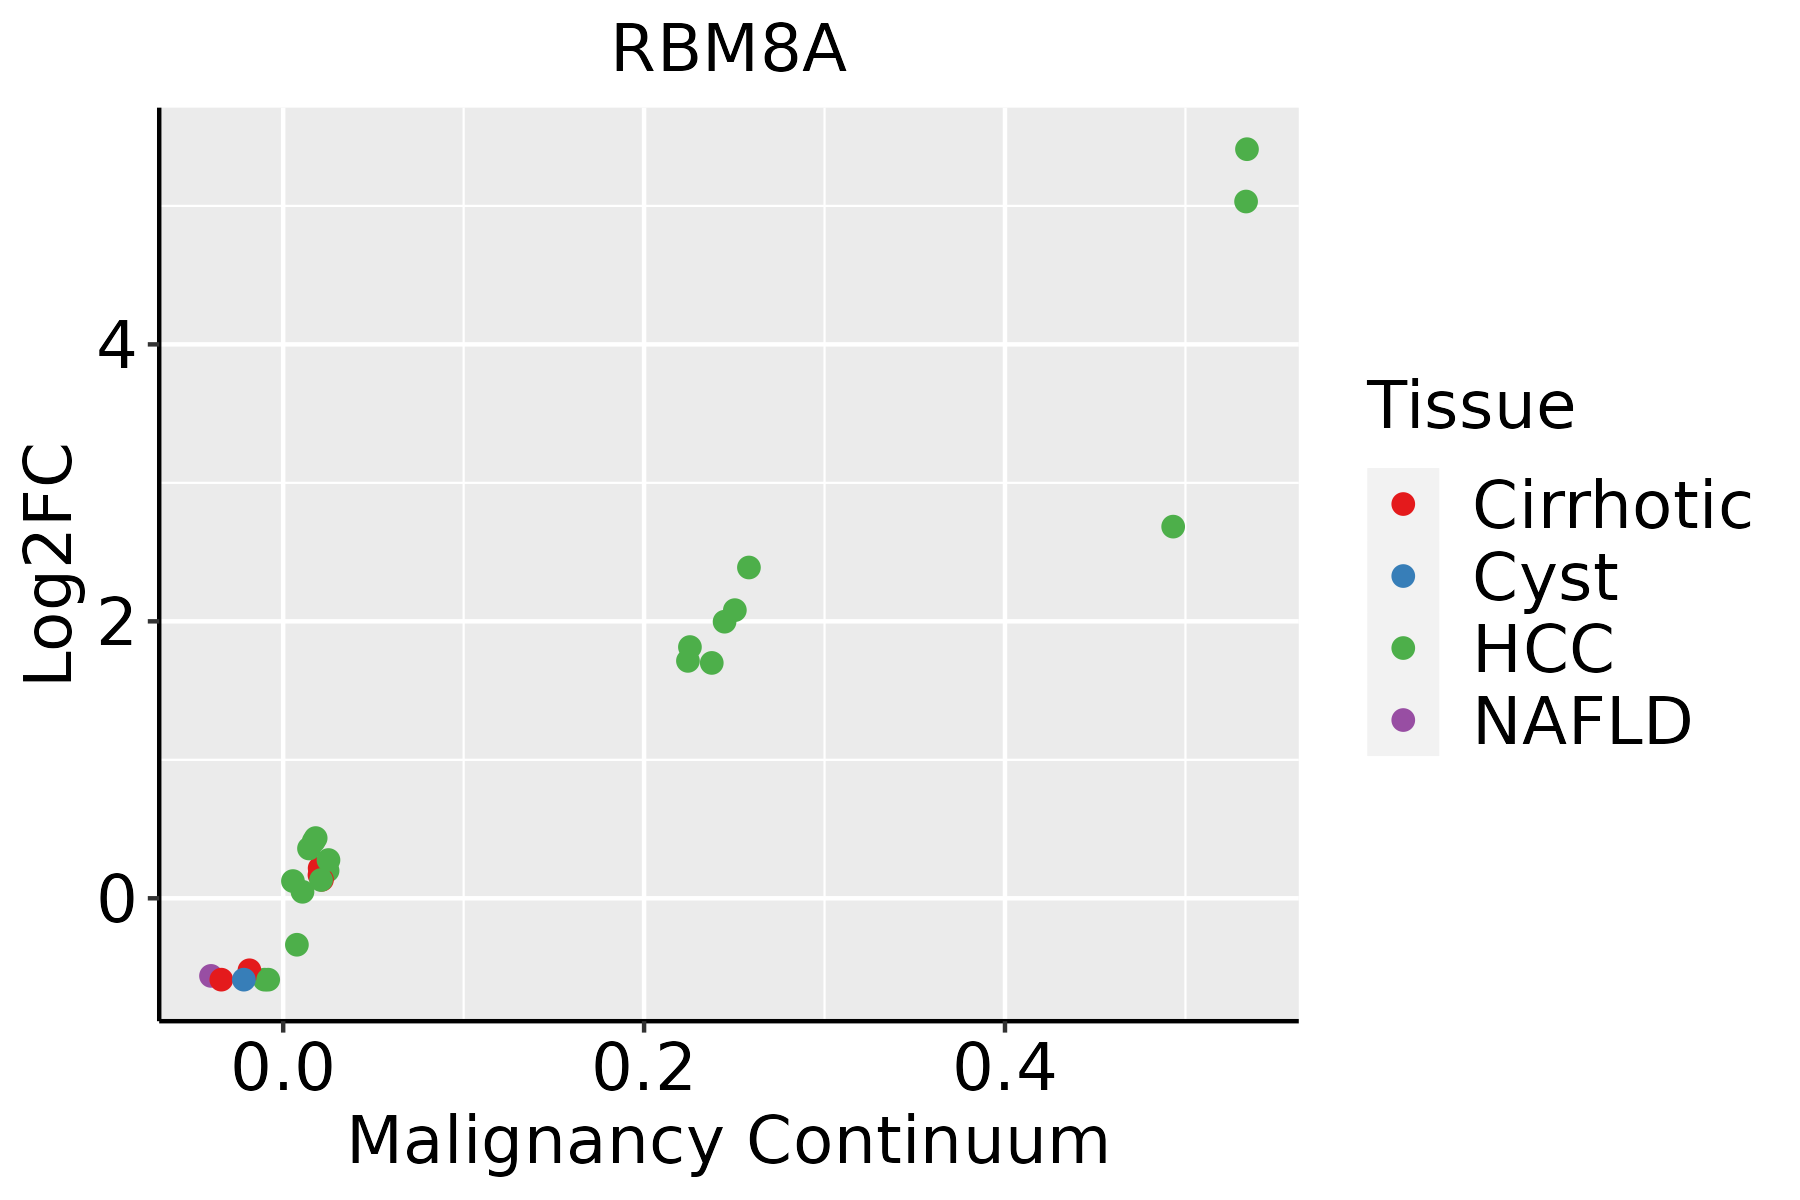 | HCC: Hepatocellular carcinoma |
| NAFLD: Non-alcoholic fatty liver disease | ||
| Oral Cavity | 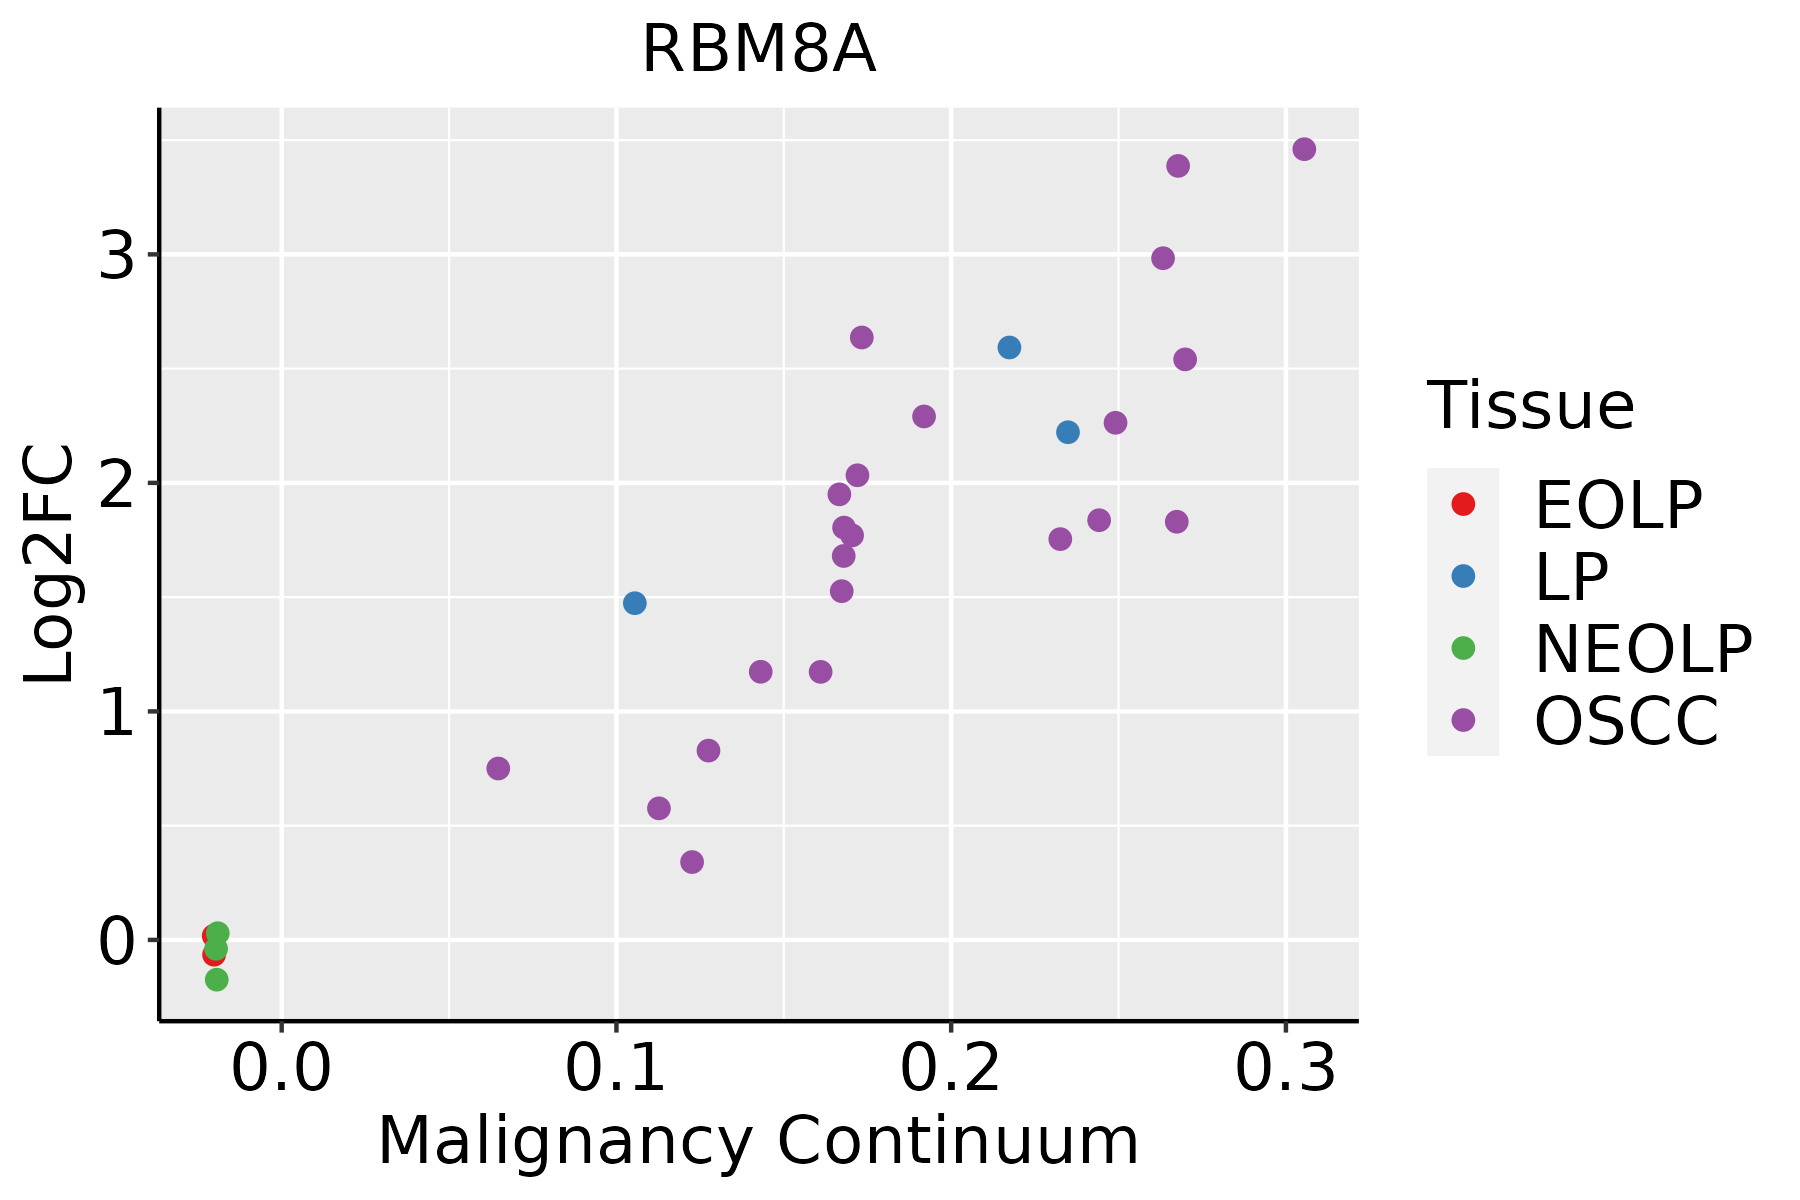 | EOLP: Erosive Oral lichen planus |
| LP: leukoplakia | ||
| NEOLP: Non-erosive oral lichen planus | ||
| OSCC: Oral squamous cell carcinoma | ||
| Prostate | 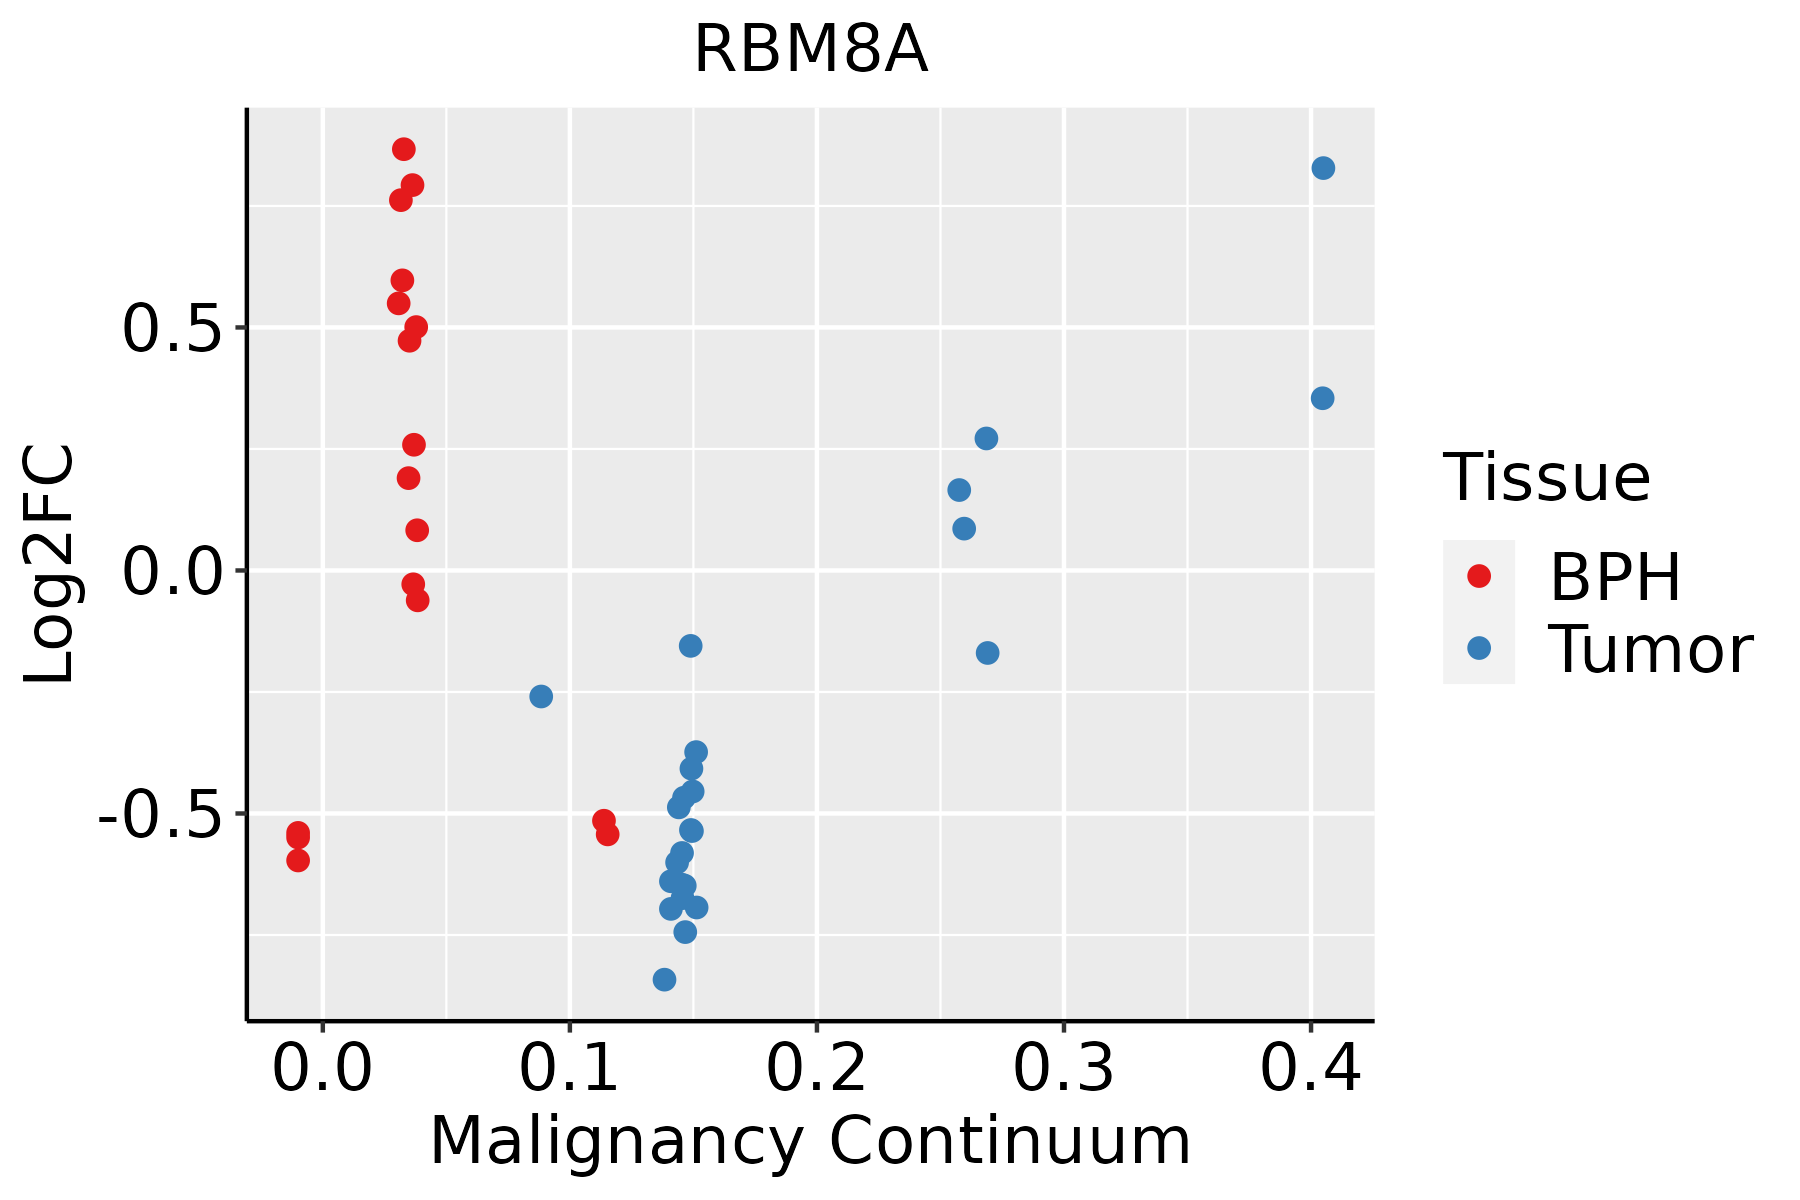 | BPH: Benign Prostatic Hyperplasia |
| Skin | 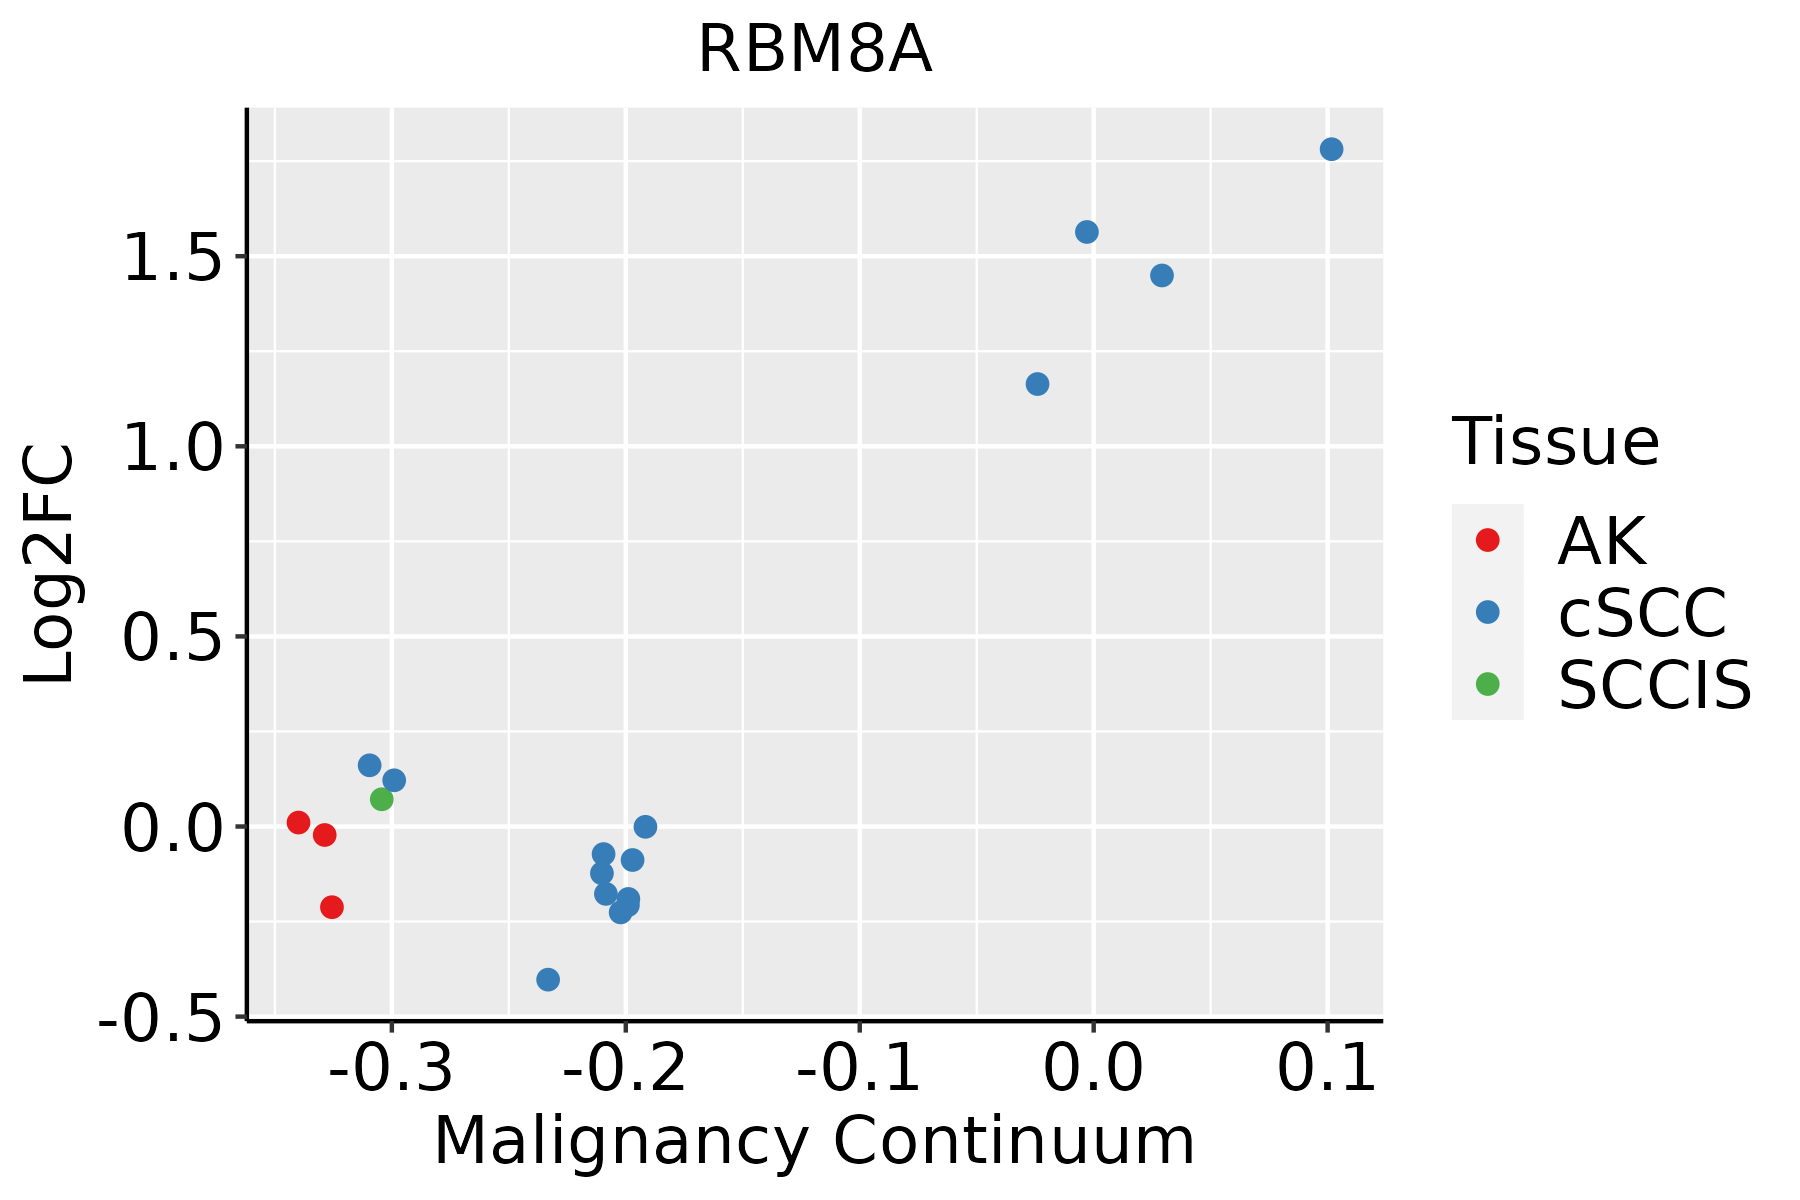 | AK: Actinic keratosis |
| cSCC: Cutaneous squamous cell carcinoma | ||
| SCCIS:squamous cell carcinoma in situ | ||
| Thyroid | 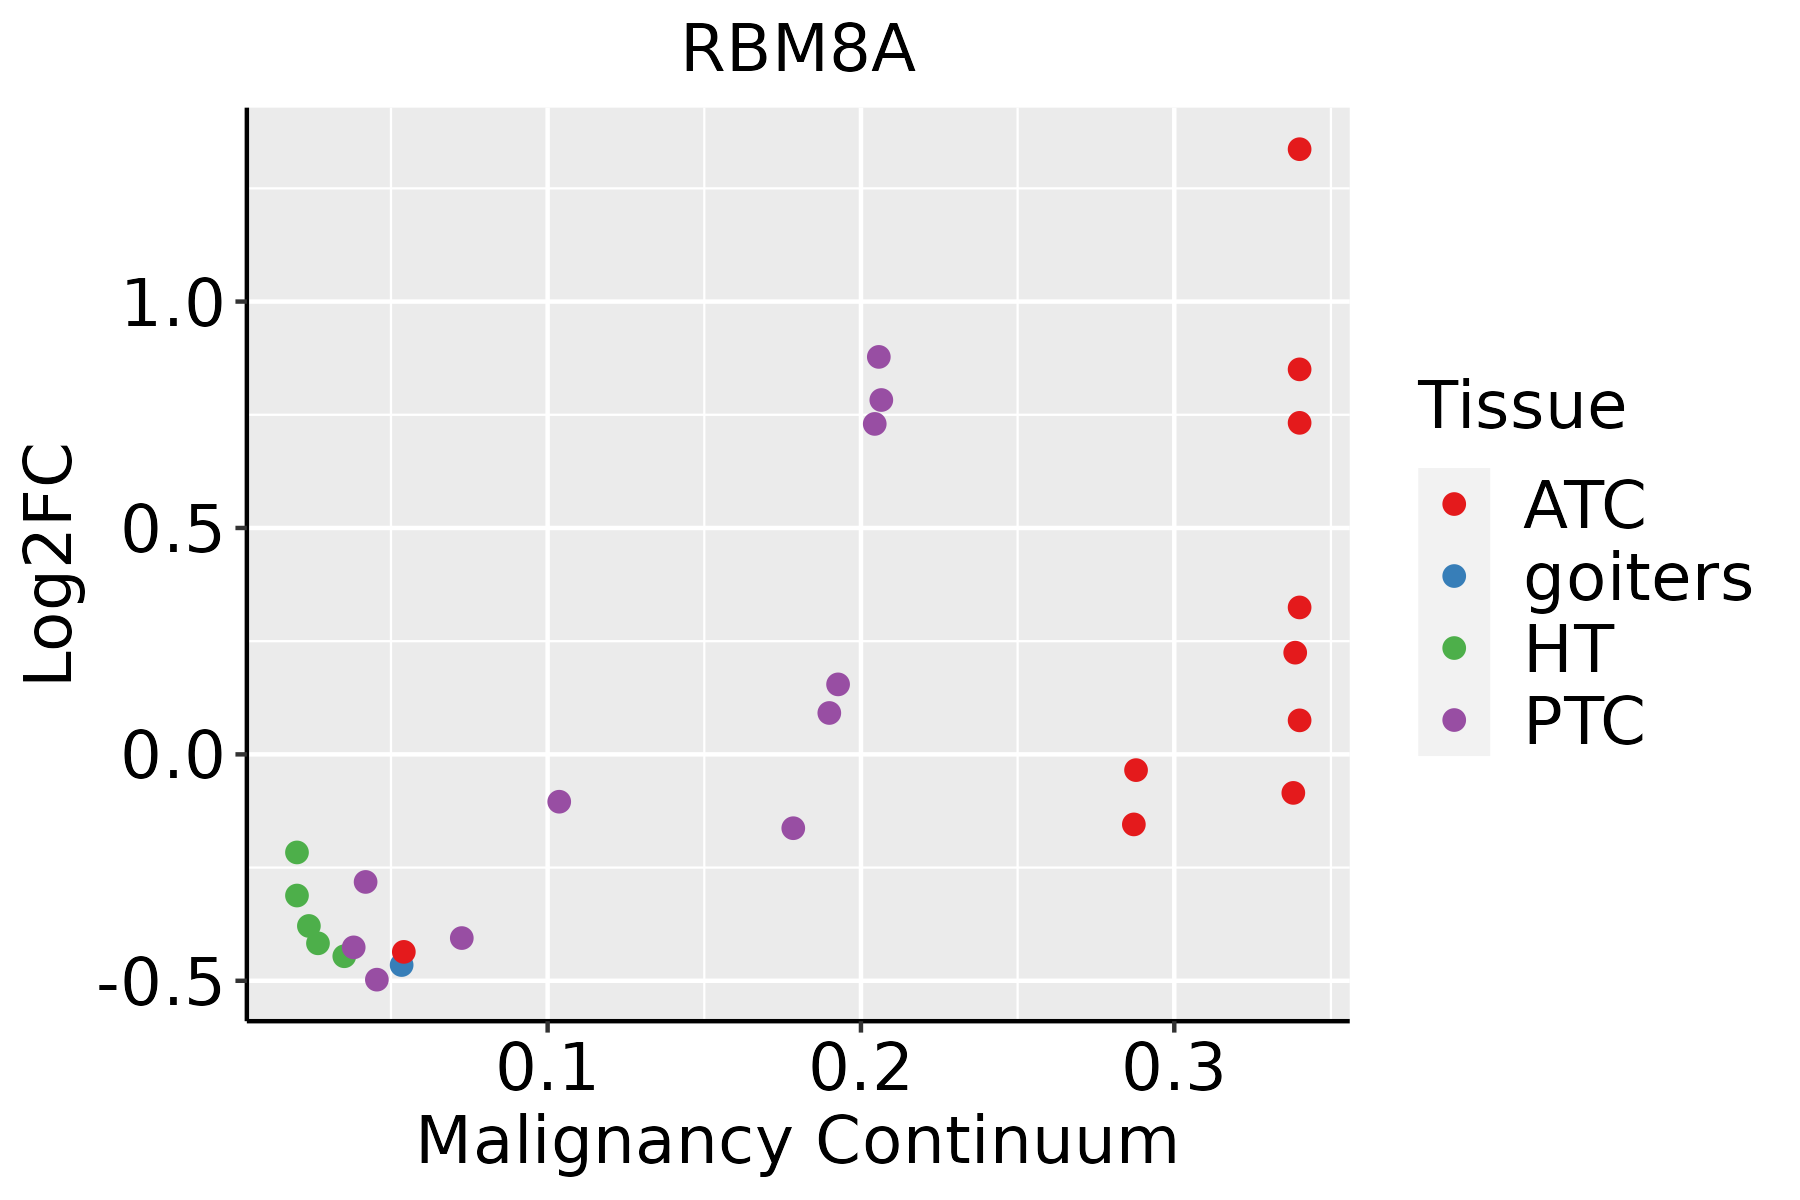 | ATC: Anaplastic thyroid cancer |
| HT: Hashimoto's thyroiditis | ||
| PTC: Papillary thyroid cancer |
| ∗log2FC in expression of this searched gene in stem-like cells from each diseased tissue sample relative to stem-like cells in normal samples in each tissue plotted against the malignancy continuum. Samples are colored based on if they are from different disease stage. |
Top |
Malignant transformation related pathway analysis |
| Find out the enriched GO biological processes and KEGG pathways involved in transition from healthy to precancer to cancer |
| Tissue | Disease Stage | Enriched GO biological Processes |
| Colorectum | AD |  |
| Colorectum | SER |  |
| Colorectum | MSS |  |
| Colorectum | MSI-H |  |
| Colorectum | FAP |  |
| ∗Top 15 enriched GO BP terms are showed in the bar plot of each disease state in each tissue. Each row represents a significant GO biological process which is colored according to the -log10(p.adjust). |
| Page: 1 2 3 4 5 6 7 8 9 |
| GO ID | Tissue | Disease Stage | Description | Gene Ratio | Bg Ratio | pvalue | p.adjust | Count |
| GO:00003981 | Colorectum | SER | mRNA splicing, via spliceosome | 89/2897 | 320/18723 | 9.82e-09 | 8.14e-07 | 89 |
| GO:00434841 | Colorectum | SER | regulation of RNA splicing | 49/2897 | 148/18723 | 7.02e-08 | 4.49e-06 | 49 |
| GO:19033111 | Colorectum | SER | regulation of mRNA metabolic process | 78/2897 | 288/18723 | 2.61e-07 | 1.43e-05 | 78 |
| GO:00480241 | Colorectum | SER | regulation of mRNA splicing, via spliceosome | 35/2897 | 101/18723 | 1.52e-06 | 6.85e-05 | 35 |
| GO:00506841 | Colorectum | SER | regulation of mRNA processing | 42/2897 | 137/18723 | 5.57e-06 | 2.01e-04 | 42 |
| GO:00064031 | Colorectum | SER | RNA localization | 53/2897 | 201/18723 | 4.51e-05 | 1.13e-03 | 53 |
| GO:00442701 | Colorectum | SER | cellular nitrogen compound catabolic process | 99/2897 | 451/18723 | 1.46e-04 | 2.86e-03 | 99 |
| GO:00467001 | Colorectum | SER | heterocycle catabolic process | 97/2897 | 445/18723 | 2.20e-04 | 3.89e-03 | 97 |
| GO:00159311 | Colorectum | SER | nucleobase-containing compound transport | 54/2897 | 222/18723 | 3.65e-04 | 5.67e-03 | 54 |
| GO:00064171 | Colorectum | SER | regulation of translation | 100/2897 | 468/18723 | 3.76e-04 | 5.74e-03 | 100 |
| GO:00003801 | Colorectum | SER | alternative mRNA splicing, via spliceosome | 24/2897 | 77/18723 | 4.08e-04 | 6.09e-03 | 24 |
| GO:00003811 | Colorectum | SER | regulation of alternative mRNA splicing, via spliceosome | 20/2897 | 60/18723 | 4.60e-04 | 6.65e-03 | 20 |
| GO:19013611 | Colorectum | SER | organic cyclic compound catabolic process | 104/2897 | 495/18723 | 5.46e-04 | 7.63e-03 | 104 |
| GO:00346551 | Colorectum | SER | nucleobase-containing compound catabolic process | 88/2897 | 407/18723 | 5.53e-04 | 7.71e-03 | 88 |
| GO:00512361 | Colorectum | SER | establishment of RNA localization | 42/2897 | 166/18723 | 6.70e-04 | 8.96e-03 | 42 |
| GO:00194391 | Colorectum | SER | aromatic compound catabolic process | 98/2897 | 467/18723 | 8.09e-04 | 1.01e-02 | 98 |
| GO:00506571 | Colorectum | SER | nucleic acid transport | 41/2897 | 163/18723 | 8.74e-04 | 1.06e-02 | 41 |
| GO:00506581 | Colorectum | SER | RNA transport | 41/2897 | 163/18723 | 8.74e-04 | 1.06e-02 | 41 |
| GO:00064021 | Colorectum | SER | mRNA catabolic process | 54/2897 | 232/18723 | 1.11e-03 | 1.28e-02 | 54 |
| GO:00064011 | Colorectum | SER | RNA catabolic process | 62/2897 | 278/18723 | 1.56e-03 | 1.67e-02 | 62 |
| Page: 1 2 3 4 5 6 7 8 9 10 11 12 13 14 15 16 17 18 19 20 21 22 23 24 25 26 27 28 29 30 |
| Pathway ID | Tissue | Disease Stage | Description | Gene Ratio | Bg Ratio | pvalue | p.adjust | qvalue | Count |
| hsa030408 | Breast | Precancer | Spliceosome | 39/684 | 217/8465 | 1.44e-06 | 2.27e-05 | 1.74e-05 | 39 |
| hsa0304013 | Breast | Precancer | Spliceosome | 39/684 | 217/8465 | 1.44e-06 | 2.27e-05 | 1.74e-05 | 39 |
| hsa0304023 | Breast | IDC | Spliceosome | 40/867 | 217/8465 | 1.53e-04 | 1.42e-03 | 1.06e-03 | 40 |
| hsa0304033 | Breast | IDC | Spliceosome | 40/867 | 217/8465 | 1.53e-04 | 1.42e-03 | 1.06e-03 | 40 |
| hsa0304043 | Breast | DCIS | Spliceosome | 40/846 | 217/8465 | 8.97e-05 | 8.52e-04 | 6.28e-04 | 40 |
| hsa0304053 | Breast | DCIS | Spliceosome | 40/846 | 217/8465 | 8.97e-05 | 8.52e-04 | 6.28e-04 | 40 |
| hsa03040 | Colorectum | AD | Spliceosome | 73/2092 | 217/8465 | 1.73e-03 | 9.68e-03 | 6.18e-03 | 73 |
| hsa03015 | Colorectum | AD | mRNA surveillance pathway | 35/2092 | 97/8465 | 7.95e-03 | 3.13e-02 | 2.00e-02 | 35 |
| hsa030401 | Colorectum | AD | Spliceosome | 73/2092 | 217/8465 | 1.73e-03 | 9.68e-03 | 6.18e-03 | 73 |
| hsa030151 | Colorectum | AD | mRNA surveillance pathway | 35/2092 | 97/8465 | 7.95e-03 | 3.13e-02 | 2.00e-02 | 35 |
| hsa030402 | Colorectum | MSS | Spliceosome | 66/1875 | 217/8465 | 2.58e-03 | 1.27e-02 | 7.81e-03 | 66 |
| hsa030403 | Colorectum | MSS | Spliceosome | 66/1875 | 217/8465 | 2.58e-03 | 1.27e-02 | 7.81e-03 | 66 |
| hsa030404 | Colorectum | MSI-H | Spliceosome | 37/797 | 217/8465 | 2.49e-04 | 3.23e-03 | 2.70e-03 | 37 |
| hsa030405 | Colorectum | MSI-H | Spliceosome | 37/797 | 217/8465 | 2.49e-04 | 3.23e-03 | 2.70e-03 | 37 |
| hsa030409 | Endometrium | AEH | Spliceosome | 54/1197 | 217/8465 | 1.47e-05 | 1.65e-04 | 1.21e-04 | 54 |
| hsa0304014 | Endometrium | AEH | Spliceosome | 54/1197 | 217/8465 | 1.47e-05 | 1.65e-04 | 1.21e-04 | 54 |
| hsa0304024 | Endometrium | EEC | Spliceosome | 54/1237 | 217/8465 | 3.78e-05 | 3.88e-04 | 2.89e-04 | 54 |
| hsa0304034 | Endometrium | EEC | Spliceosome | 54/1237 | 217/8465 | 3.78e-05 | 3.88e-04 | 2.89e-04 | 54 |
| hsa0304018 | Esophagus | HGIN | Spliceosome | 79/1383 | 217/8465 | 3.22e-13 | 7.00e-12 | 5.56e-12 | 79 |
| hsa030159 | Esophagus | HGIN | mRNA surveillance pathway | 30/1383 | 97/8465 | 2.48e-04 | 2.69e-03 | 2.14e-03 | 30 |
| Page: 1 2 3 |
Top |
Cell-cell communication analysis |
| Identification of potential cell-cell interactions between two cell types and their ligand-receptor pairs for different disease states |
| Ligand | Receptor | LRpair | Pathway | Tissue | Disease Stage |
| Page: 1 |
Top |
Single-cell gene regulatory network inference analysis |
| Find out the significant the regulons (TFs) and the target genes of each regulon across cell types for different disease states |
| TF | Cell Type | Tissue | Disease Stage | Target Gene | RSS | Regulon Activity |
| ∗The dot plots of a searched regulon are shown for all cell subpopulations in each disease state of each tissue based on the regulon specific score inferred using pySCENIC and by calculating the average expression. |
| Page: 1 |
Top |
Somatic mutation of malignant transformation related genes |
| Annotation of somatic variants for genes involved in malignant transformation |
| Hugo Symbol | Variant Class | Variant Classification | dbSNP RS | HGVSc | HGVSp | HGVSp Short | SWISSPROT | BIOTYPE | SIFT | PolyPhen | Tumor Sample Barcode | Tissue | Histology | Sex | Age | Stage | Therapy Types | Drugs | Outcome |
| RBM8A | SNV | Missense_Mutation | novel | c.488G>A | p.Arg163Gln | p.R163Q | Q9Y5S9 | protein_coding | tolerated(0.12) | possibly_damaging(0.885) | TCGA-AN-A046-01 | Breast | breast invasive carcinoma | Female | >=65 | I/II | Unknown | Unknown | SD |
| RBM8A | SNV | Missense_Mutation | c.16N>A | p.Asp6Asn | p.D6N | Q9Y5S9 | protein_coding | deleterious(0) | possibly_damaging(0.859) | TCGA-BH-A0HY-01 | Breast | breast invasive carcinoma | Female | <65 | I/II | Hormone Therapy | taxotere | CR | |
| RBM8A | SNV | Missense_Mutation | c.76N>T | p.His26Tyr | p.H26Y | Q9Y5S9 | protein_coding | deleterious(0.04) | benign(0.358) | TCGA-D8-A1JA-01 | Breast | breast invasive carcinoma | Female | <65 | III/IV | Chemotherapy | adriamycin | PD | |
| RBM8A | SNV | Missense_Mutation | c.194N>T | p.Gly65Val | p.G65V | Q9Y5S9 | protein_coding | deleterious(0) | benign(0.206) | TCGA-E2-A152-01 | Breast | breast invasive carcinoma | Female | <65 | I/II | Targeted Molecular therapy | trastuzumab | PD | |
| RBM8A | SNV | Missense_Mutation | c.467A>C | p.Lys156Thr | p.K156T | Q9Y5S9 | protein_coding | tolerated(0.16) | benign(0.227) | TCGA-AA-3977-01 | Colorectum | colon adenocarcinoma | Male | >=65 | I/II | Unknown | Unknown | SD | |
| RBM8A | SNV | Missense_Mutation | c.444G>C | p.Trp148Cys | p.W148C | Q9Y5S9 | protein_coding | deleterious(0) | probably_damaging(0.995) | TCGA-EF-5830-01 | Colorectum | rectum adenocarcinoma | Male | <65 | I/II | Unknown | Unknown | SD | |
| RBM8A | SNV | Missense_Mutation | c.454N>T | p.Arg152Trp | p.R152W | Q9Y5S9 | protein_coding | tolerated(0.09) | benign(0) | TCGA-A5-A0GP-01 | Endometrium | uterine corpus endometrioid carcinoma | Female | <65 | I/II | Unknown | Unknown | SD | |
| RBM8A | SNV | Missense_Mutation | c.454N>T | p.Arg152Trp | p.R152W | Q9Y5S9 | protein_coding | tolerated(0.09) | benign(0) | TCGA-A5-A2K5-01 | Endometrium | uterine corpus endometrioid carcinoma | Female | >=65 | I/II | Unknown | Unknown | SD | |
| RBM8A | SNV | Missense_Mutation | novel | c.275N>C | p.Lys92Thr | p.K92T | Q9Y5S9 | protein_coding | tolerated(0.09) | benign(0.068) | TCGA-A5-A2K5-01 | Endometrium | uterine corpus endometrioid carcinoma | Female | >=65 | I/II | Unknown | Unknown | SD |
| RBM8A | SNV | Missense_Mutation | c.521N>A | p.Arg174His | p.R174H | Q9Y5S9 | protein_coding | deleterious_low_confidence(0.01) | benign(0) | TCGA-AX-A06F-01 | Endometrium | uterine corpus endometrioid carcinoma | Female | <65 | III/IV | Chemotherapy | carboplatin | SD |
| Page: 1 2 3 |
Top |
Related drugs of malignant transformation related genes |
| Identification of chemicals and drugs interact with genes involved in malignant transfromation |
| (DGIdb 4.0) |
| Entrez ID | Symbol | Category | Interaction Types | Drug Claim Name | Drug Name | PMIDs |
| Page: 1 |

Copyright 2023-Present -The University of Texas Health Science Center at Houston |