
|
|||||
|
 | |
| |
| |
| |
| |
| |
|
Gene: PRKG1 |
Gene summary for PRKG1 |
| Gene information | Species | Human | Gene symbol | PRKG1 | Gene ID | 5592 |
| Gene name | protein kinase cGMP-dependent 1 | |
| Gene Alias | AAT8 | |
| Cytomap | 10q11.23-q21.1 | |
| Gene Type | protein-coding | GO ID | GO:0001764 | UniProtAcc | Q13976 |
Top |
Malignant transformation analysis |
| Identification of the aberrant gene expression in precancerous and cancerous lesions by comparing the gene expression of stem-like cells in diseased tissues with normal stem cells |
| Entrez ID | Symbol | Replicates | Species | Organ | Tissue | Adj P-value | Log2FC | Malignancy |
| 5592 | PRKG1 | HTA11_3410_2000001011 | Human | Colorectum | AD | 8.77e-68 | -1.31e+00 | 0.0155 |
| 5592 | PRKG1 | HTA11_2487_2000001011 | Human | Colorectum | SER | 3.12e-07 | -6.66e-01 | -0.1808 |
| 5592 | PRKG1 | HTA11_2951_2000001011 | Human | Colorectum | AD | 5.54e-15 | -1.26e+00 | 0.0216 |
| 5592 | PRKG1 | HTA11_1938_2000001011 | Human | Colorectum | AD | 1.41e-18 | -1.05e+00 | -0.0811 |
| 5592 | PRKG1 | HTA11_78_2000001011 | Human | Colorectum | AD | 3.17e-02 | -5.57e-02 | -0.1088 |
| 5592 | PRKG1 | HTA11_3361_2000001011 | Human | Colorectum | AD | 4.62e-19 | -9.02e-01 | -0.1207 |
| 5592 | PRKG1 | HTA11_866_2000001011 | Human | Colorectum | AD | 6.76e-03 | -2.95e-01 | -0.1001 |
| 5592 | PRKG1 | HTA11_5212_2000001011 | Human | Colorectum | AD | 9.85e-05 | -6.46e-01 | -0.2061 |
| 5592 | PRKG1 | HTA11_5216_2000001011 | Human | Colorectum | SER | 2.71e-02 | -5.34e-01 | -0.1462 |
| 5592 | PRKG1 | HTA11_9341_2000001011 | Human | Colorectum | SER | 4.13e-09 | -1.16e+00 | -0.00410000000000005 |
| 5592 | PRKG1 | HTA11_7862_2000001011 | Human | Colorectum | AD | 2.13e-09 | -7.50e-01 | -0.0179 |
| 5592 | PRKG1 | HTA11_866_3004761011 | Human | Colorectum | AD | 4.07e-10 | -6.42e-01 | 0.096 |
| 5592 | PRKG1 | HTA11_4255_2000001011 | Human | Colorectum | SER | 1.45e-05 | -9.80e-01 | 0.0446 |
| 5592 | PRKG1 | HTA11_9408_2000001011 | Human | Colorectum | AD | 2.09e-05 | -9.76e-01 | 0.0451 |
| 5592 | PRKG1 | HTA11_8622_2000001021 | Human | Colorectum | SER | 6.64e-15 | -1.22e+00 | 0.0528 |
| 5592 | PRKG1 | HTA11_7663_2000001011 | Human | Colorectum | SER | 3.36e-05 | -6.96e-01 | 0.0131 |
| 5592 | PRKG1 | HTA11_10623_2000001011 | Human | Colorectum | AD | 1.15e-02 | -4.90e-01 | -0.0177 |
| 5592 | PRKG1 | HTA11_10711_2000001011 | Human | Colorectum | AD | 2.66e-29 | -1.18e+00 | 0.0338 |
| 5592 | PRKG1 | HTA11_7696_3000711011 | Human | Colorectum | AD | 4.41e-49 | -1.03e+00 | 0.0674 |
| 5592 | PRKG1 | HTA11_6818_2000001011 | Human | Colorectum | AD | 3.72e-07 | -8.08e-01 | 0.0112 |
| Page: 1 2 3 4 5 6 |
| Tissue | Expression Dynamics | Abbreviation |
| Colorectum (GSE201348) | 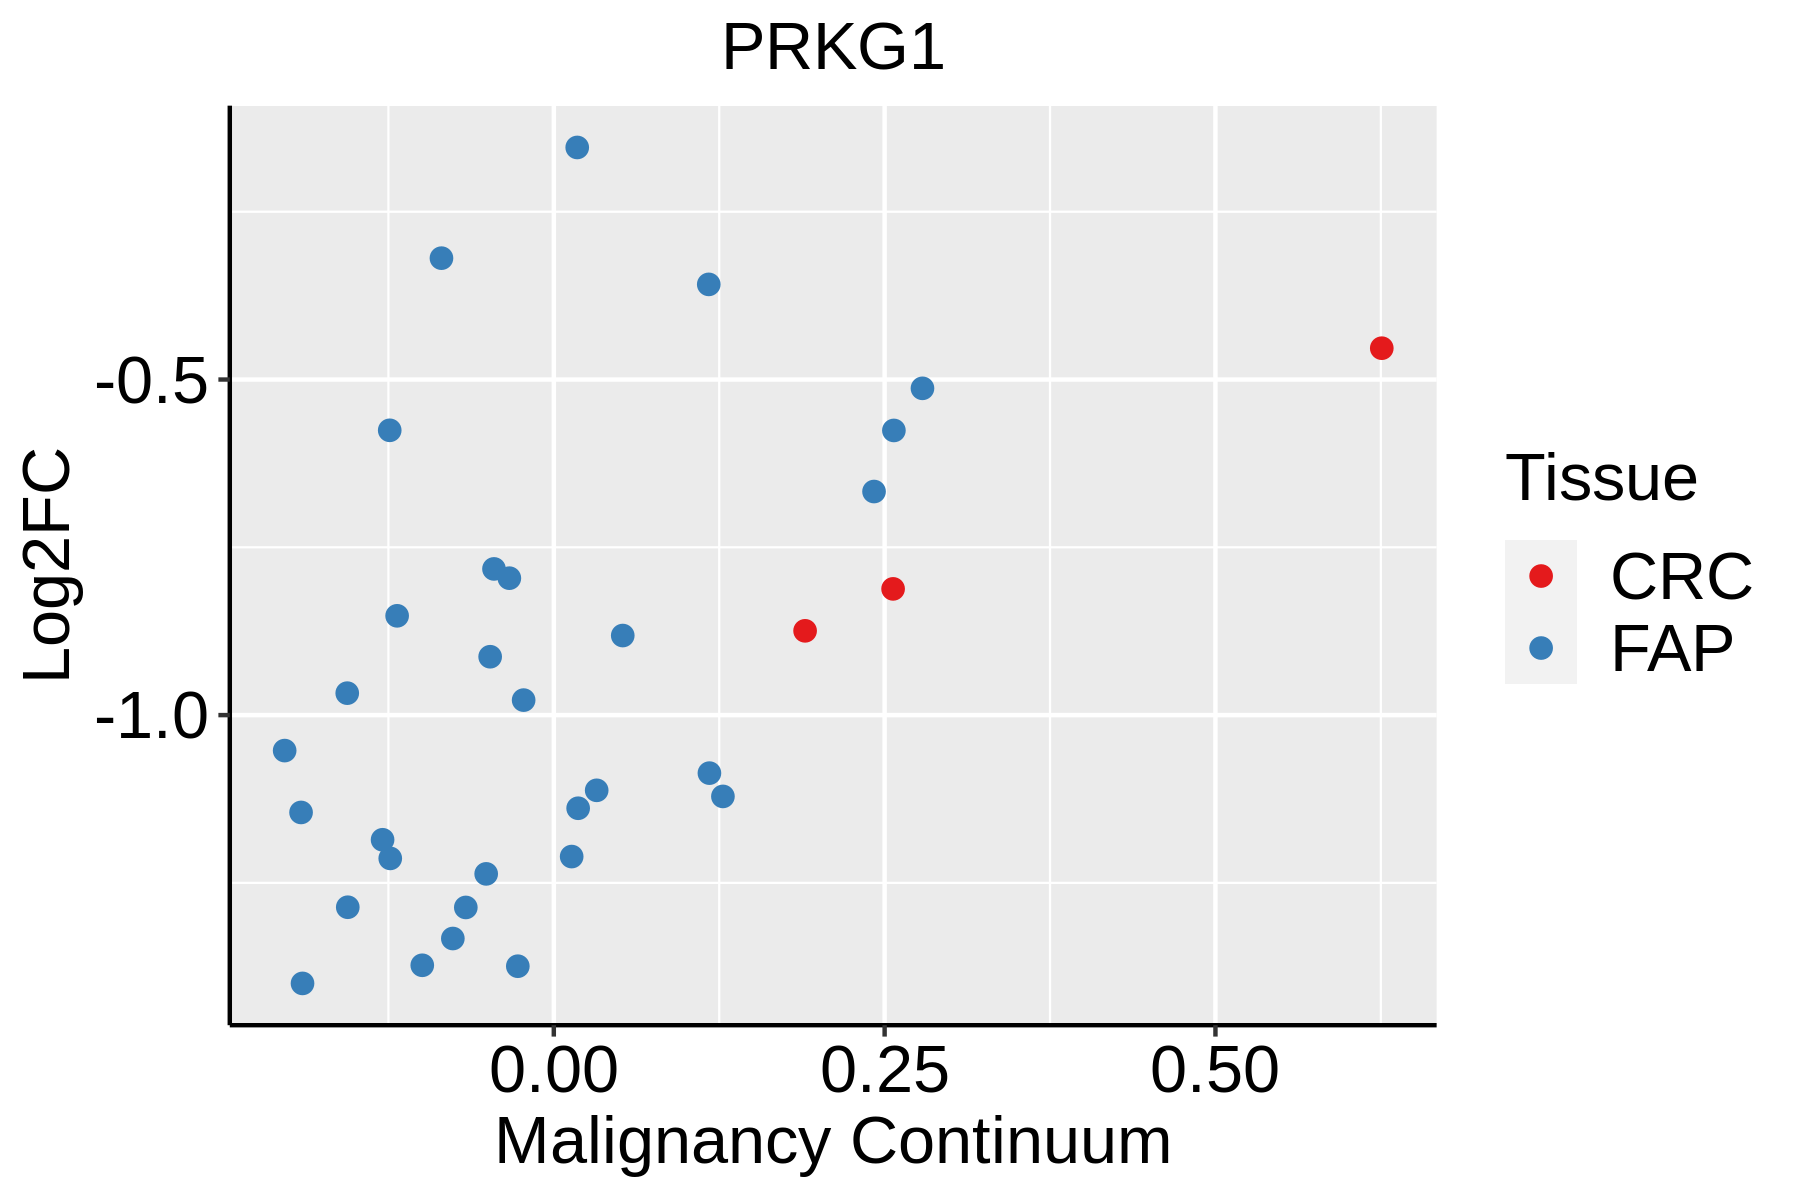 | FAP: Familial adenomatous polyposis |
| CRC: Colorectal cancer | ||
| Colorectum (HTA11) | 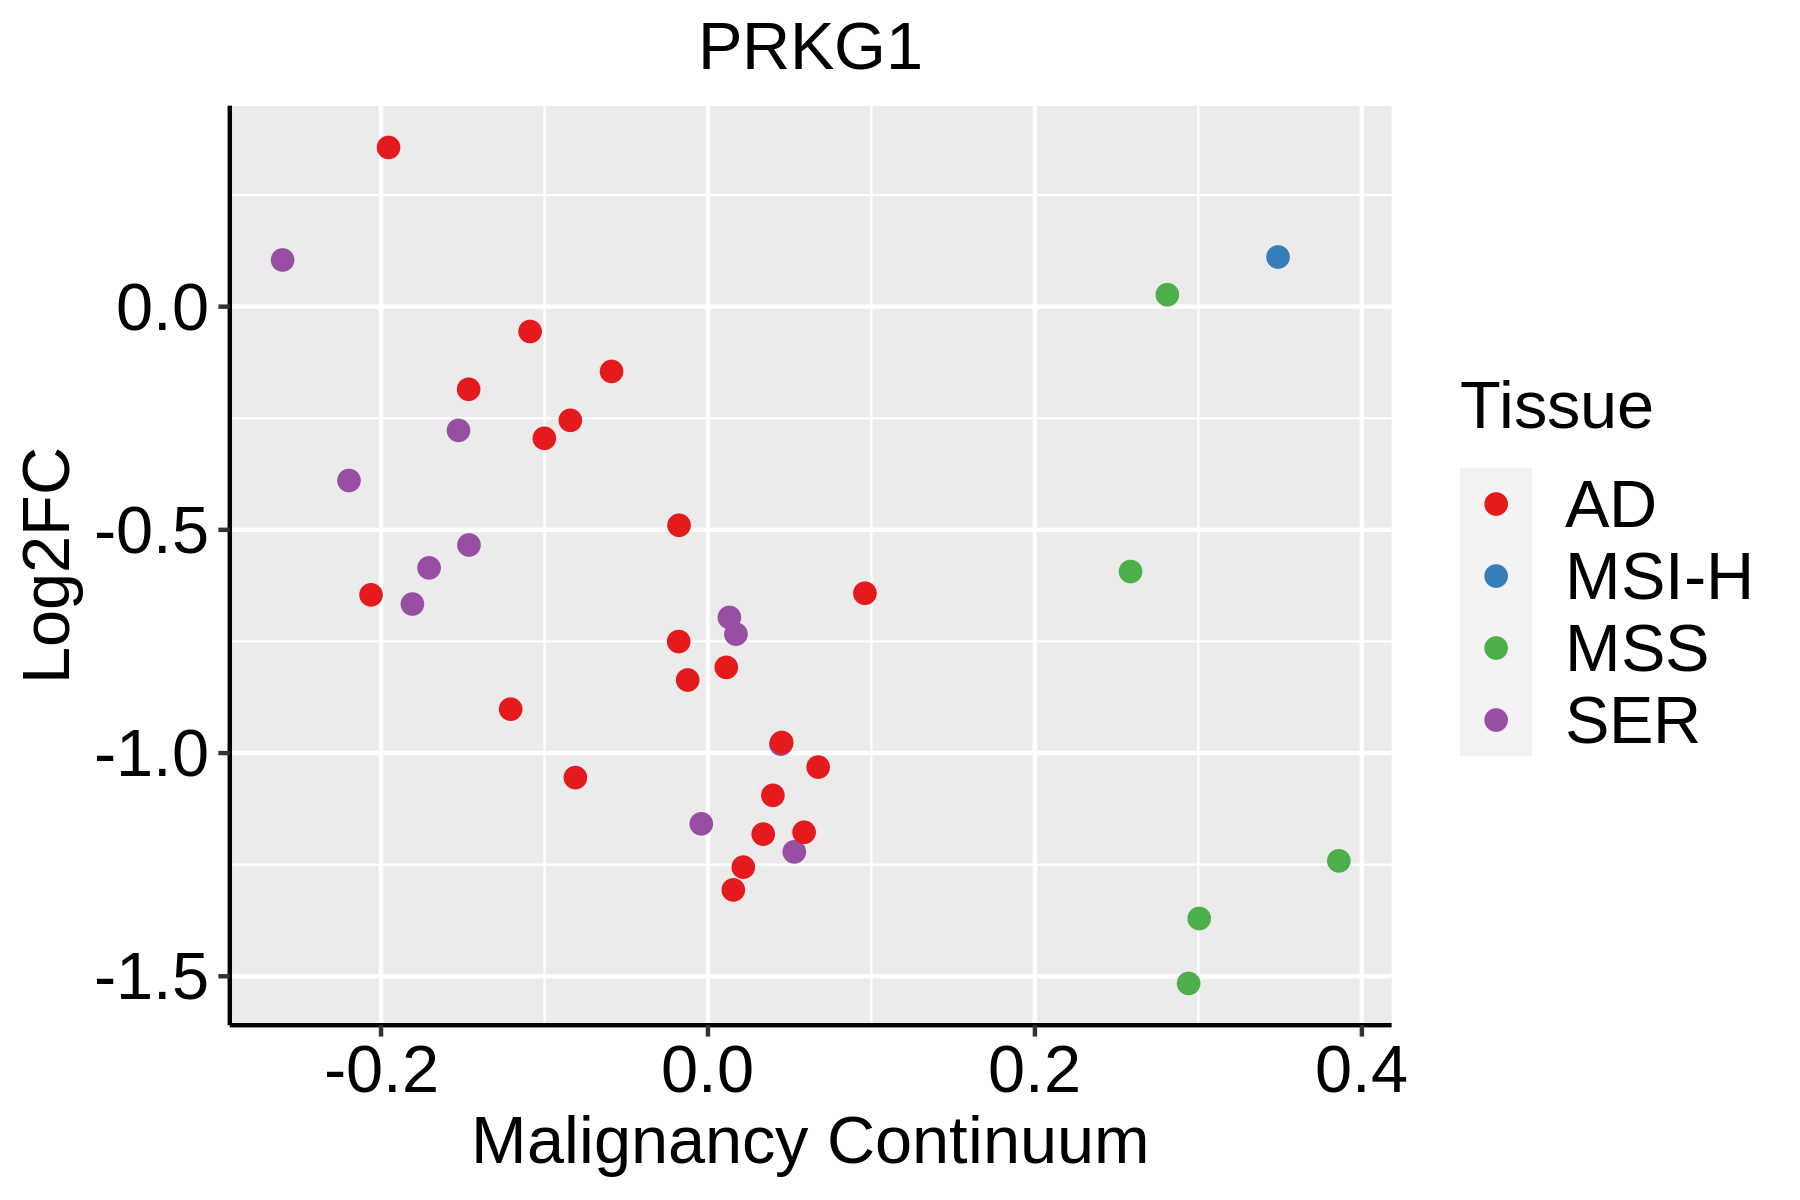 | AD: Adenomas |
| SER: Sessile serrated lesions | ||
| MSI-H: Microsatellite-high colorectal cancer | ||
| MSS: Microsatellite stable colorectal cancer | ||
| Endometrium | 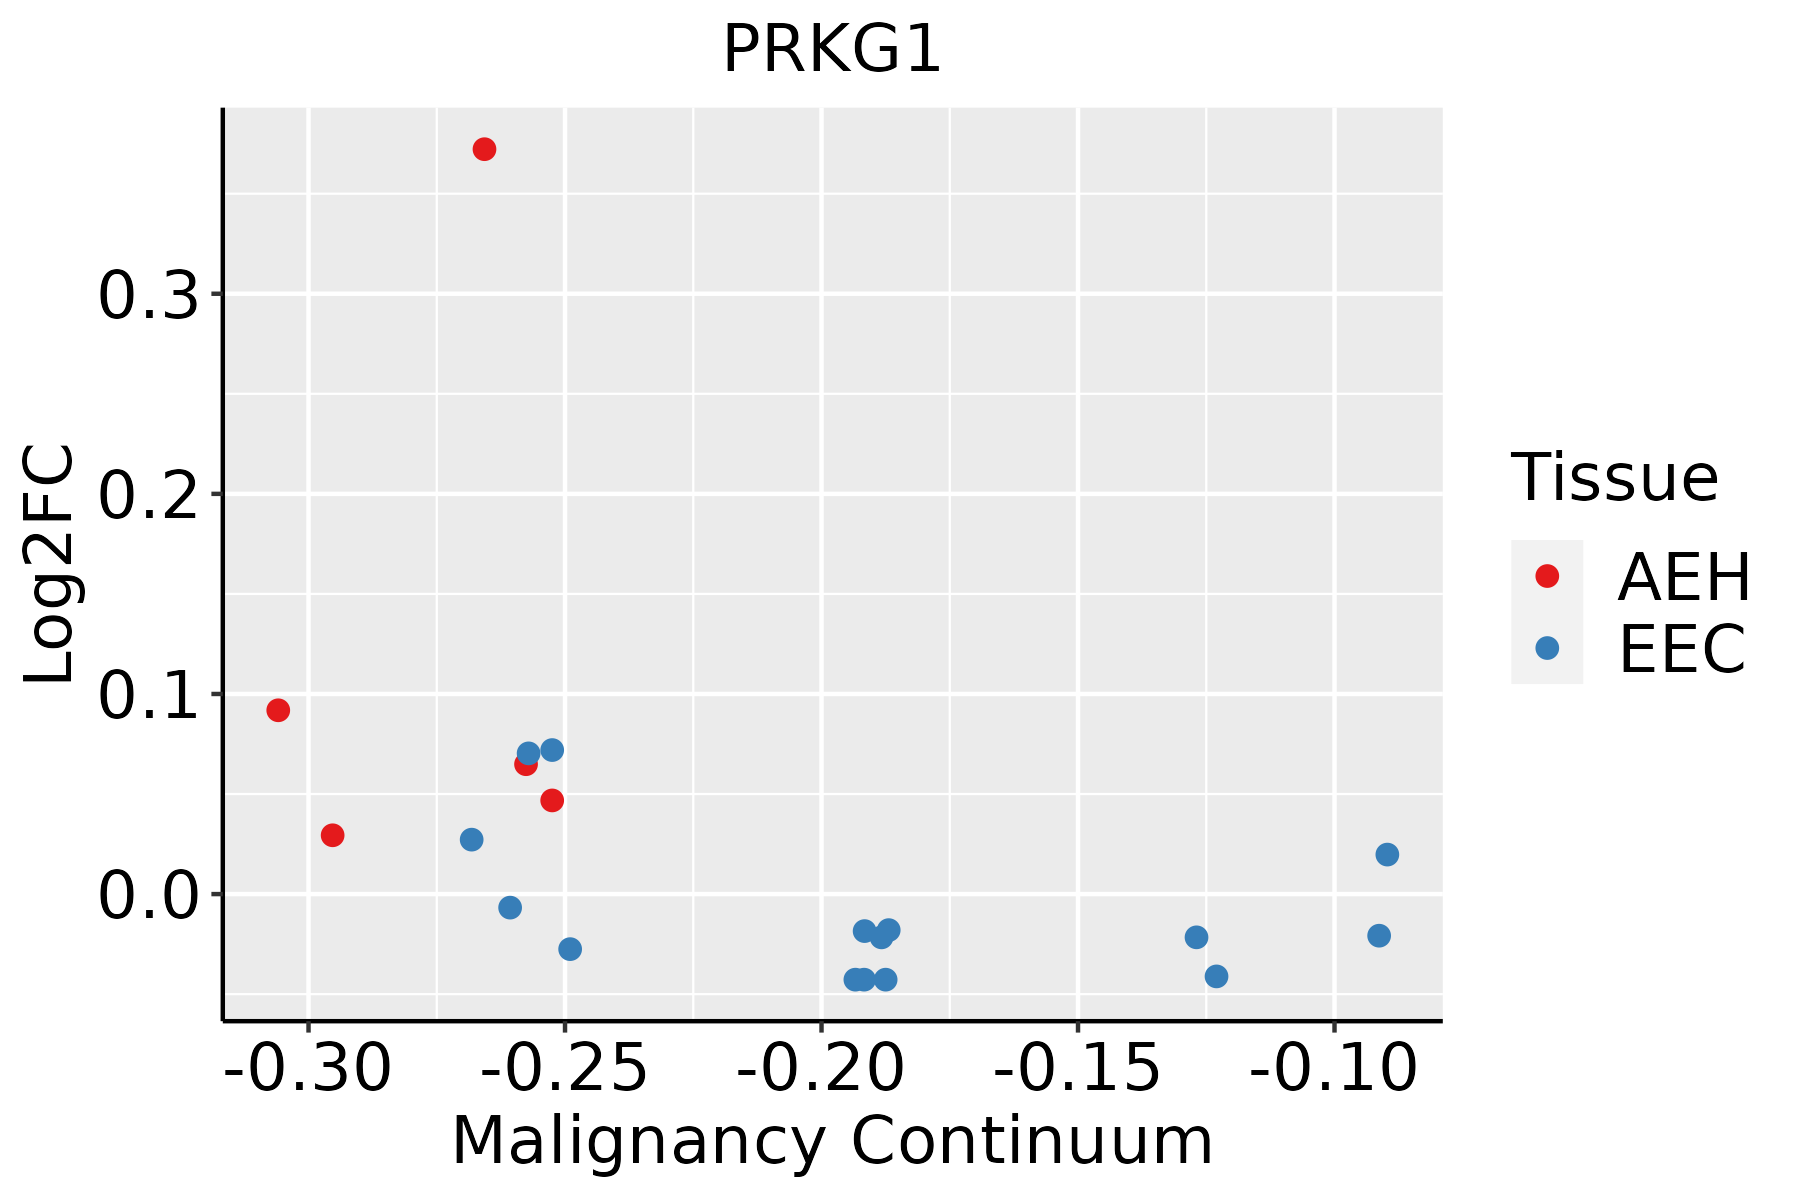 | AEH: Atypical endometrial hyperplasia |
| EEC: Endometrioid Cancer | ||
| Lung | 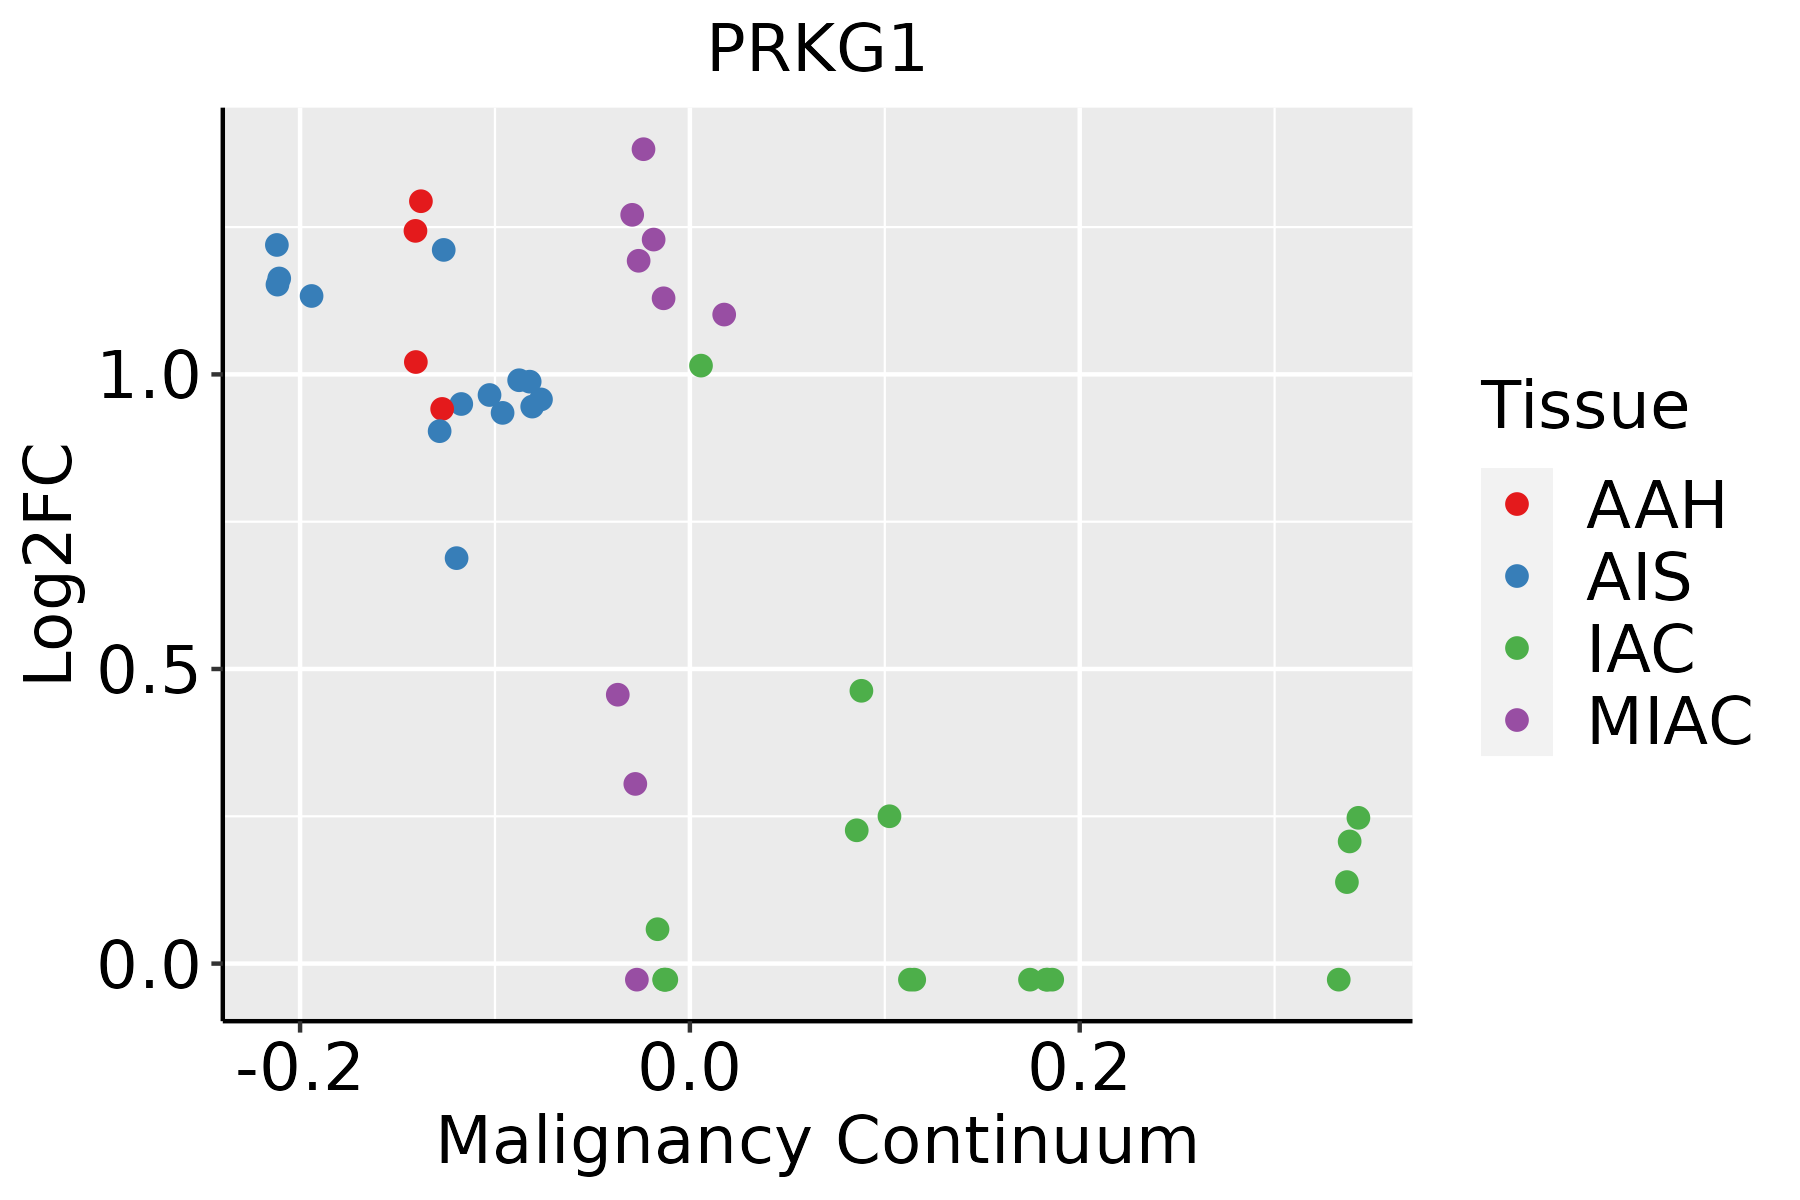 | AAH: Atypical adenomatous hyperplasia |
| AIS: Adenocarcinoma in situ | ||
| IAC: Invasive lung adenocarcinoma | ||
| MIA: Minimally invasive adenocarcinoma | ||
| Oral Cavity |  | EOLP: Erosive Oral lichen planus |
| LP: leukoplakia | ||
| NEOLP: Non-erosive oral lichen planus | ||
| OSCC: Oral squamous cell carcinoma | ||
| Thyroid | 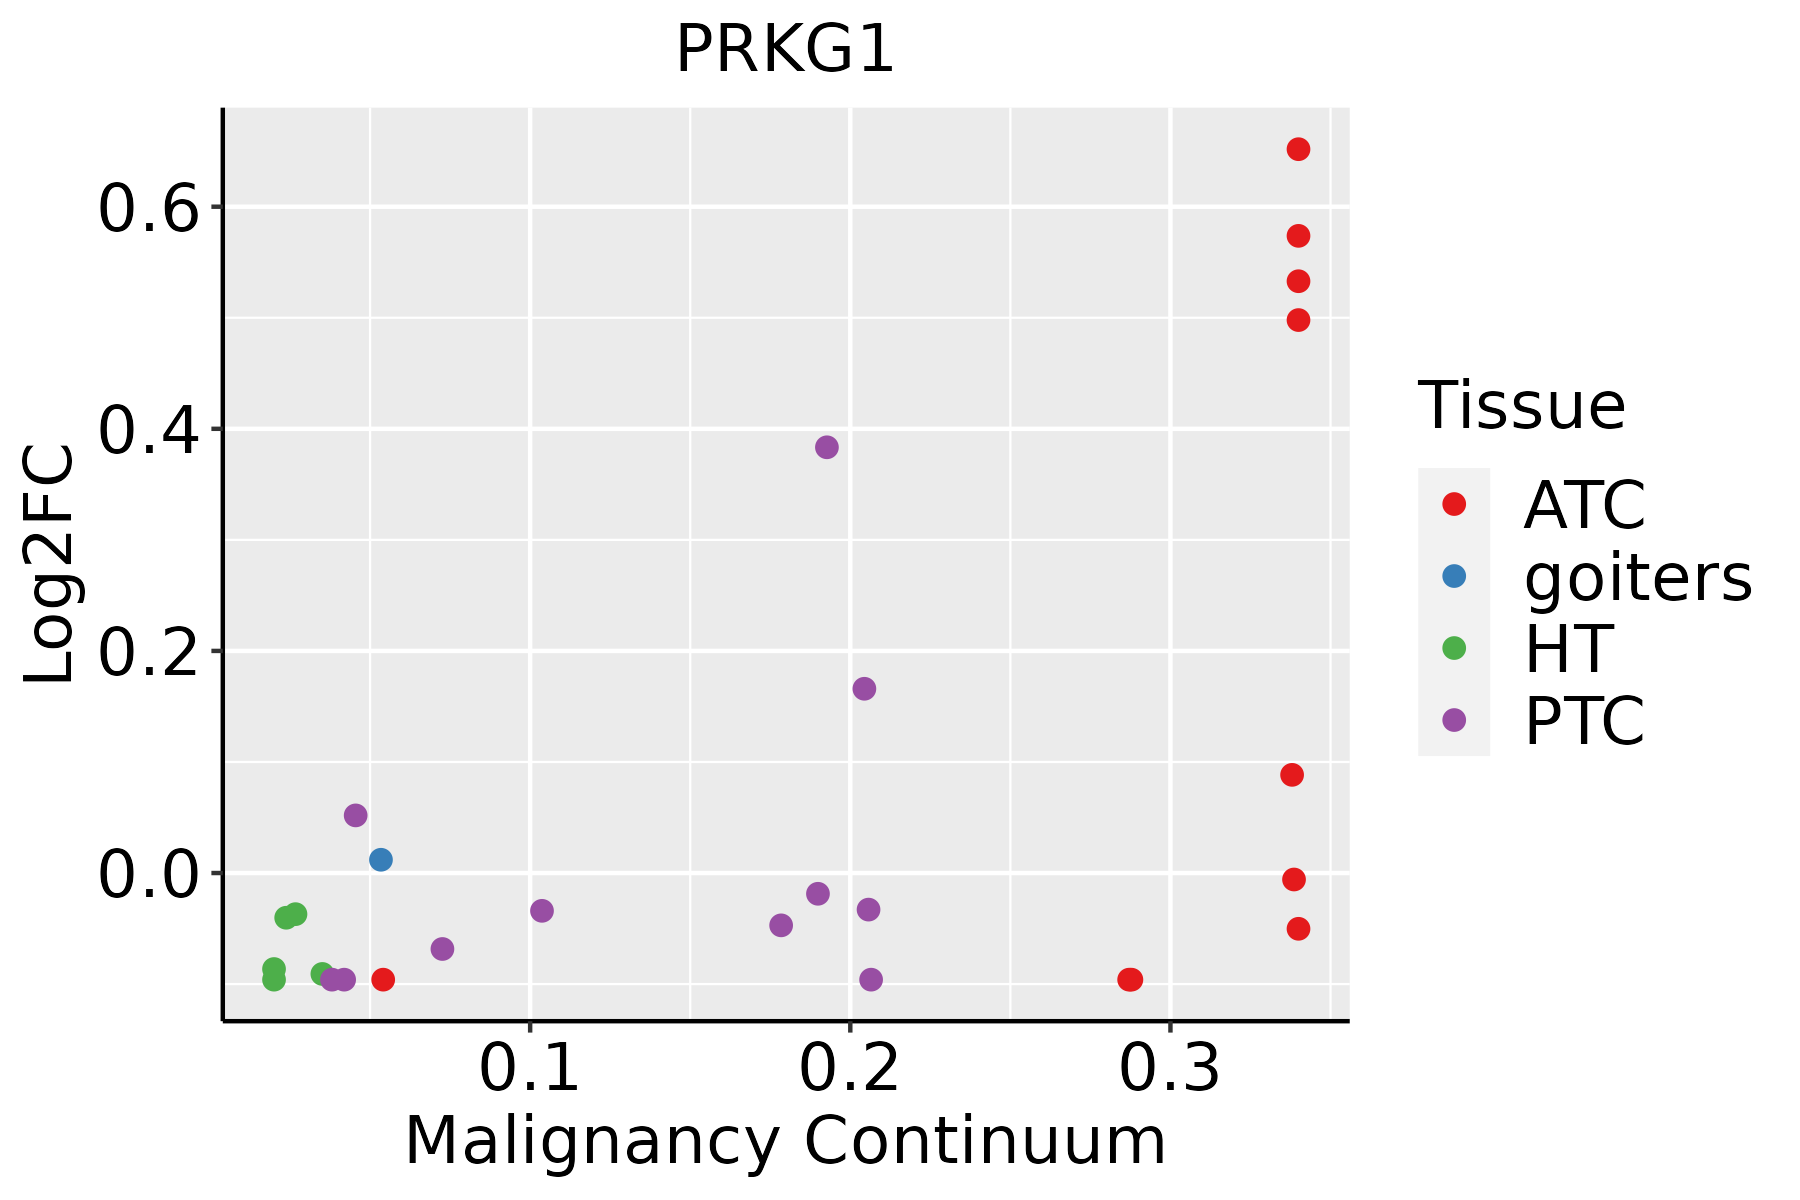 | ATC: Anaplastic thyroid cancer |
| HT: Hashimoto's thyroiditis | ||
| PTC: Papillary thyroid cancer |
| ∗log2FC in expression of this searched gene in stem-like cells from each diseased tissue sample relative to stem-like cells in normal samples in each tissue plotted against the malignancy continuum. Samples are colored based on if they are from different disease stage. |
Top |
Malignant transformation related pathway analysis |
| Find out the enriched GO biological processes and KEGG pathways involved in transition from healthy to precancer to cancer |
| Tissue | Disease Stage | Enriched GO biological Processes |
| Colorectum | AD |  |
| Colorectum | SER |  |
| Colorectum | MSS |  |
| Colorectum | MSI-H |  |
| Colorectum | FAP |  |
| ∗Top 15 enriched GO BP terms are showed in the bar plot of each disease state in each tissue. Each row represents a significant GO biological process which is colored according to the -log10(p.adjust). |
| Page: 1 2 3 4 5 6 7 8 9 |
| GO ID | Tissue | Disease Stage | Description | Gene Ratio | Bg Ratio | pvalue | p.adjust | Count |
| GO:004206020 | Oral cavity | OSCC | wound healing | 237/7305 | 422/18723 | 4.51e-13 | 2.18e-11 | 237 |
| GO:002240718 | Oral cavity | OSCC | regulation of cell-cell adhesion | 218/7305 | 448/18723 | 1.71e-05 | 1.68e-04 | 218 |
| GO:003410919 | Oral cavity | OSCC | homotypic cell-cell adhesion | 55/7305 | 90/18723 | 1.78e-05 | 1.73e-04 | 55 |
| GO:190303418 | Oral cavity | OSCC | regulation of response to wounding | 87/7305 | 167/18723 | 3.91e-04 | 2.38e-03 | 87 |
| GO:005087819 | Oral cavity | OSCC | regulation of body fluid levels | 179/7305 | 379/18723 | 6.19e-04 | 3.50e-03 | 179 |
| GO:004308710 | Oral cavity | OSCC | regulation of GTPase activity | 165/7305 | 348/18723 | 7.94e-04 | 4.27e-03 | 165 |
| GO:00071629 | Oral cavity | OSCC | negative regulation of cell adhesion | 145/7305 | 303/18723 | 9.95e-04 | 5.18e-03 | 145 |
| GO:006104116 | Oral cavity | OSCC | regulation of wound healing | 69/7305 | 134/18723 | 2.19e-03 | 9.95e-03 | 69 |
| GO:007052718 | Oral cavity | OSCC | platelet aggregation | 37/7305 | 67/18723 | 5.14e-03 | 2.01e-02 | 37 |
| GO:00486596 | Oral cavity | OSCC | smooth muscle cell proliferation | 89/7305 | 184/18723 | 5.95e-03 | 2.27e-02 | 89 |
| GO:00075969 | Oral cavity | OSCC | blood coagulation | 102/7305 | 217/18723 | 9.69e-03 | 3.43e-02 | 102 |
| GO:00341104 | Oral cavity | OSCC | regulation of homotypic cell-cell adhesion | 20/7305 | 33/18723 | 9.78e-03 | 3.45e-02 | 20 |
| GO:00486606 | Oral cavity | OSCC | regulation of smooth muscle cell proliferation | 86/7305 | 180/18723 | 1.00e-02 | 3.49e-02 | 86 |
| GO:001635810 | Oral cavity | OSCC | dendrite development | 113/7305 | 243/18723 | 1.00e-02 | 3.49e-02 | 113 |
| GO:00330024 | Oral cavity | OSCC | muscle cell proliferation | 115/7305 | 248/18723 | 1.05e-02 | 3.58e-02 | 115 |
| GO:00224086 | Oral cavity | OSCC | negative regulation of cell-cell adhesion | 92/7305 | 196/18723 | 1.41e-02 | 4.64e-02 | 92 |
| GO:00075999 | Oral cavity | OSCC | hemostasis | 103/7305 | 222/18723 | 1.45e-02 | 4.73e-02 | 103 |
| GO:00508179 | Oral cavity | OSCC | coagulation | 103/7305 | 222/18723 | 1.45e-02 | 4.73e-02 | 103 |
| GO:004206026 | Oral cavity | EOLP | wound healing | 99/2218 | 422/18723 | 1.18e-11 | 1.85e-09 | 99 |
| GO:002240719 | Oral cavity | EOLP | regulation of cell-cell adhesion | 93/2218 | 448/18723 | 3.65e-08 | 1.41e-06 | 93 |
| Page: 1 2 3 4 5 6 7 8 9 10 11 12 |
| Pathway ID | Tissue | Disease Stage | Description | Gene Ratio | Bg Ratio | pvalue | p.adjust | qvalue | Count |
| hsa04714 | Colorectum | AD | Thermogenesis | 120/2092 | 232/8465 | 2.76e-19 | 1.16e-17 | 7.37e-18 | 120 |
| hsa047141 | Colorectum | AD | Thermogenesis | 120/2092 | 232/8465 | 2.76e-19 | 1.16e-17 | 7.37e-18 | 120 |
| hsa047142 | Colorectum | SER | Thermogenesis | 106/1580 | 232/8465 | 1.15e-21 | 6.34e-20 | 4.61e-20 | 106 |
| hsa047143 | Colorectum | SER | Thermogenesis | 106/1580 | 232/8465 | 1.15e-21 | 6.34e-20 | 4.61e-20 | 106 |
| hsa047144 | Colorectum | MSS | Thermogenesis | 113/1875 | 232/8465 | 1.52e-19 | 4.62e-18 | 2.83e-18 | 113 |
| hsa04022 | Colorectum | MSS | cGMP-PKG signaling pathway | 51/1875 | 167/8465 | 6.83e-03 | 2.73e-02 | 1.67e-02 | 51 |
| hsa04713 | Colorectum | MSS | Circadian entrainment | 32/1875 | 97/8465 | 8.84e-03 | 3.25e-02 | 1.99e-02 | 32 |
| hsa047145 | Colorectum | MSS | Thermogenesis | 113/1875 | 232/8465 | 1.52e-19 | 4.62e-18 | 2.83e-18 | 113 |
| hsa040221 | Colorectum | MSS | cGMP-PKG signaling pathway | 51/1875 | 167/8465 | 6.83e-03 | 2.73e-02 | 1.67e-02 | 51 |
| hsa047131 | Colorectum | MSS | Circadian entrainment | 32/1875 | 97/8465 | 8.84e-03 | 3.25e-02 | 1.99e-02 | 32 |
| hsa047148 | Colorectum | FAP | Thermogenesis | 70/1404 | 232/8465 | 1.38e-07 | 3.08e-06 | 1.87e-06 | 70 |
| hsa040222 | Colorectum | FAP | cGMP-PKG signaling pathway | 42/1404 | 167/8465 | 2.84e-03 | 1.27e-02 | 7.70e-03 | 42 |
| hsa04611 | Colorectum | FAP | Platelet activation | 32/1404 | 124/8465 | 5.67e-03 | 2.18e-02 | 1.32e-02 | 32 |
| hsa04270 | Colorectum | FAP | Vascular smooth muscle contraction | 33/1404 | 134/8465 | 1.05e-02 | 3.74e-02 | 2.28e-02 | 33 |
| hsa04970 | Colorectum | FAP | Salivary secretion | 24/1404 | 93/8465 | 1.52e-02 | 4.99e-02 | 3.03e-02 | 24 |
| hsa047149 | Colorectum | FAP | Thermogenesis | 70/1404 | 232/8465 | 1.38e-07 | 3.08e-06 | 1.87e-06 | 70 |
| hsa040223 | Colorectum | FAP | cGMP-PKG signaling pathway | 42/1404 | 167/8465 | 2.84e-03 | 1.27e-02 | 7.70e-03 | 42 |
| hsa046111 | Colorectum | FAP | Platelet activation | 32/1404 | 124/8465 | 5.67e-03 | 2.18e-02 | 1.32e-02 | 32 |
| hsa042701 | Colorectum | FAP | Vascular smooth muscle contraction | 33/1404 | 134/8465 | 1.05e-02 | 3.74e-02 | 2.28e-02 | 33 |
| hsa049701 | Colorectum | FAP | Salivary secretion | 24/1404 | 93/8465 | 1.52e-02 | 4.99e-02 | 3.03e-02 | 24 |
| Page: 1 2 3 |
Top |
Cell-cell communication analysis |
| Identification of potential cell-cell interactions between two cell types and their ligand-receptor pairs for different disease states |
| Ligand | Receptor | LRpair | Pathway | Tissue | Disease Stage |
| Page: 1 |
Top |
Single-cell gene regulatory network inference analysis |
| Find out the significant the regulons (TFs) and the target genes of each regulon across cell types for different disease states |
| TF | Cell Type | Tissue | Disease Stage | Target Gene | RSS | Regulon Activity |
| ∗The dot plots of a searched regulon are shown for all cell subpopulations in each disease state of each tissue based on the regulon specific score inferred using pySCENIC and by calculating the average expression. |
| Page: 1 |
Top |
Somatic mutation of malignant transformation related genes |
| Annotation of somatic variants for genes involved in malignant transformation |
| Hugo Symbol | Variant Class | Variant Classification | dbSNP RS | HGVSc | HGVSp | HGVSp Short | SWISSPROT | BIOTYPE | SIFT | PolyPhen | Tumor Sample Barcode | Tissue | Histology | Sex | Age | Stage | Therapy Types | Drugs | Outcome |
| PRKG1 | SNV | Missense_Mutation | c.731N>A | p.Ile244Asn | p.I244N | Q13976 | protein_coding | tolerated(0.34) | benign(0.031) | TCGA-B6-A0IB-01 | Breast | breast invasive carcinoma | Female | <65 | III/IV | Unknown | Unknown | PD | |
| PRKG1 | SNV | Missense_Mutation | rs549568221 | c.866N>T | p.Pro289Leu | p.P289L | Q13976 | protein_coding | tolerated(0.09) | benign(0.04) | TCGA-BH-A0HF-01 | Breast | breast invasive carcinoma | Female | >=65 | I/II | Hormone Therapy | arimidex | SD |
| PRKG1 | SNV | Missense_Mutation | c.1526A>G | p.His509Arg | p.H509R | Q13976 | protein_coding | tolerated(0.26) | benign(0.062) | TCGA-BH-A18G-01 | Breast | breast invasive carcinoma | Female | >=65 | I/II | Unknown | Unknown | SD | |
| PRKG1 | SNV | Missense_Mutation | c.213N>T | p.Glu71Asp | p.E71D | Q13976 | protein_coding | tolerated(0.35) | benign(0.029) | TCGA-C8-A274-01 | Breast | breast invasive carcinoma | Female | <65 | I/II | Hormone Therapy | tamoxiphen | SD | |
| PRKG1 | SNV | Missense_Mutation | rs138485549 | c.980N>A | p.Thr327Asn | p.T327N | Q13976 | protein_coding | tolerated(0.17) | benign(0.107) | TCGA-D8-A1JP-01 | Breast | breast invasive carcinoma | Female | >=65 | I/II | Hormone Therapy | tamoxiphen | SD |
| PRKG1 | SNV | Missense_Mutation | c.494T>C | p.Val165Ala | p.V165A | Q13976 | protein_coding | deleterious(0) | probably_damaging(0.993) | TCGA-D8-A1XK-01 | Breast | breast invasive carcinoma | Female | <65 | I/II | Chemotherapy | doxorubicine+cyclophosphamide | SD | |
| PRKG1 | SNV | Missense_Mutation | c.701T>C | p.Val234Ala | p.V234A | Q13976 | protein_coding | deleterious(0) | probably_damaging(0.99) | TCGA-D8-A1XK-01 | Breast | breast invasive carcinoma | Female | <65 | I/II | Chemotherapy | doxorubicine+cyclophosphamide | SD | |
| PRKG1 | SNV | Missense_Mutation | c.485N>T | p.Lys162Met | p.K162M | Q13976 | protein_coding | tolerated(0.13) | benign(0.033) | TCGA-E2-A1IN-01 | Breast | breast invasive carcinoma | Female | <65 | I/II | Hormone Therapy | arimidex | SD | |
| PRKG1 | SNV | Missense_Mutation | rs763460888 | c.40C>T | p.Leu14Phe | p.L14F | Q13976 | protein_coding | tolerated(0.16) | benign(0.133) | TCGA-2W-A8YY-01 | Cervix | cervical & endocervical cancer | Female | <65 | I/II | Chemotherapy | cisplatin | CR |
| PRKG1 | SNV | Missense_Mutation | novel | c.1871N>A | p.Gly624Glu | p.G624E | Q13976 | protein_coding | deleterious(0.01) | possibly_damaging(0.833) | TCGA-DS-A1OD-01 | Cervix | cervical & endocervical cancer | Female | <65 | I/II | Chemotherapy | cisplatin | SD |
| Page: 1 2 3 4 5 6 7 8 9 10 11 12 13 14 15 |
Top |
Related drugs of malignant transformation related genes |
| Identification of chemicals and drugs interact with genes involved in malignant transfromation |
| (DGIdb 4.0) |
| Entrez ID | Symbol | Category | Interaction Types | Drug Claim Name | Drug Name | PMIDs |
| 5592 | PRKG1 | ENZYME, KINASE, SERINE THREONINE KINASE, DRUGGABLE GENOME | GSK-269962A | GSK-269962A | ||
| 5592 | PRKG1 | ENZYME, KINASE, SERINE THREONINE KINASE, DRUGGABLE GENOME | inhibitor | 249565578 | IPATASERTIB | |
| 5592 | PRKG1 | ENZYME, KINASE, SERINE THREONINE KINASE, DRUGGABLE GENOME | inhibitor | 178101884 | GSK-690693 | |
| 5592 | PRKG1 | ENZYME, KINASE, SERINE THREONINE KINASE, DRUGGABLE GENOME | SOTRASTAURIN | SOTRASTAURIN | ||
| 5592 | PRKG1 | ENZYME, KINASE, SERINE THREONINE KINASE, DRUGGABLE GENOME | GW843682X | GW843682X | ||
| 5592 | PRKG1 | ENZYME, KINASE, SERINE THREONINE KINASE, DRUGGABLE GENOME | inhibitor | 178101945 | ||
| 5592 | PRKG1 | ENZYME, KINASE, SERINE THREONINE KINASE, DRUGGABLE GENOME | LINIFANIB | LINIFANIB | ||
| 5592 | PRKG1 | ENZYME, KINASE, SERINE THREONINE KINASE, DRUGGABLE GENOME | TAE-684 | TAE-684 | ||
| 5592 | PRKG1 | ENZYME, KINASE, SERINE THREONINE KINASE, DRUGGABLE GENOME | CENISERTIB | CENISERTIB | ||
| 5592 | PRKG1 | ENZYME, KINASE, SERINE THREONINE KINASE, DRUGGABLE GENOME | PHA-767491 | CHEMBL225519 |
| Page: 1 |

Copyright 2023-Present -The University of Texas Health Science Center at Houston |