Schematic overview of the cellular and molecular mechanisms involved in the cancer progression, including the proposed cellular and molecular mechanisms in cancer cells trajectory. AT1: alveolar type 1 cells; AT2: alveolar type 2 cells; AAH: atypical adenomatous hyperplasia; AIS: adenocarcinoma in situ; MIA: minimally invasive adenocarcinoma; IA: invasive adenocarcinoma; EMT: epithelial-mesenchymal transition

Home

Download

Statistics

Help

Contact

Center for Computational Systems Medicine
leaf

Gene summary

leaf

Malignant transformation analysis

leaf

Malignant transformation related pathway analysis

leaf

Cell-cell communication analysis

leaf

Single-cell gene regulatory network inference analysis

leaf

Somatic mutation of malignant transformation related genes

leaf

Related drugs of malignant transformation related genes

Gene: PRDX4

Gene summary for PRDX4

check button Gene summary.

Gene informationSpeciesHuman
Gene symbol

PRDX4

Gene ID

10549

Gene nameperoxiredoxin 4
Gene AliasAOE37-2
CytomapXp22.11
Gene Typeprotein-coding
GO ID

GO:0000003

UniProtAcc

Q13162


Top

Malignant transformation analysis

check button Identification of the aberrant gene expression in precancerous and cancerous lesions by comparing the gene expression of stem-like cells in diseased tissues with normal stem cells
check button Malignant transformation involving gene list.
Entrez IDSymbolReplicatesSpeciesOrganTissueAdj P-valueLog2FCMalignancy
10549PRDX4GSM4909281HumanBreastIDC1.30e-428.39e-010.21
10549PRDX4GSM4909282HumanBreastIDC1.54e-074.01e-01-0.0288
10549PRDX4GSM4909285HumanBreastIDC1.70e-063.75e-010.21
10549PRDX4GSM4909286HumanBreastIDC8.24e-063.20e-010.1081
10549PRDX4GSM4909287HumanBreastIDC2.58e-022.35e-010.2057
10549PRDX4GSM4909288HumanBreastIDC1.63e-032.15e-010.0988
10549PRDX4GSM4909296HumanBreastIDC8.35e-07-4.48e-020.1524
10549PRDX4GSM4909297HumanBreastIDC1.91e-10-1.44e-010.1517
10549PRDX4GSM4909304HumanBreastIDC1.54e-022.74e-010.1636
10549PRDX4GSM4909308HumanBreastIDC1.84e-021.87e-010.158
10549PRDX4GSM4909311HumanBreastIDC1.26e-22-2.21e-010.1534
10549PRDX4GSM4909312HumanBreastIDC1.79e-096.02e-020.1552
10549PRDX4GSM4909319HumanBreastIDC7.40e-31-2.25e-010.1563
10549PRDX4GSM4909320HumanBreastIDC1.89e-025.23e-030.1575
10549PRDX4GSM4909321HumanBreastIDC8.16e-133.06e-020.1559
10549PRDX4brca1HumanBreastPrecancer2.86e-175.36e-01-0.0338
10549PRDX4brca2HumanBreastPrecancer1.66e-053.48e-01-0.024
10549PRDX4M2HumanBreastIDC4.31e-025.33e-020.21
10549PRDX4NCCBC14HumanBreastDCIS1.22e-04-1.35e-010.2021
10549PRDX4NCCBC5HumanBreastDCIS6.84e-093.99e-020.2046
Page: 1 2 3 4 5 6 7 8 9 10 

check button Transcriptomic changes along malignancy continuum.
TissueExpression DynamicsAbbreviation
BreastThe image shows the transcriptomic changes along malignancy continuum.log2FC in expression of this searched gene in stem-like cells from each diseased tissue sample relative to stem-like cells in normal samples in each tissue plotted against the malignancy continuum. Samples are colored based on if they are from different disease stage.
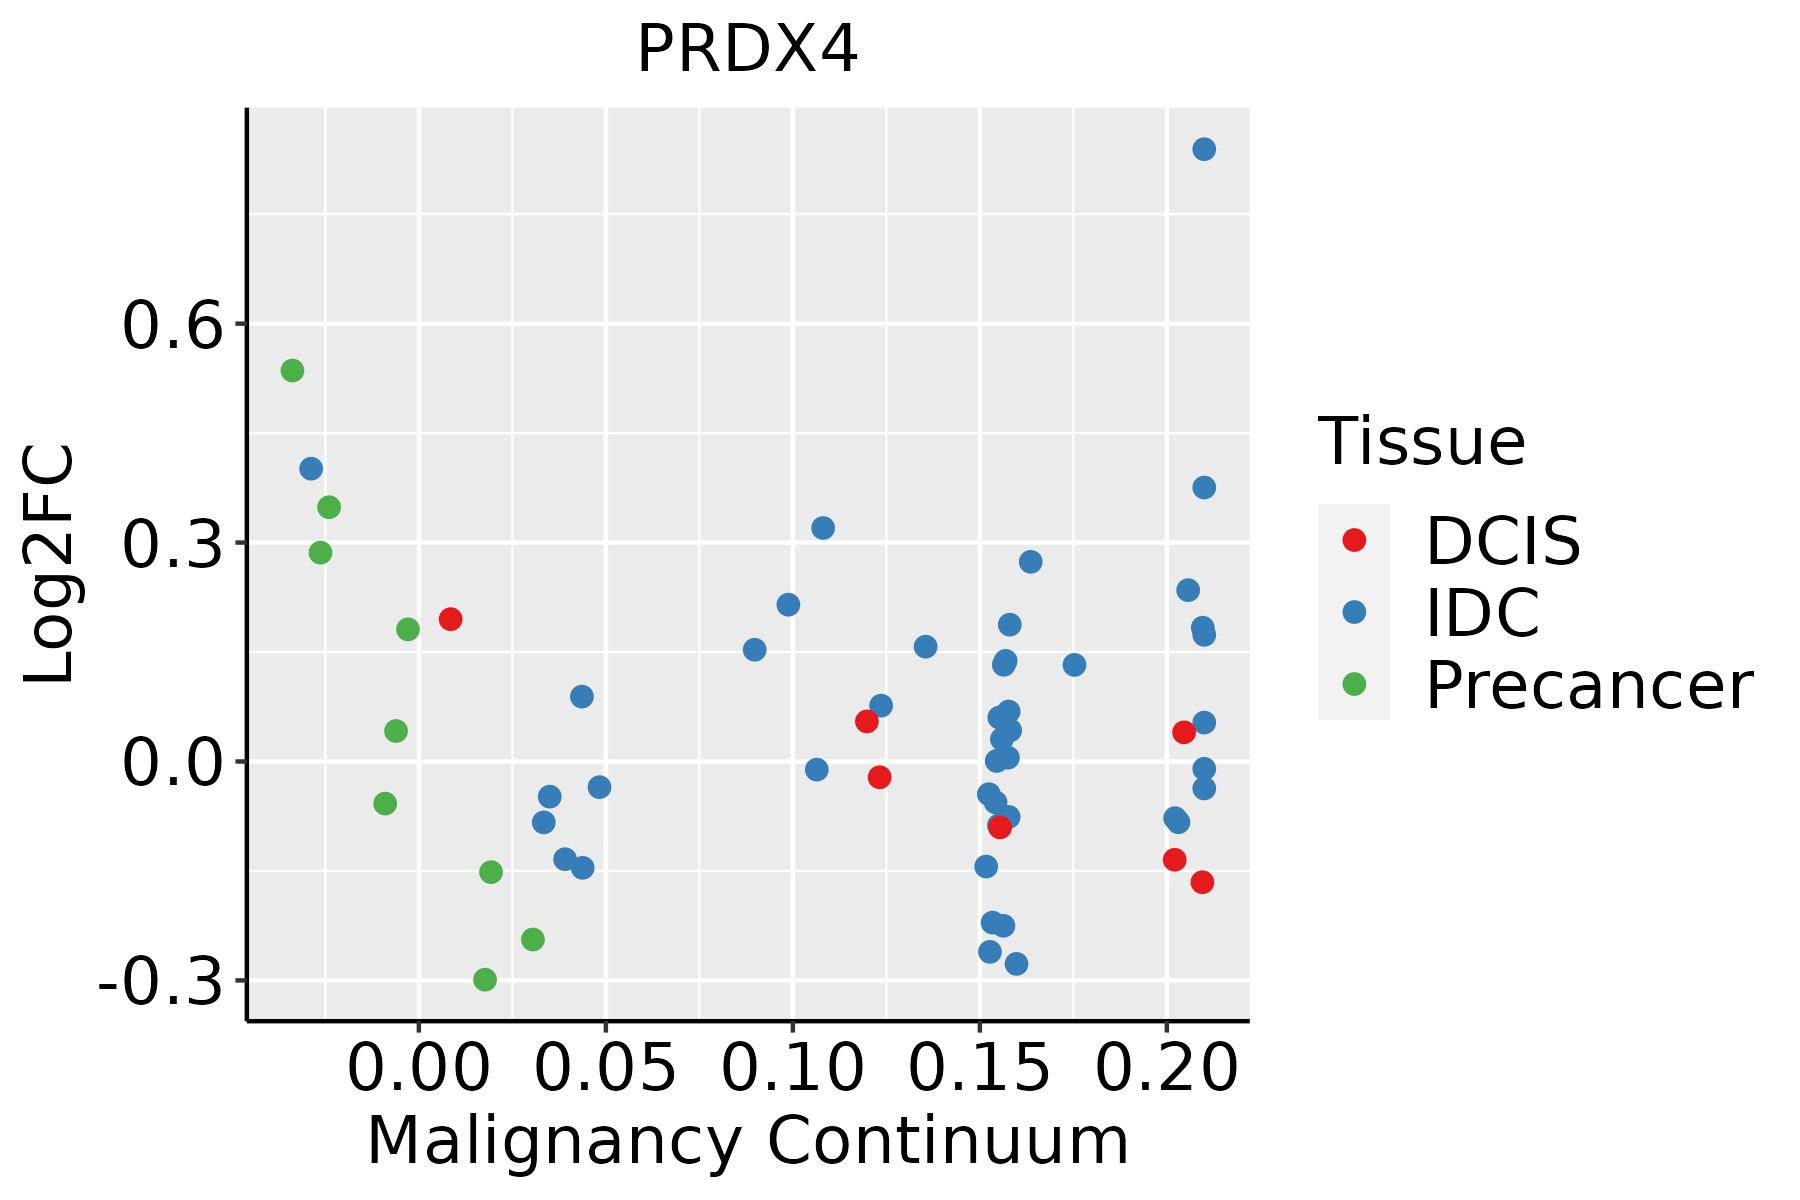
IDC: Invasive ductal carcinoma
DCIS: Ductal carcinoma in situ
Precancer(BRCA1-mut): Precancerous lesion from BRCA1 mutation carriers
EndometriumThe image shows the transcriptomic changes along malignancy continuum.log2FC in expression of this searched gene in stem-like cells from each diseased tissue sample relative to stem-like cells in normal samples in each tissue plotted against the malignancy continuum. Samples are colored based on if they are from different disease stage.AEH: Atypical endometrial hyperplasia
EEC: Endometrioid Cancer
EsophagusThe image shows the transcriptomic changes along malignancy continuum.log2FC in expression of this searched gene in stem-like cells from each diseased tissue sample relative to stem-like cells in normal samples in each tissue plotted against the malignancy continuum. Samples are colored based on if they are from different disease stage.
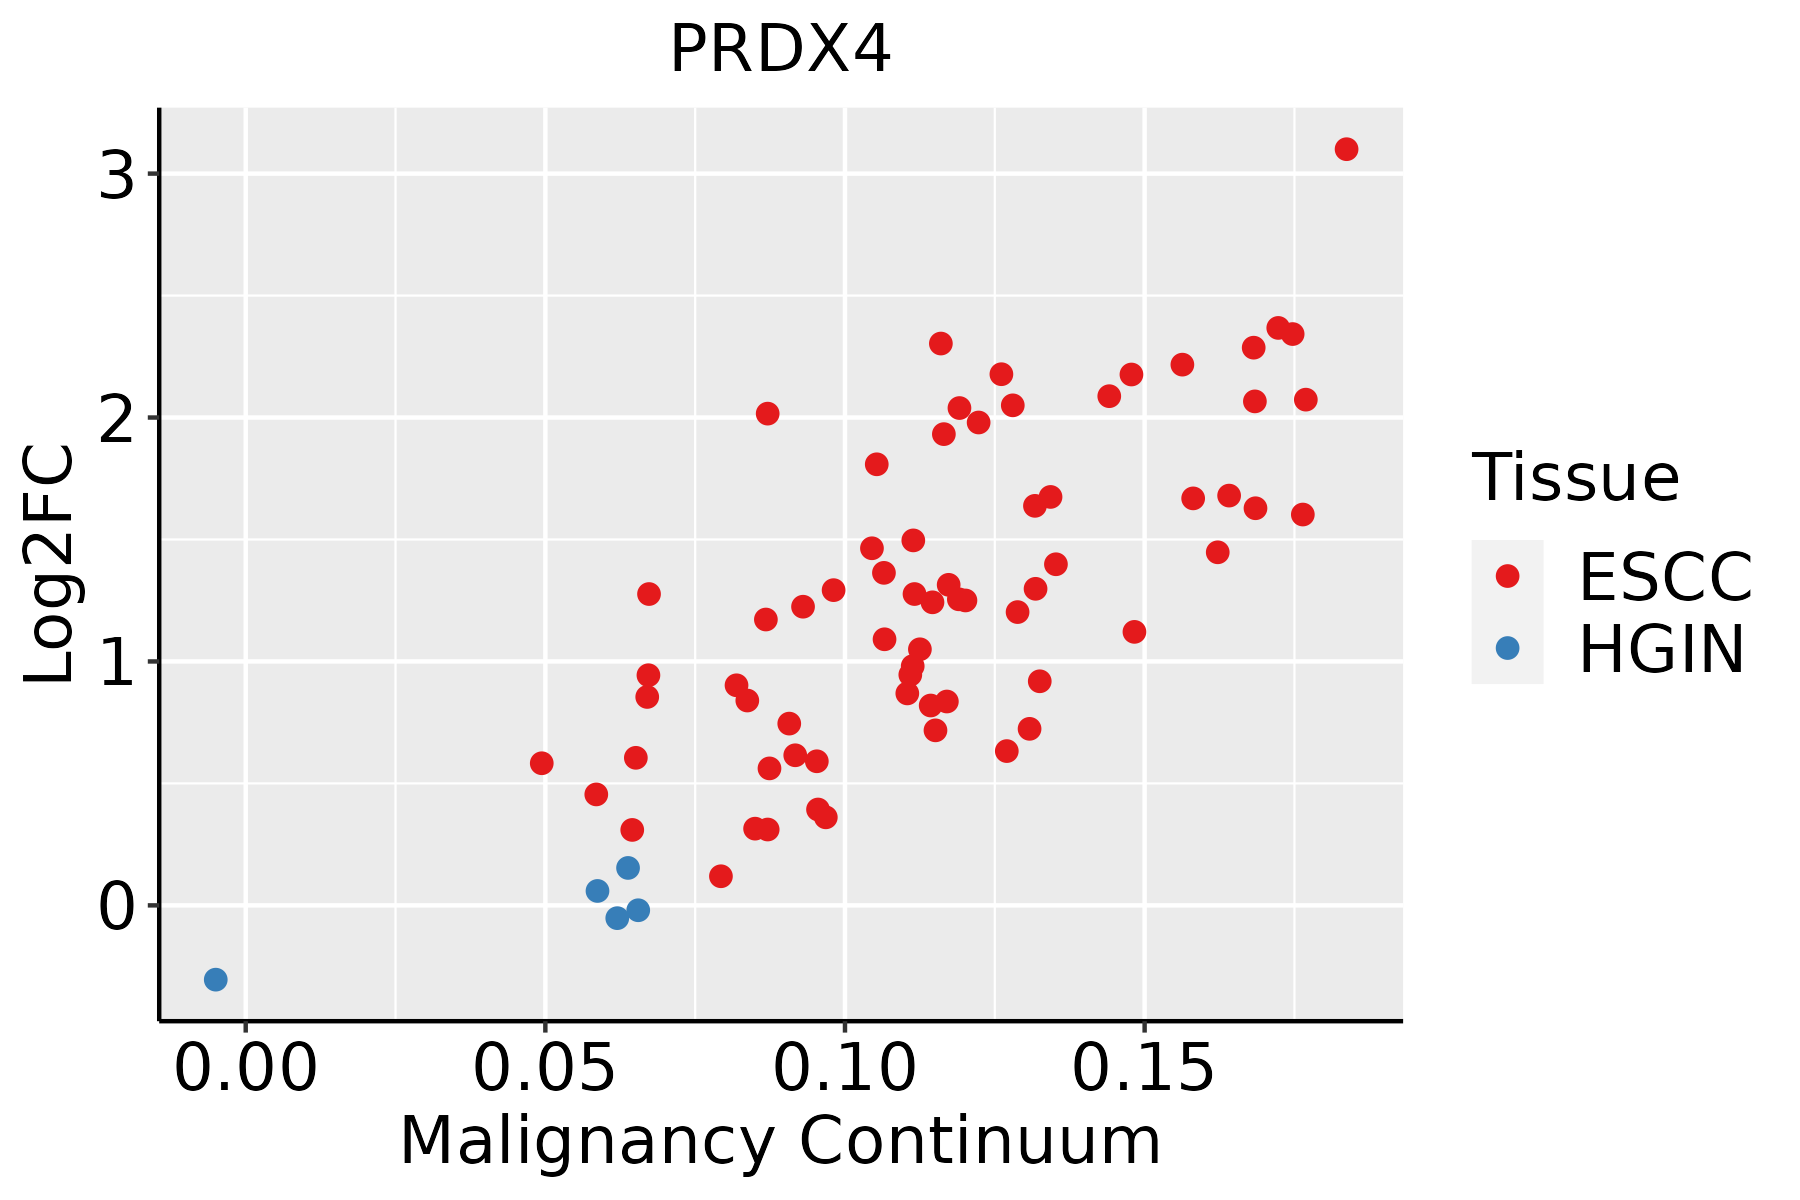
ESCC: Esophageal squamous cell carcinoma
HGIN: High-grade intraepithelial neoplasias
LGIN: Low-grade intraepithelial neoplasias
LiverThe image shows the transcriptomic changes along malignancy continuum.log2FC in expression of this searched gene in stem-like cells from each diseased tissue sample relative to stem-like cells in normal samples in each tissue plotted against the malignancy continuum. Samples are colored based on if they are from different disease stage.
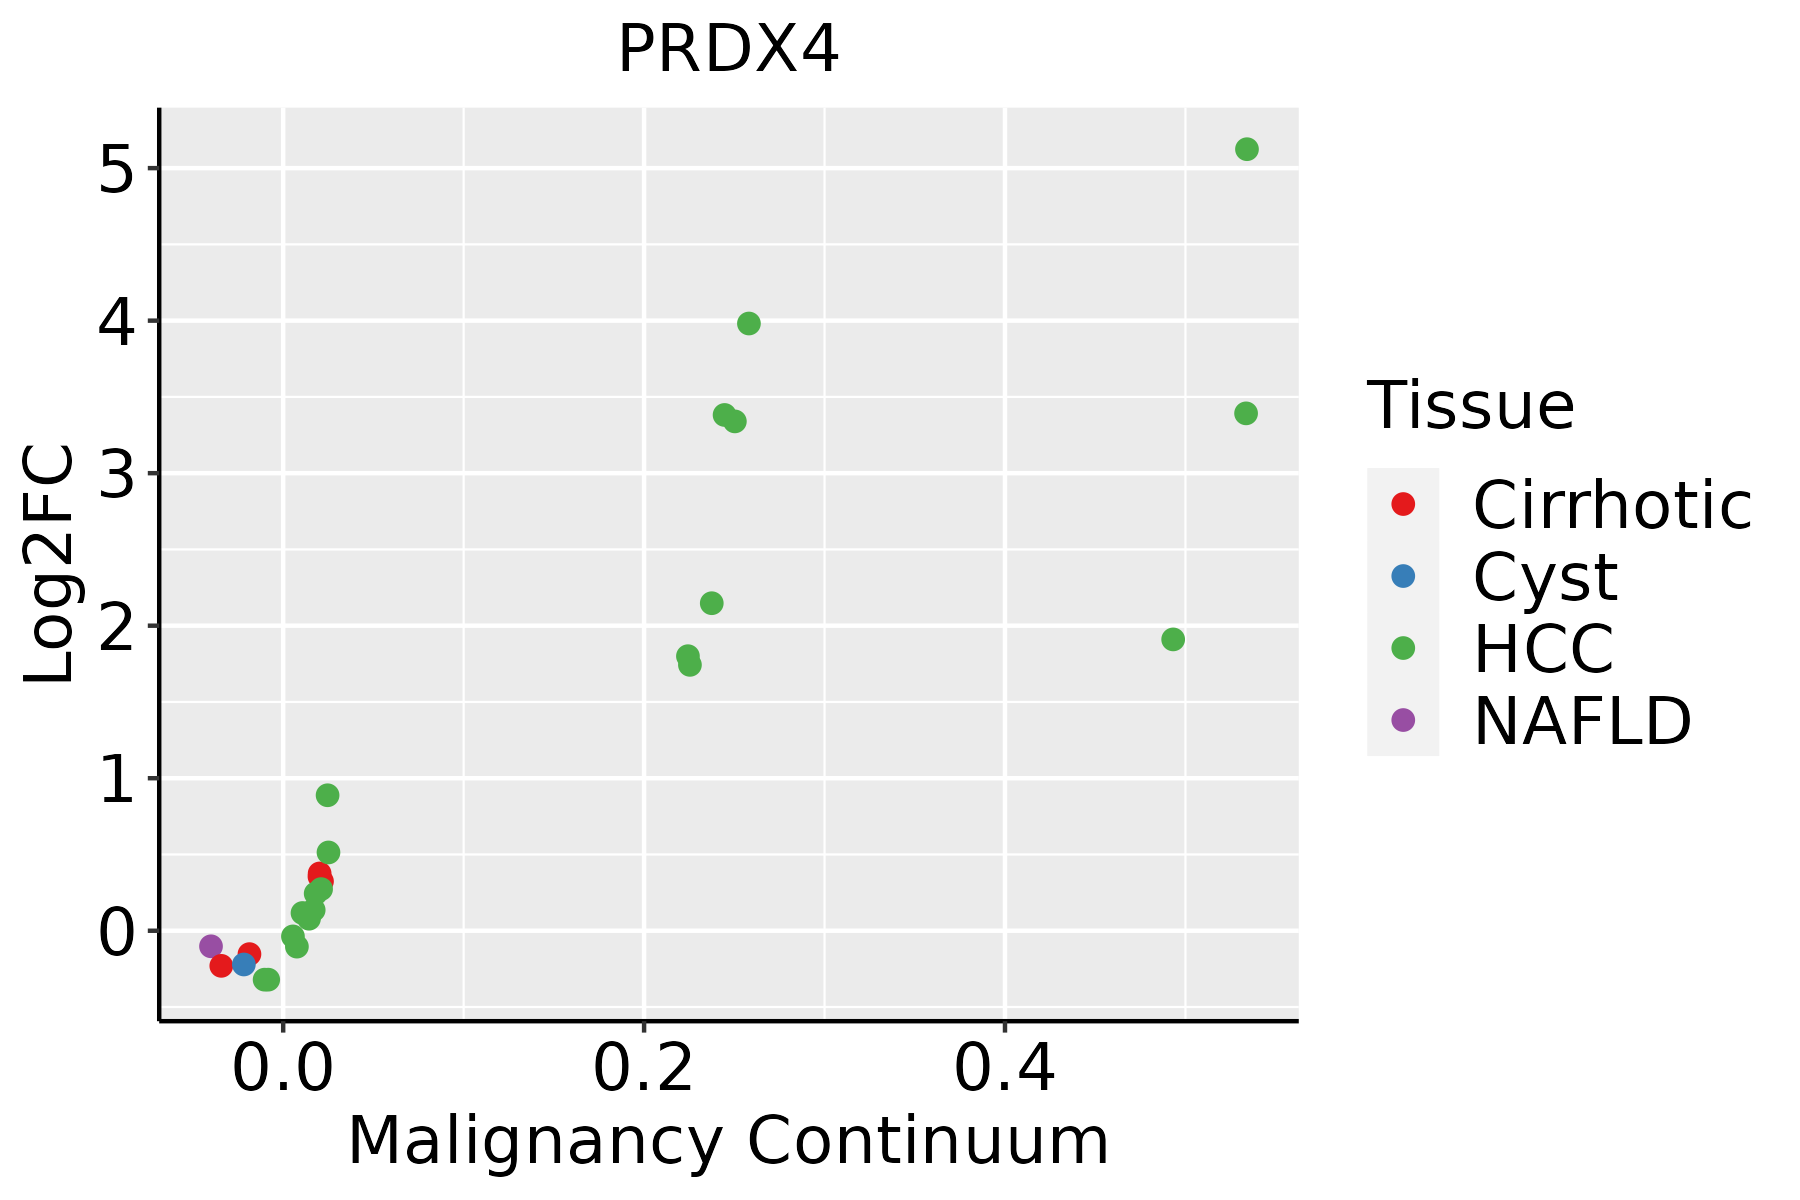
HCC: Hepatocellular carcinoma
NAFLD: Non-alcoholic fatty liver disease
Oral CavityThe image shows the transcriptomic changes along malignancy continuum.log2FC in expression of this searched gene in stem-like cells from each diseased tissue sample relative to stem-like cells in normal samples in each tissue plotted against the malignancy continuum. Samples are colored based on if they are from different disease stage.EOLP: Erosive Oral lichen planus
LP: leukoplakia
NEOLP: Non-erosive oral lichen planus
OSCC: Oral squamous cell carcinoma
ProstateThe image shows the transcriptomic changes along malignancy continuum.log2FC in expression of this searched gene in stem-like cells from each diseased tissue sample relative to stem-like cells in normal samples in each tissue plotted against the malignancy continuum. Samples are colored based on if they are from different disease stage.
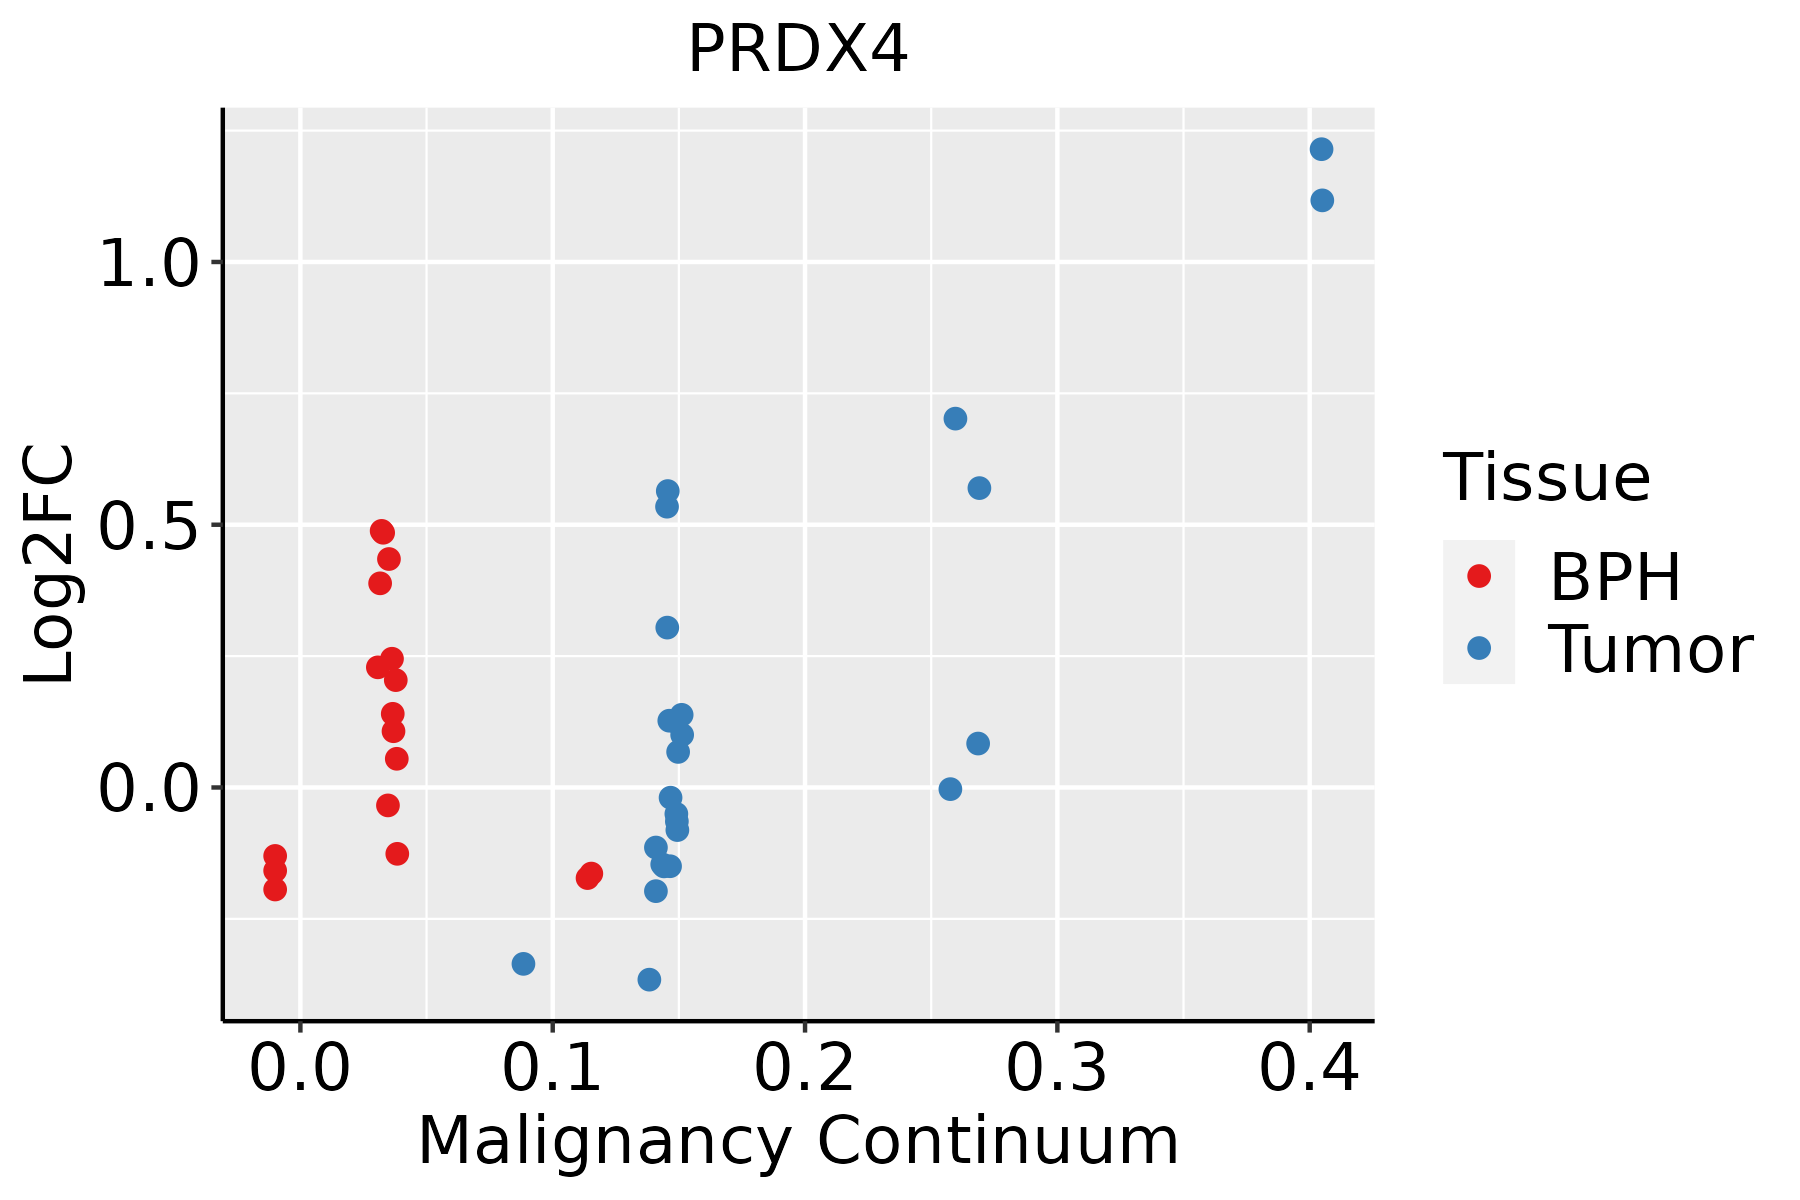
BPH: Benign Prostatic Hyperplasia
SkinThe image shows the transcriptomic changes along malignancy continuum.log2FC in expression of this searched gene in stem-like cells from each diseased tissue sample relative to stem-like cells in normal samples in each tissue plotted against the malignancy continuum. Samples are colored based on if they are from different disease stage.
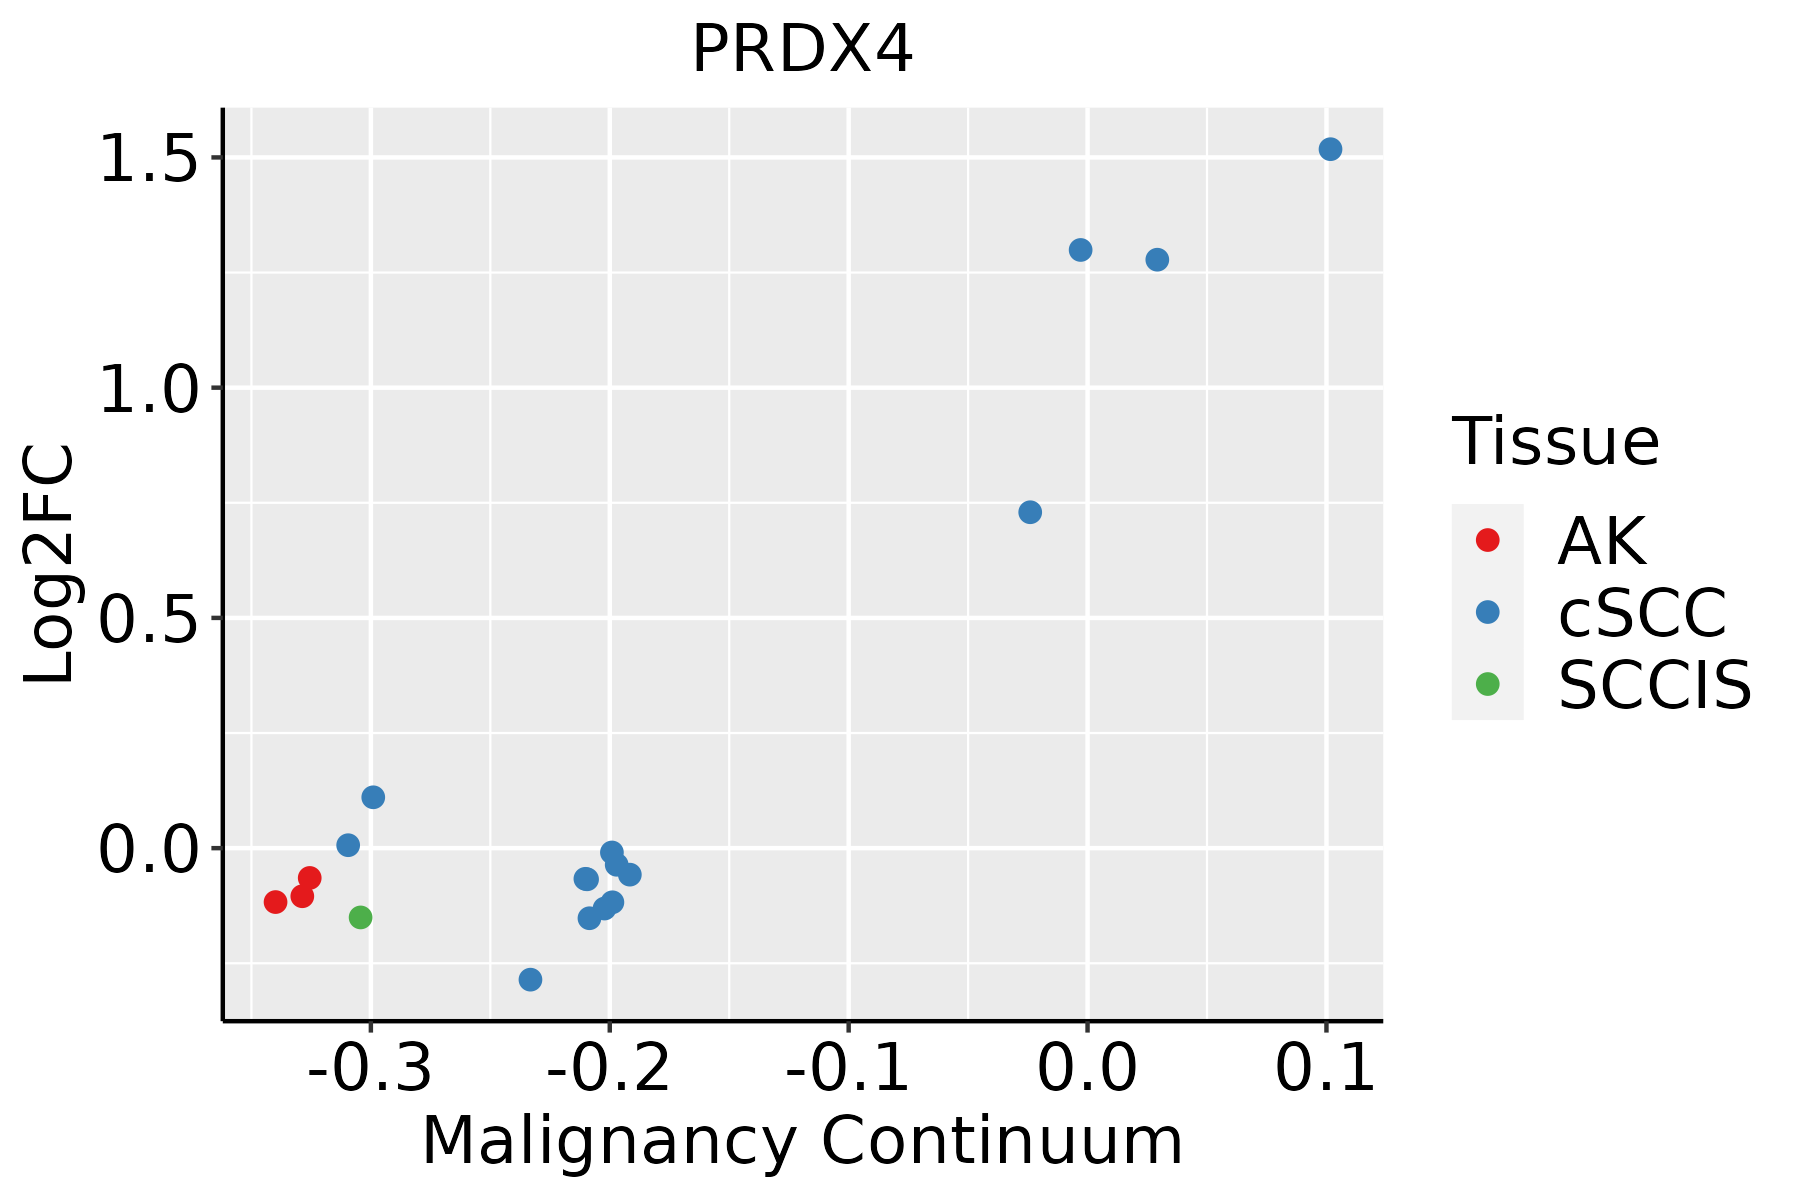
AK: Actinic keratosis
cSCC: Cutaneous squamous cell carcinoma
SCCIS:squamous cell carcinoma in situ
ThyroidThe image shows the transcriptomic changes along malignancy continuum.log2FC in expression of this searched gene in stem-like cells from each diseased tissue sample relative to stem-like cells in normal samples in each tissue plotted against the malignancy continuum. Samples are colored based on if they are from different disease stage.
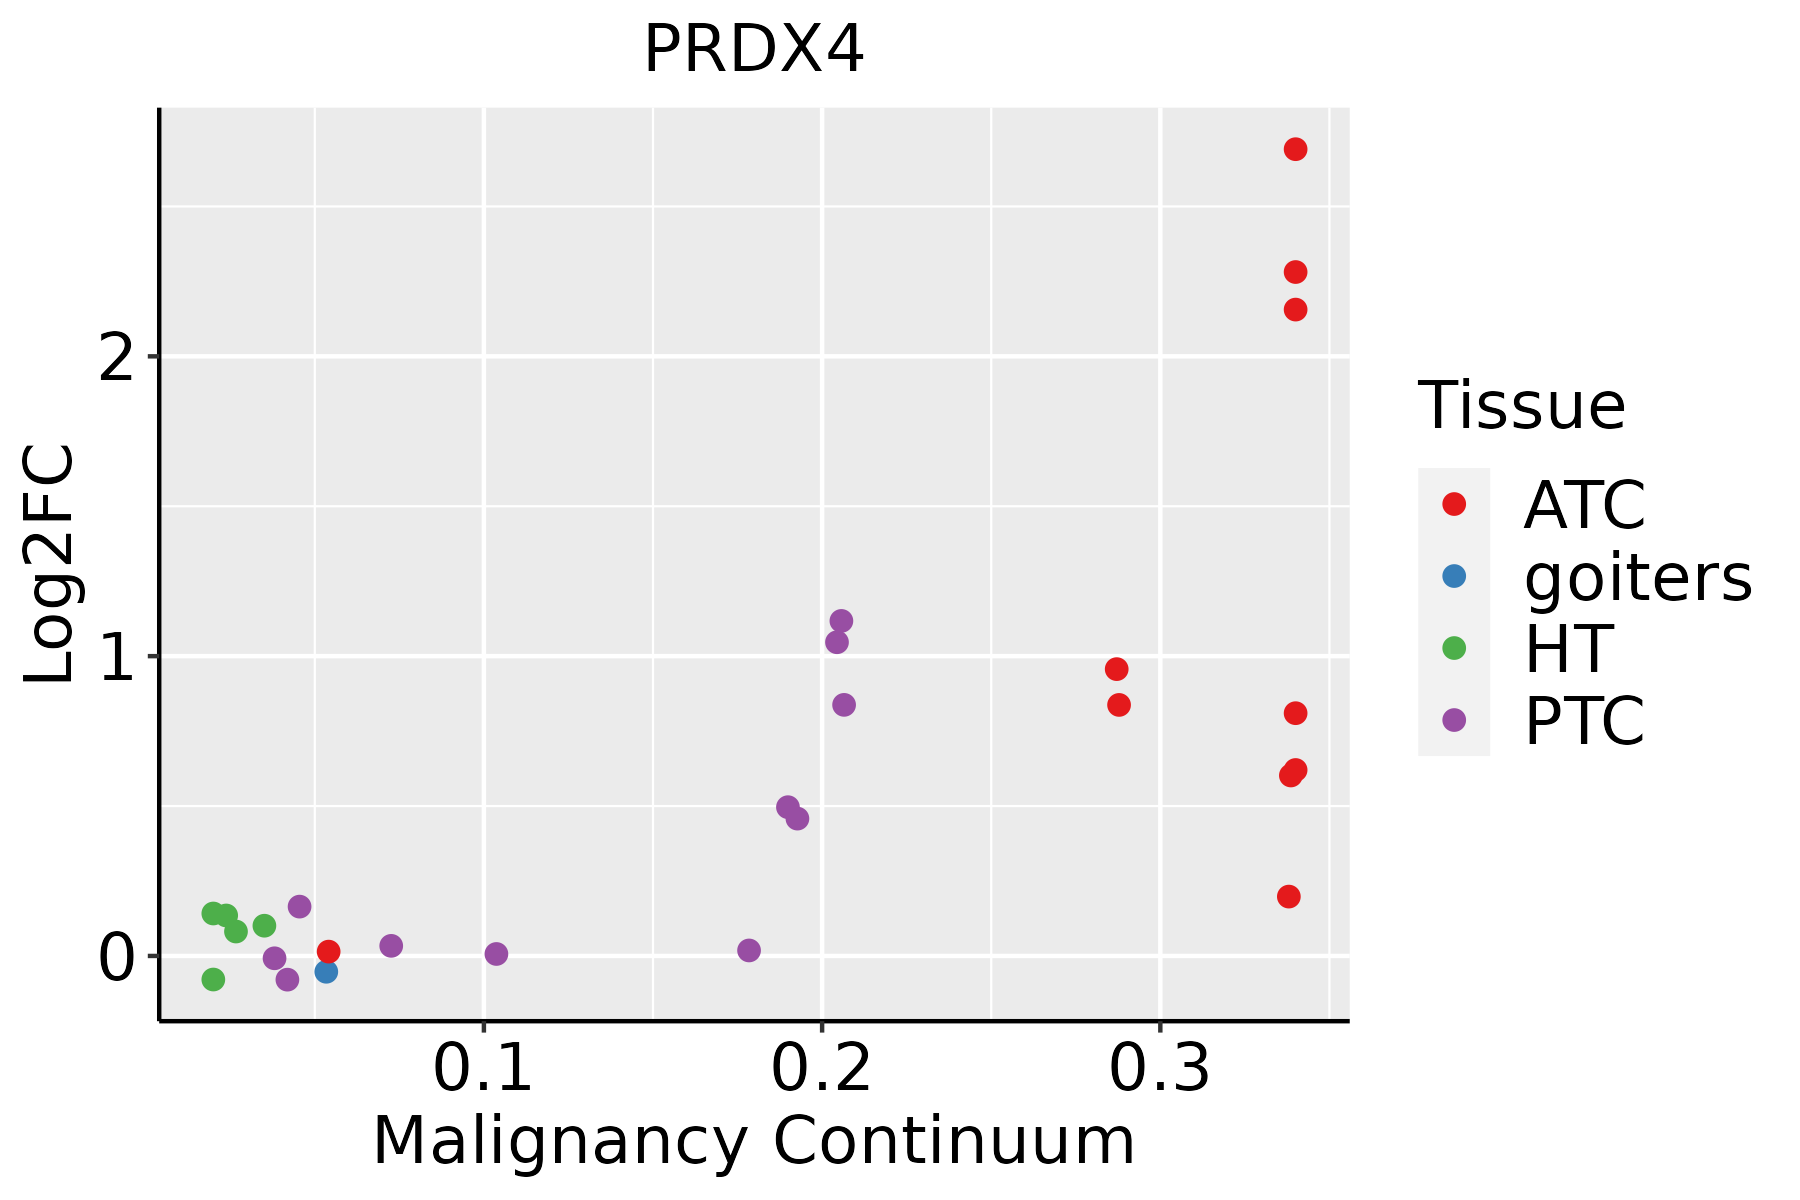
ATC: Anaplastic thyroid cancer
HT: Hashimoto's thyroiditis
PTC: Papillary thyroid cancer
∗log2FC in expression of this searched gene in stem-like cells from each diseased tissue sample relative to stem-like cells in normal samples in each tissue plotted against the malignancy continuum. Samples are colored based on if they are from different disease stage.

Top

Malignant transformation related pathway analysis

check buttonFind out the enriched GO biological processes and KEGG pathways involved in transition from healthy to precancer to cancer
check button Figure of enriched GO biological processes.
TissueDisease StageEnriched GO biological Processes
ColorectumADGO analysis - Figure of enriched GO biological processes: Top 15 enriched GO BP terms are showed in the bar plot of each disease state in each tissue. Each row represents a significant GO biological process which is colored according to the -log10(p.adjust).
ColorectumSERGO analysis - Figure of enriched GO biological processes: Top 15 enriched GO BP terms are showed in the bar plot of each disease state in each tissue. Each row represents a significant GO biological process which is colored according to the -log10(p.adjust).
ColorectumMSSGO analysis - Figure of enriched GO biological processes: Top 15 enriched GO BP terms are showed in the bar plot of each disease state in each tissue. Each row represents a significant GO biological process which is colored according to the -log10(p.adjust).
ColorectumMSI-HGO analysis - Figure of enriched GO biological processes: Top 15 enriched GO BP terms are showed in the bar plot of each disease state in each tissue. Each row represents a significant GO biological process which is colored according to the -log10(p.adjust).
ColorectumFAPGO analysis - Figure of enriched GO biological processes: Top 15 enriched GO BP terms are showed in the bar plot of each disease state in each tissue. Each row represents a significant GO biological process which is colored according to the -log10(p.adjust).
∗Top 15 enriched GO BP terms are showed in the bar plot of each disease state in each tissue. Each row represents a significant GO biological process which is colored according to the -log10(p.adjust).
Page: 1 2 3 4 5 6 7 8 9 

check button Enriched GO biological processes.
GO IDTissueDisease StageDescriptionGene RatioBg Ratiopvaluep.adjustCount
GO:000697912LiverCirrhoticresponse to oxidative stress196/4634446/187232.80e-195.86e-17196
GO:00516046LiverCirrhoticprotein maturation121/4634294/187233.54e-101.68e-08121
GO:000963612LiverCirrhoticresponse to toxic substance104/4634262/187235.63e-081.74e-06104
GO:00072494LiverCirrhoticI-kappaB kinase/NF-kappaB signaling108/4634281/187232.21e-075.64e-06108
GO:00725937LiverCirrhoticreactive oxygen species metabolic process92/4634239/187231.57e-063.03e-0592
GO:00987547LiverCirrhoticdetoxification60/4634152/187234.09e-054.86e-0460
GO:00972377LiverCirrhoticcellular response to toxic substance50/4634124/187239.20e-059.79e-0450
GO:19907487LiverCirrhoticcellular detoxification47/4634116/187231.28e-041.26e-0347
GO:00182084LiverCirrhoticpeptidyl-proline modification26/463458/187236.65e-045.04e-0326
GO:00614585LiverCirrhoticreproductive system development132/4634427/187232.07e-031.28e-02132
GO:00486085LiverCirrhoticreproductive structure development131/4634424/187232.19e-031.34e-02131
GO:00988697LiverCirrhoticcellular oxidant detoxification38/4634101/187232.72e-031.59e-0238
GO:00454547LiverCirrhoticcell redox homeostasis16/463435/187235.53e-032.80e-0216
GO:000645712LiverHCCprotein folding160/7958212/187231.07e-221.88e-20160
GO:000697922LiverHCCresponse to oxidative stress281/7958446/187239.75e-191.24e-16281
GO:005160412LiverHCCprotein maturation171/7958294/187233.80e-088.30e-07171
GO:000963622LiverHCCresponse to toxic substance153/7958262/187231.37e-072.58e-06153
GO:001820811LiverHCCpeptidyl-proline modification42/795858/187233.73e-064.85e-0542
GO:000724912LiverHCCI-kappaB kinase/NF-kappaB signaling156/7958281/187236.66e-068.00e-05156
GO:199074812LiverHCCcellular detoxification70/7958116/187237.87e-057.02e-0470
Page: 1 2 3 4 5 6 7 8 9 10 11 12 13 14 15 

check button Enriched KEGG pathways.
Pathway IDTissueDisease StageDescriptionGene RatioBg Ratiopvaluep.adjustqvalueCount
Page: 1 

Top

Cell-cell communication analysis

check buttonIdentification of potential cell-cell interactions between two cell types and their ligand-receptor pairs for different disease states
LigandReceptorLRpairPathwayTissueDisease Stage
Page: 1 

Top

Single-cell gene regulatory network inference analysis

check buttonFind out the significant the regulons (TFs) and the target genes of each regulon across cell types for different disease states
TFCell TypeTissueDisease StageTarget GeneRSSRegulon Activity
∗The dot plots of a searched regulon are shown for all cell subpopulations in each disease state of each tissue based on the regulon specific score inferred using pySCENIC and by calculating the average expression.
Page: 1 

Top

Somatic mutation of malignant transformation related genes

check buttonAnnotation of somatic variants for genes involved in malignant transformation
Hugo SymbolVariant ClassVariant ClassificationdbSNP RSHGVScHGVSpHGVSp ShortSWISSPROTBIOTYPESIFTPolyPhenTumor Sample BarcodeTissueHistologySexAgeStageTherapy TypesDrugsOutcome
PRDX4SNVMissense_Mutationc.785N>Cp.Gly262Alap.G262AQ13162protein_codingtolerated(0.22)benign(0.018)TCGA-D8-A27G-01Breastbreast invasive carcinomaFemale>=65I/IIUnknownUnknownSD
PRDX4deletionFrame_Shift_Delnovelc.807delAp.Lys269AsnfsTer2p.K269Nfs*2Q13162protein_codingTCGA-D8-A27V-01Breastbreast invasive carcinomaFemale<65I/IIHormone TherapytamoxiphenSD
PRDX4SNVMissense_Mutationnovelc.665N>Ap.Gly222Aspp.G222DQ13162protein_codingdeleterious(0)probably_damaging(1)TCGA-C5-A7X5-01Cervixcervical & endocervical cancerFemale>=65I/IIChemotherapycarboplatinPD
PRDX4SNVMissense_Mutationc.644N>Tp.Thr215Ilep.T215IQ13162protein_codingdeleterious(0)possibly_damaging(0.798)TCGA-A6-4105-01Colorectumcolon adenocarcinomaMale>=65I/IIUnknownUnknownPD
PRDX4SNVMissense_Mutationc.804N>Ap.Asp268Glup.D268EQ13162protein_codingtolerated(1)benign(0)TCGA-AA-3492-01Colorectumcolon adenocarcinomaFemale>=65I/IIUnknownUnknownSD
PRDX4SNVMissense_Mutationnovelc.319N>Tp.Arg107Cysp.R107CQ13162protein_codingdeleterious(0)possibly_damaging(0.882)TCGA-A5-A0G2-01Endometriumuterine corpus endometrioid carcinomaFemale<65III/IVUnknownUnknownSD
PRDX4SNVMissense_Mutationnovelc.194C>Tp.Ser65Phep.S65FQ13162protein_codingtolerated(0.09)benign(0.001)TCGA-AP-A1DK-01Endometriumuterine corpus endometrioid carcinomaFemale<65I/IIUnknownUnknownSD
PRDX4SNVMissense_Mutationnovelc.511C>Tp.Pro171Serp.P171SQ13162protein_codingtolerated(0.32)benign(0.003)TCGA-AP-A1DK-01Endometriumuterine corpus endometrioid carcinomaFemale<65I/IIUnknownUnknownSD
PRDX4SNVMissense_Mutationnovelc.8N>Tp.Ala3Valp.A3VQ13162protein_codingdeleterious_low_confidence(0)benign(0)TCGA-AX-A3FT-01Endometriumuterine corpus endometrioid carcinomaFemale<65I/IIUnknownUnknownSD
PRDX4SNVMissense_Mutationnovelc.319N>Tp.Arg107Cysp.R107CQ13162protein_codingdeleterious(0)possibly_damaging(0.882)TCGA-B5-A0JU-01Endometriumuterine corpus endometrioid carcinomaFemale<65I/IIUnknownUnknownSD
Page: 1 2 3 4 

Top

Related drugs of malignant transformation related genes

check buttonIdentification of chemicals and drugs interact with genes involved in malignant transfromation
(DGIdb 4.0)
Entrez IDSymbolCategoryInteraction TypesDrug Claim NameDrug NamePMIDs
10549PRDX4DRUGGABLE GENOME, TRANSCRIPTION FACTOR, ENZYMEdocetaxelDOCETAXEL20157331
Page: 1