
|
|||||
|
 | |
| |
| |
| |
| |
| |
|
Gene: PIGR |
Gene summary for PIGR |
| Gene information | Species | Human | Gene symbol | PIGR | Gene ID | 5284 |
| Gene name | polymeric immunoglobulin receptor | |
| Gene Alias | PIGR | |
| Cytomap | 1q32.1 | |
| Gene Type | protein-coding | GO ID | GO:0001580 | UniProtAcc | P01833 |
Top |
Malignant transformation analysis |
| Identification of the aberrant gene expression in precancerous and cancerous lesions by comparing the gene expression of stem-like cells in diseased tissues with normal stem cells |
| Entrez ID | Symbol | Replicates | Species | Organ | Tissue | Adj P-value | Log2FC | Malignancy |
| 5284 | PIGR | GSM4909280 | Human | Breast | Precancer | 6.98e-03 | -6.77e-01 | 0.0305 |
| 5284 | PIGR | GSM4909281 | Human | Breast | IDC | 6.51e-32 | -7.16e-01 | 0.21 |
| 5284 | PIGR | GSM4909282 | Human | Breast | IDC | 7.23e-34 | -7.29e-01 | -0.0288 |
| 5284 | PIGR | GSM4909285 | Human | Breast | IDC | 2.83e-34 | -7.20e-01 | 0.21 |
| 5284 | PIGR | GSM4909286 | Human | Breast | IDC | 2.83e-34 | -7.30e-01 | 0.1081 |
| 5284 | PIGR | GSM4909287 | Human | Breast | IDC | 3.57e-25 | -5.57e-01 | 0.2057 |
| 5284 | PIGR | GSM4909289 | Human | Breast | IDC | 3.47e-05 | -7.02e-01 | 0.1064 |
| 5284 | PIGR | GSM4909290 | Human | Breast | IDC | 1.94e-18 | -6.81e-01 | 0.2096 |
| 5284 | PIGR | GSM4909291 | Human | Breast | IDC | 8.97e-22 | -7.30e-01 | 0.1753 |
| 5284 | PIGR | GSM4909293 | Human | Breast | IDC | 2.73e-21 | -6.71e-01 | 0.1581 |
| 5284 | PIGR | GSM4909294 | Human | Breast | IDC | 1.37e-30 | -6.90e-01 | 0.2022 |
| 5284 | PIGR | GSM4909295 | Human | Breast | IDC | 8.28e-06 | -5.25e-01 | 0.0898 |
| 5284 | PIGR | GSM4909296 | Human | Breast | IDC | 3.63e-27 | -6.93e-01 | 0.1524 |
| 5284 | PIGR | GSM4909297 | Human | Breast | IDC | 2.76e-25 | -6.10e-01 | 0.1517 |
| 5284 | PIGR | GSM4909298 | Human | Breast | IDC | 4.02e-12 | -5.46e-01 | 0.1551 |
| 5284 | PIGR | GSM4909301 | Human | Breast | IDC | 2.83e-34 | -7.30e-01 | 0.1577 |
| 5284 | PIGR | GSM4909302 | Human | Breast | IDC | 4.76e-29 | -7.00e-01 | 0.1545 |
| 5284 | PIGR | GSM4909304 | Human | Breast | IDC | 6.38e-36 | -7.28e-01 | 0.1636 |
| 5284 | PIGR | GSM4909306 | Human | Breast | IDC | 6.45e-20 | -6.52e-01 | 0.1564 |
| 5284 | PIGR | GSM4909307 | Human | Breast | IDC | 3.19e-23 | -6.56e-01 | 0.1569 |
| Page: 1 2 3 4 5 6 7 8 9 10 11 12 13 14 |
| Tissue | Expression Dynamics | Abbreviation |
| Breast |  | IDC: Invasive ductal carcinoma |
| DCIS: Ductal carcinoma in situ | ||
| Precancer(BRCA1-mut): Precancerous lesion from BRCA1 mutation carriers | ||
| Cervix | 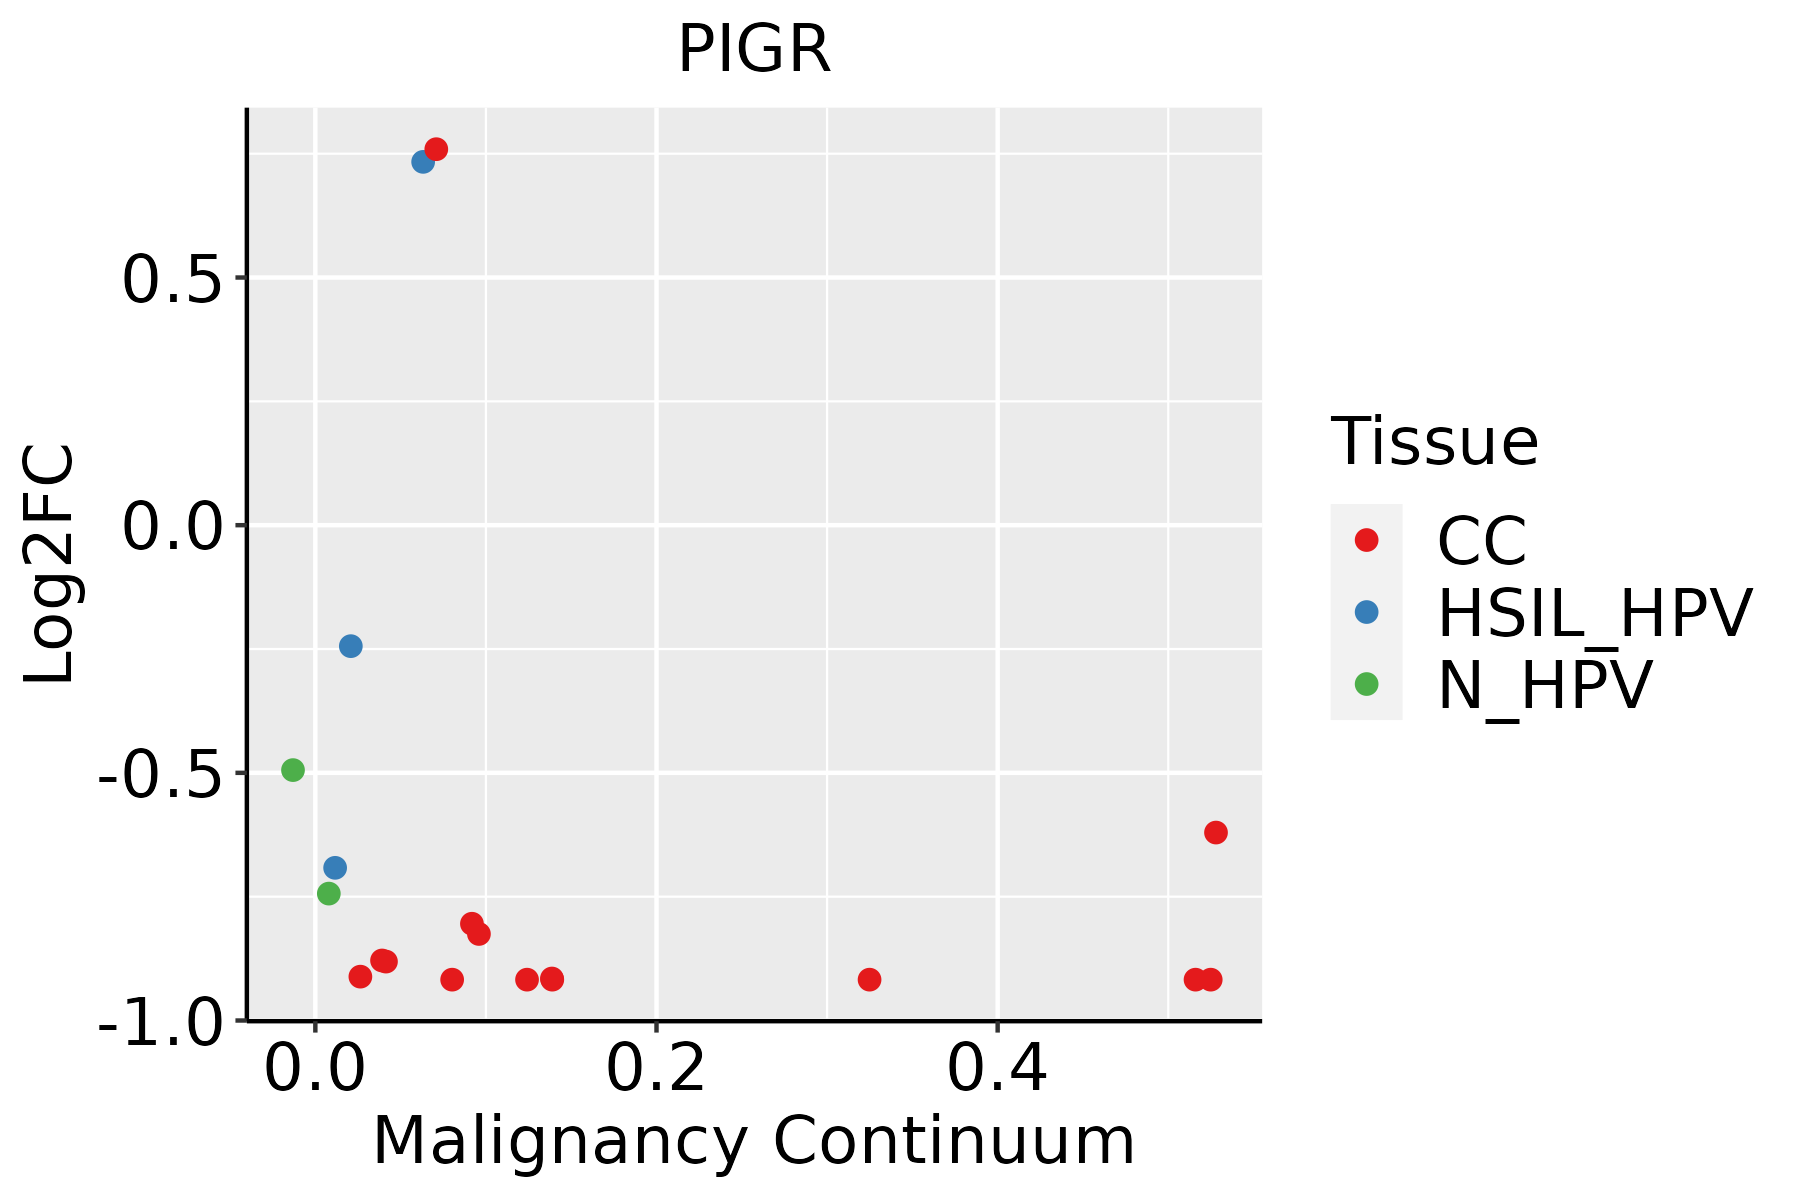 | CC: Cervix cancer |
| HSIL_HPV: HPV-infected high-grade squamous intraepithelial lesions | ||
| N_HPV: HPV-infected normal cervix | ||
| Colorectum (GSE201348) |  | FAP: Familial adenomatous polyposis |
| CRC: Colorectal cancer | ||
| Colorectum (HTA11) |  | AD: Adenomas |
| SER: Sessile serrated lesions | ||
| MSI-H: Microsatellite-high colorectal cancer | ||
| MSS: Microsatellite stable colorectal cancer | ||
| Endometrium |  | AEH: Atypical endometrial hyperplasia |
| EEC: Endometrioid Cancer | ||
| Esophagus | 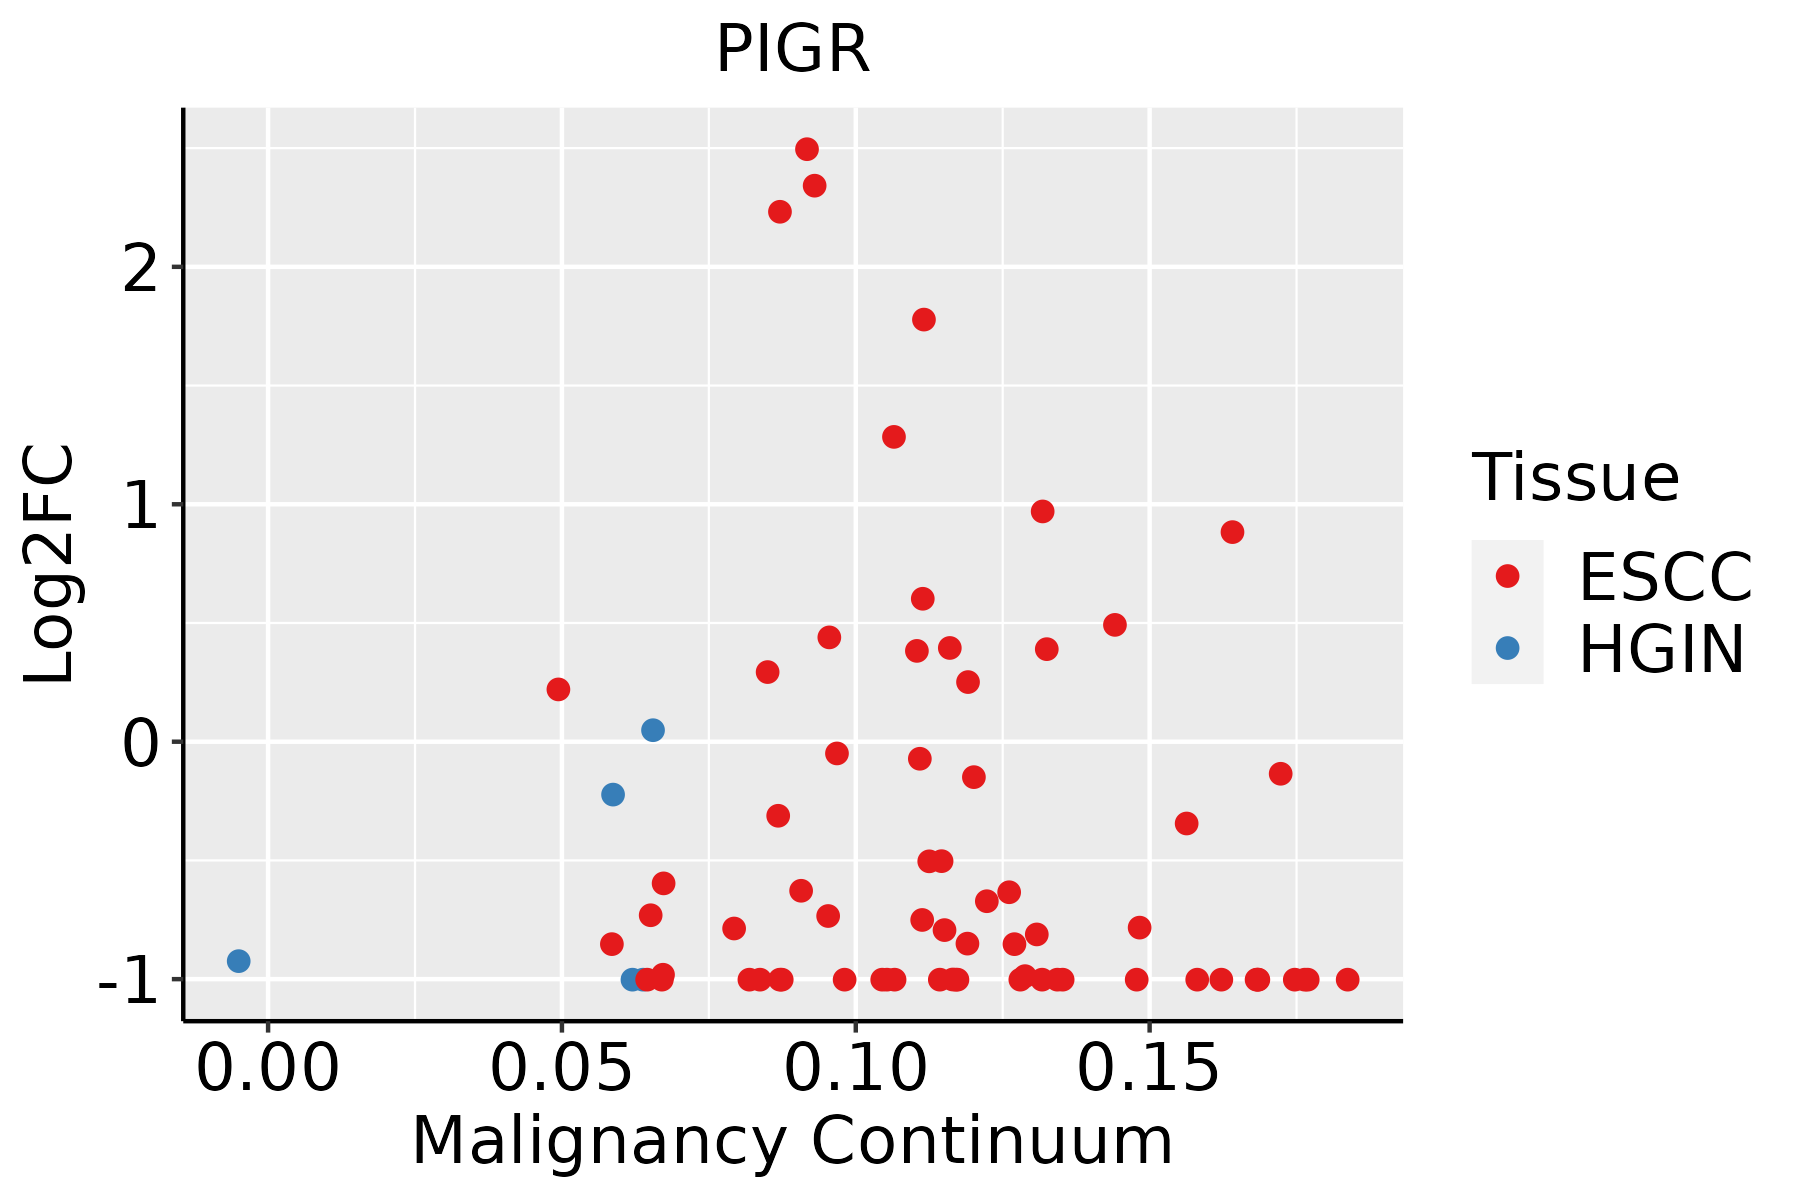 | ESCC: Esophageal squamous cell carcinoma |
| HGIN: High-grade intraepithelial neoplasias | ||
| LGIN: Low-grade intraepithelial neoplasias | ||
| GC | 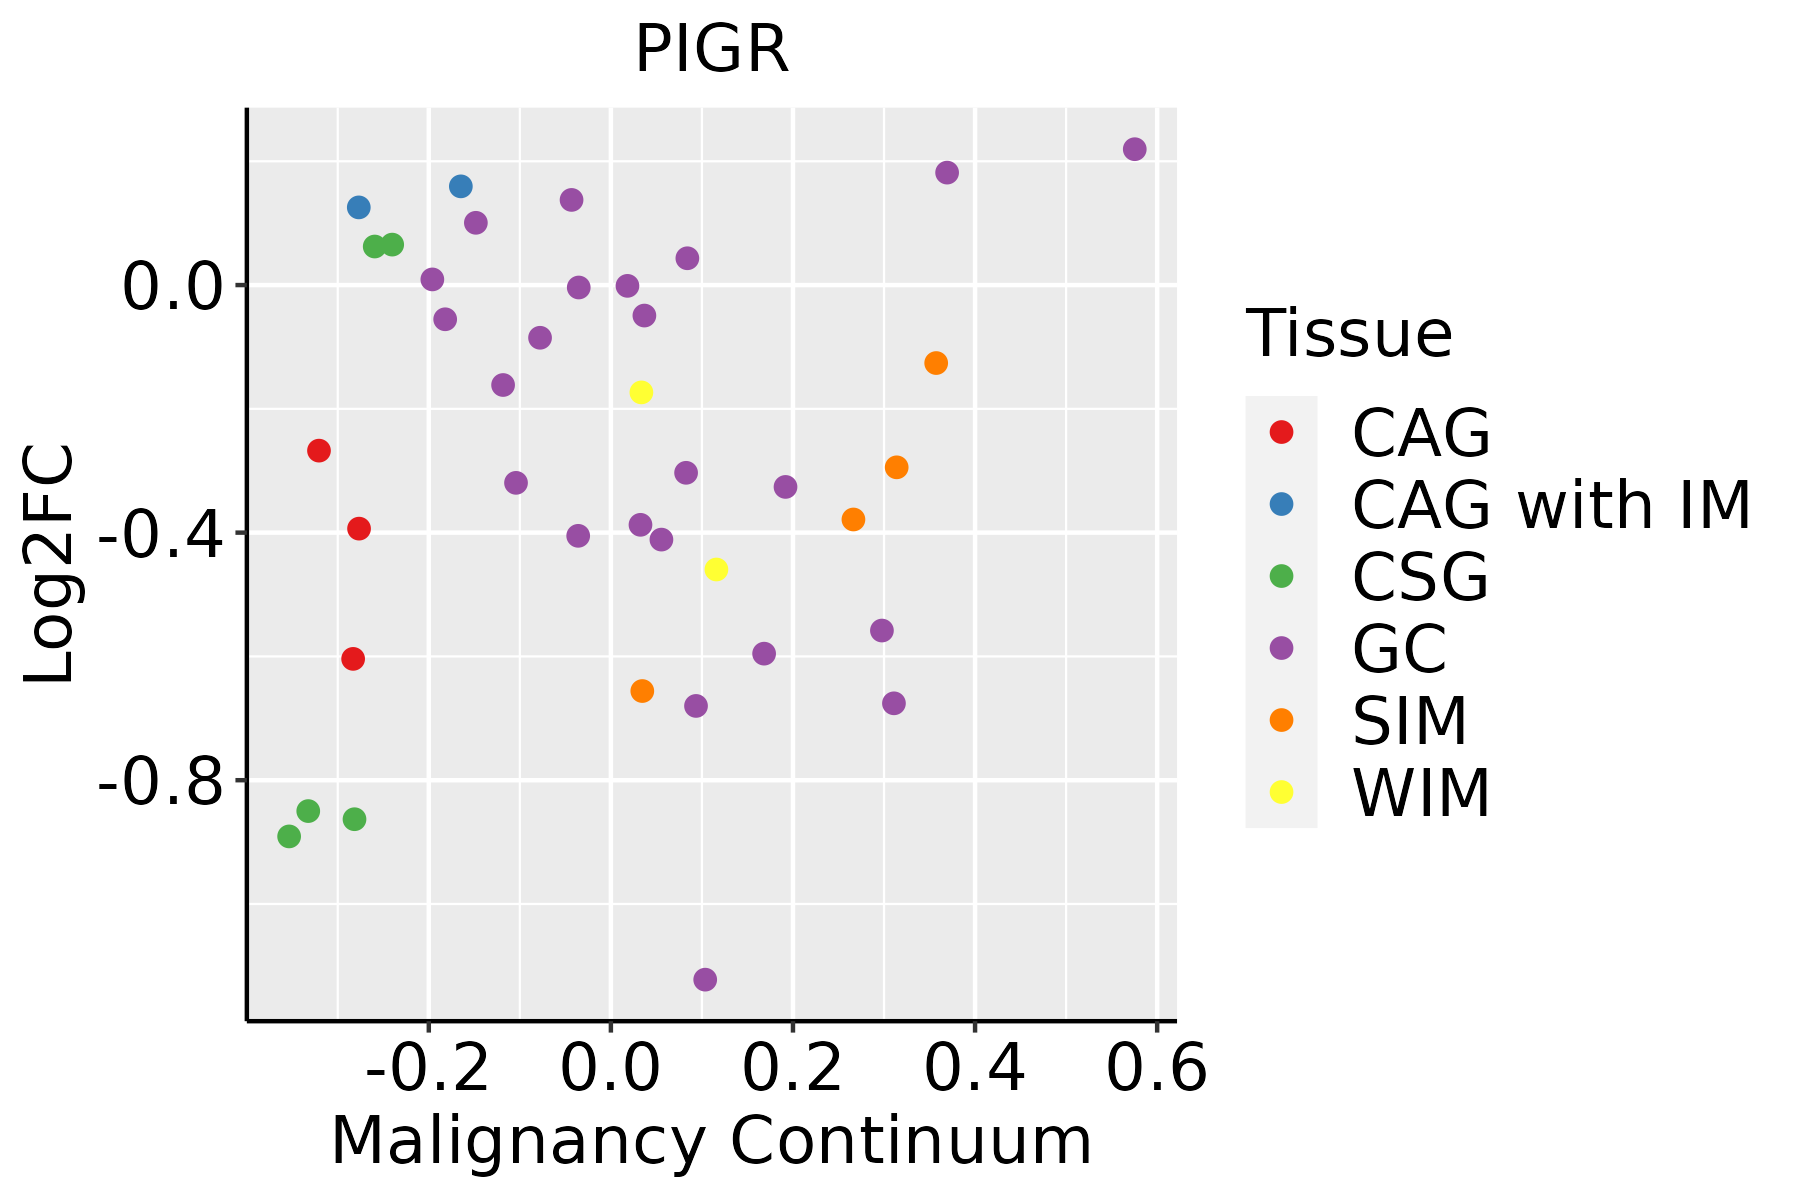 | CAG: Chronic atrophic gastritis |
| CAG with IM: Chronic atrophic gastritis with intestinal metaplasia | ||
| CSG: Chronic superficial gastritis | ||
| GC: Gastric cancer | ||
| SIM: Severe intestinal metaplasia | ||
| WIM: Wild intestinal metaplasia | ||
| Liver | 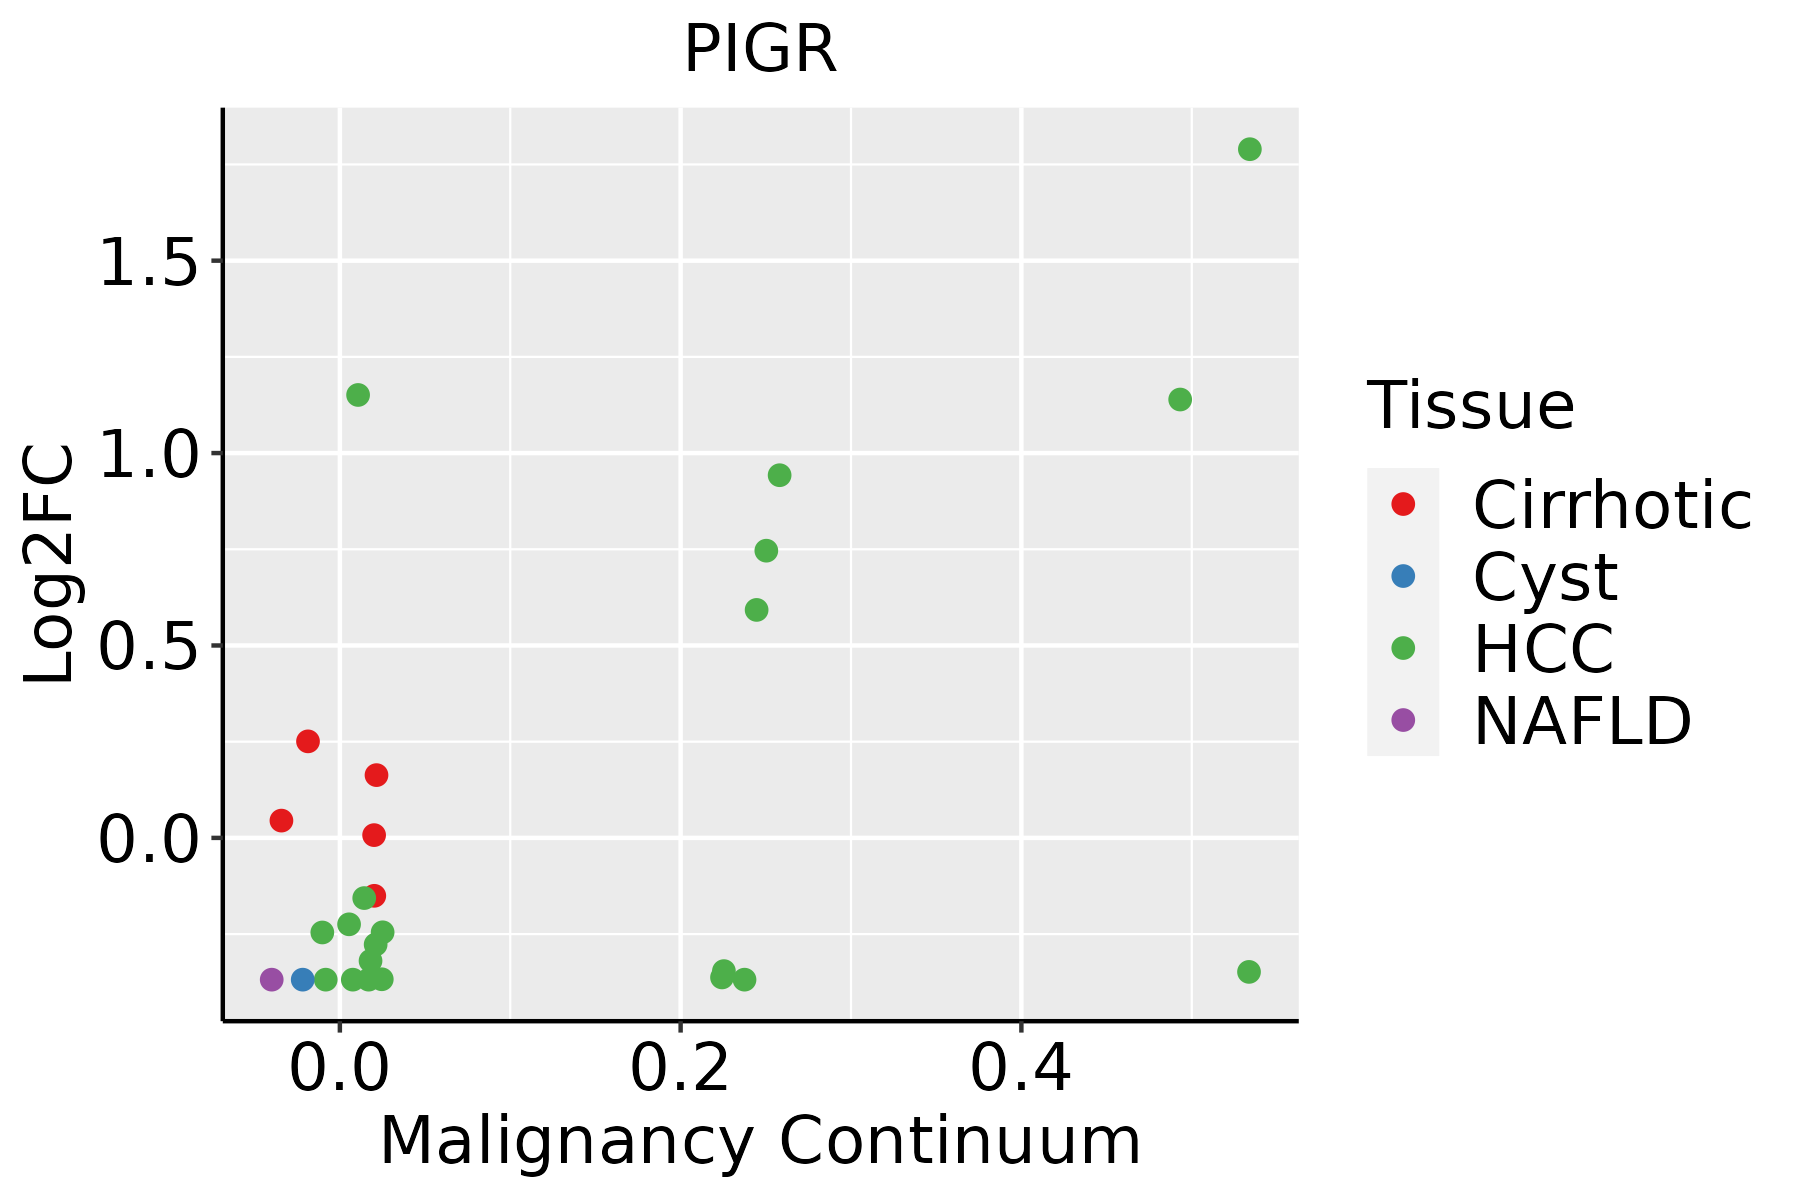 | HCC: Hepatocellular carcinoma |
| NAFLD: Non-alcoholic fatty liver disease | ||
| Lung | 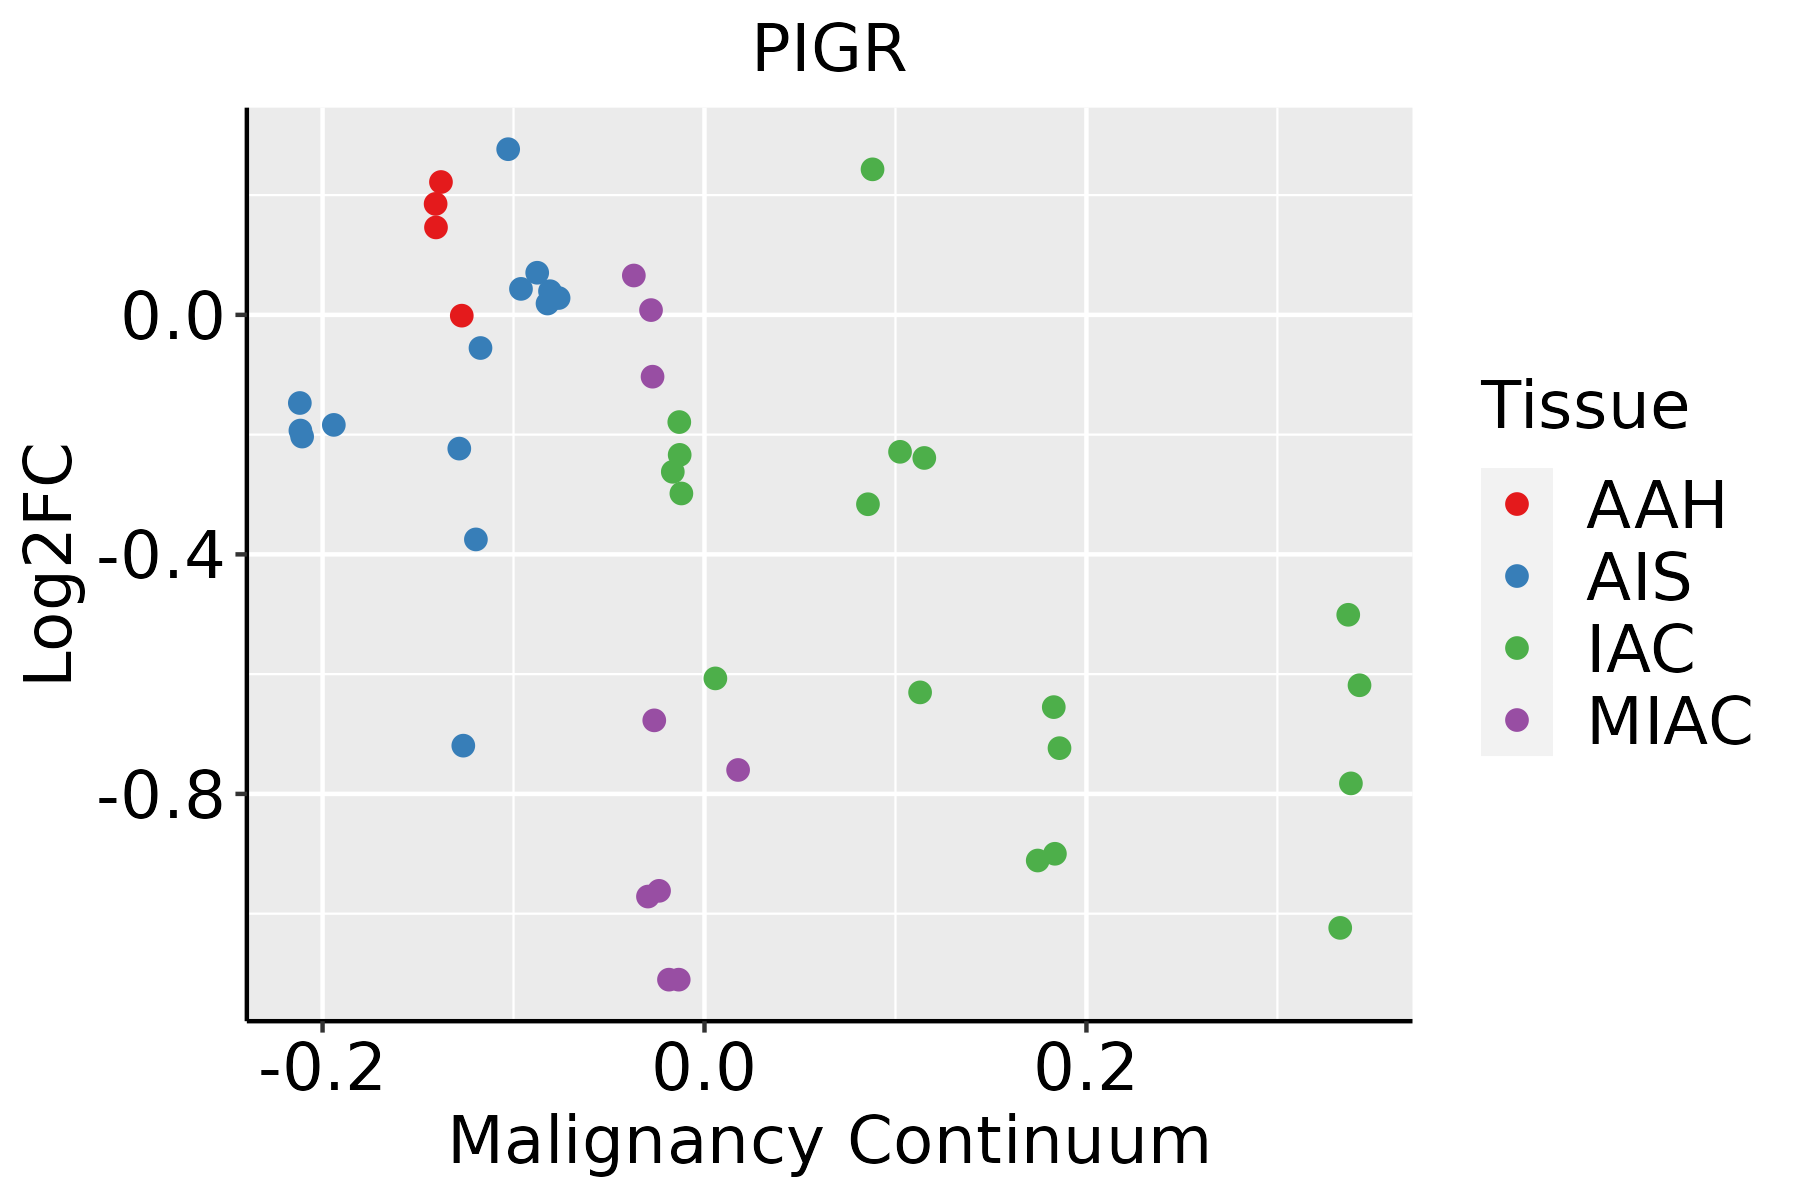 | AAH: Atypical adenomatous hyperplasia |
| AIS: Adenocarcinoma in situ | ||
| IAC: Invasive lung adenocarcinoma | ||
| MIA: Minimally invasive adenocarcinoma | ||
| Oral Cavity |  | EOLP: Erosive Oral lichen planus |
| LP: leukoplakia | ||
| NEOLP: Non-erosive oral lichen planus | ||
| OSCC: Oral squamous cell carcinoma | ||
| Prostate |  | BPH: Benign Prostatic Hyperplasia |
| ∗log2FC in expression of this searched gene in stem-like cells from each diseased tissue sample relative to stem-like cells in normal samples in each tissue plotted against the malignancy continuum. Samples are colored based on if they are from different disease stage. |
Top |
Malignant transformation related pathway analysis |
| Find out the enriched GO biological processes and KEGG pathways involved in transition from healthy to precancer to cancer |
| Tissue | Disease Stage | Enriched GO biological Processes |
| Colorectum | AD |  |
| Colorectum | SER |  |
| Colorectum | MSS |  |
| Colorectum | MSI-H |  |
| Colorectum | FAP |  |
| ∗Top 15 enriched GO BP terms are showed in the bar plot of each disease state in each tissue. Each row represents a significant GO biological process which is colored according to the -log10(p.adjust). |
| Page: 1 2 3 4 5 6 7 8 9 |
| GO ID | Tissue | Disease Stage | Description | Gene Ratio | Bg Ratio | pvalue | p.adjust | Count |
| GO:00018953 | Stomach | CAG | retina homeostasis | 8/552 | 79/18723 | 2.26e-03 | 2.50e-02 | 8 |
| GO:006024941 | Stomach | WIM | anatomical structure homeostasis | 22/426 | 314/18723 | 3.36e-06 | 1.93e-04 | 22 |
| GO:000189441 | Stomach | WIM | tissue homeostasis | 20/426 | 268/18723 | 3.64e-06 | 2.03e-04 | 20 |
| GO:00018954 | Stomach | WIM | retina homeostasis | 7/426 | 79/18723 | 2.13e-03 | 2.54e-02 | 7 |
| GO:006024951 | Stomach | SIM | anatomical structure homeostasis | 28/708 | 314/18723 | 2.52e-05 | 7.73e-04 | 28 |
| GO:000189451 | Stomach | SIM | tissue homeostasis | 25/708 | 268/18723 | 3.22e-05 | 9.44e-04 | 25 |
| GO:00018955 | Stomach | SIM | retina homeostasis | 9/708 | 79/18723 | 2.91e-03 | 2.82e-02 | 9 |
| Page: 1 2 3 4 5 6 7 |
| Pathway ID | Tissue | Disease Stage | Description | Gene Ratio | Bg Ratio | pvalue | p.adjust | qvalue | Count |
| hsa046724 | Breast | DCIS | Intestinal immune network for IgA production | 11/846 | 49/8465 | 7.79e-03 | 3.60e-02 | 2.65e-02 | 11 |
| hsa0467211 | Breast | DCIS | Intestinal immune network for IgA production | 11/846 | 49/8465 | 7.79e-03 | 3.60e-02 | 2.65e-02 | 11 |
| hsa046725 | Cervix | HSIL_HPV | Intestinal immune network for IgA production | 10/459 | 49/8465 | 2.42e-04 | 2.53e-03 | 2.05e-03 | 10 |
| hsa0467212 | Cervix | HSIL_HPV | Intestinal immune network for IgA production | 10/459 | 49/8465 | 2.42e-04 | 2.53e-03 | 2.05e-03 | 10 |
| hsa0467221 | Cervix | N_HPV | Intestinal immune network for IgA production | 7/349 | 49/8465 | 3.68e-03 | 2.04e-02 | 1.60e-02 | 7 |
| hsa0467231 | Cervix | N_HPV | Intestinal immune network for IgA production | 7/349 | 49/8465 | 3.68e-03 | 2.04e-02 | 1.60e-02 | 7 |
| hsa04672 | Stomach | GC | Intestinal immune network for IgA production | 10/708 | 49/8465 | 6.45e-03 | 3.50e-02 | 2.46e-02 | 10 |
| hsa046721 | Stomach | GC | Intestinal immune network for IgA production | 10/708 | 49/8465 | 6.45e-03 | 3.50e-02 | 2.46e-02 | 10 |
| Page: 1 |
Top |
Cell-cell communication analysis |
| Identification of potential cell-cell interactions between two cell types and their ligand-receptor pairs for different disease states |
| Ligand | Receptor | LRpair | Pathway | Tissue | Disease Stage |
| Page: 1 |
Top |
Single-cell gene regulatory network inference analysis |
| Find out the significant the regulons (TFs) and the target genes of each regulon across cell types for different disease states |
| TF | Cell Type | Tissue | Disease Stage | Target Gene | RSS | Regulon Activity |
| ∗The dot plots of a searched regulon are shown for all cell subpopulations in each disease state of each tissue based on the regulon specific score inferred using pySCENIC and by calculating the average expression. |
| Page: 1 |
Top |
Somatic mutation of malignant transformation related genes |
| Annotation of somatic variants for genes involved in malignant transformation |
| Hugo Symbol | Variant Class | Variant Classification | dbSNP RS | HGVSc | HGVSp | HGVSp Short | SWISSPROT | BIOTYPE | SIFT | PolyPhen | Tumor Sample Barcode | Tissue | Histology | Sex | Age | Stage | Therapy Types | Drugs | Outcome |
| PIGR | SNV | Missense_Mutation | novel | c.860G>A | p.Gly287Glu | p.G287E | P01833 | protein_coding | deleterious(0.02) | probably_damaging(1) | TCGA-A2-A3XT-01 | Breast | breast invasive carcinoma | Female | <65 | I/II | Chemotherapy | cyclophosphamide | PR |
| PIGR | SNV | Missense_Mutation | c.655N>G | p.Leu219Val | p.L219V | P01833 | protein_coding | tolerated(1) | benign(0.001) | TCGA-A8-A092-01 | Breast | breast invasive carcinoma | Female | <65 | III/IV | Chemotherapy | paclitaxel | CR | |
| PIGR | SNV | Missense_Mutation | c.116N>A | p.Thr39Lys | p.T39K | P01833 | protein_coding | tolerated(1) | benign(0.009) | TCGA-A8-A0AD-01 | Breast | breast invasive carcinoma | Female | >=65 | I/II | Hormone Therapy | tamoxiphen | SD | |
| PIGR | SNV | Missense_Mutation | novel | c.2233G>A | p.Asp745Asn | p.D745N | P01833 | protein_coding | tolerated(0.05) | benign(0.105) | TCGA-AN-A046-01 | Breast | breast invasive carcinoma | Female | >=65 | I/II | Unknown | Unknown | SD |
| PIGR | SNV | Missense_Mutation | novel | c.1324N>A | p.Leu442Met | p.L442M | P01833 | protein_coding | tolerated(0.3) | probably_damaging(0.988) | TCGA-AO-A03T-01 | Breast | breast invasive carcinoma | Female | <65 | I/II | Chemotherapy | cyclophosphamide | SD |
| PIGR | SNV | Missense_Mutation | c.2201N>T | p.Ser734Leu | p.S734L | P01833 | protein_coding | deleterious(0) | probably_damaging(0.996) | TCGA-C8-A12Q-01 | Breast | breast invasive carcinoma | Female | >=65 | III/IV | Unknown | Unknown | PD | |
| PIGR | SNV | Missense_Mutation | rs775192099 | c.2059G>A | p.Glu687Lys | p.E687K | P01833 | protein_coding | tolerated(0.09) | benign(0.063) | TCGA-D8-A1J9-01 | Breast | breast invasive carcinoma | Female | <65 | I/II | Unknown | Unknown | SD |
| PIGR | SNV | Missense_Mutation | c.137N>T | p.Ser46Phe | p.S46F | P01833 | protein_coding | deleterious(0) | probably_damaging(0.999) | TCGA-D8-A27G-01 | Breast | breast invasive carcinoma | Female | >=65 | I/II | Unknown | Unknown | SD | |
| PIGR | SNV | Missense_Mutation | rs767466182 | c.1747N>C | p.Asp583His | p.D583H | P01833 | protein_coding | tolerated(0.11) | benign(0.178) | TCGA-E2-A1IN-01 | Breast | breast invasive carcinoma | Female | <65 | I/II | Hormone Therapy | arimidex | SD |
| PIGR | SNV | Missense_Mutation | c.2176N>G | p.Lys726Glu | p.K726E | P01833 | protein_coding | tolerated(1) | benign(0) | TCGA-E2-A1LS-01 | Breast | breast invasive carcinoma | Female | <65 | I/II | Unspecific | Cyclophosphamide | SD |
| Page: 1 2 3 4 5 6 7 8 9 10 |
Top |
Related drugs of malignant transformation related genes |
| Identification of chemicals and drugs interact with genes involved in malignant transfromation |
| (DGIdb 4.0) |
| Entrez ID | Symbol | Category | Interaction Types | Drug Claim Name | Drug Name | PMIDs |
| Page: 1 |

Copyright 2023-Present -The University of Texas Health Science Center at Houston |