
|
|||||
|
 | |
| |
| |
| |
| |
| |
|
Gene: PEX2 |
Gene summary for PEX2 |
| Gene information | Species | Human | Gene symbol | PEX2 | Gene ID | 5828 |
| Gene name | peroxisomal biogenesis factor 2 | |
| Gene Alias | PAF1 | |
| Cytomap | 8q21.13 | |
| Gene Type | protein-coding | GO ID | GO:0000038 | UniProtAcc | P28328 |
Top |
Malignant transformation analysis |
| Identification of the aberrant gene expression in precancerous and cancerous lesions by comparing the gene expression of stem-like cells in diseased tissues with normal stem cells |
| Entrez ID | Symbol | Replicates | Species | Organ | Tissue | Adj P-value | Log2FC | Malignancy |
| 5828 | PEX2 | LZE2T | Human | Esophagus | ESCC | 4.61e-03 | 2.53e-01 | 0.082 |
| 5828 | PEX2 | LZE4T | Human | Esophagus | ESCC | 7.23e-18 | 3.89e-01 | 0.0811 |
| 5828 | PEX2 | LZE5T | Human | Esophagus | ESCC | 1.29e-04 | 1.71e-01 | 0.0514 |
| 5828 | PEX2 | LZE7T | Human | Esophagus | ESCC | 1.88e-07 | 3.21e-01 | 0.0667 |
| 5828 | PEX2 | LZE8T | Human | Esophagus | ESCC | 1.55e-14 | 3.24e-01 | 0.067 |
| 5828 | PEX2 | LZE20T | Human | Esophagus | ESCC | 8.05e-16 | 4.67e-01 | 0.0662 |
| 5828 | PEX2 | LZE22T | Human | Esophagus | ESCC | 9.95e-03 | 1.71e-01 | 0.068 |
| 5828 | PEX2 | LZE24T | Human | Esophagus | ESCC | 8.40e-23 | 6.74e-01 | 0.0596 |
| 5828 | PEX2 | LZE6T | Human | Esophagus | ESCC | 2.54e-04 | 1.41e-01 | 0.0845 |
| 5828 | PEX2 | P1T-E | Human | Esophagus | ESCC | 7.98e-05 | 4.46e-01 | 0.0875 |
| 5828 | PEX2 | P2T-E | Human | Esophagus | ESCC | 6.95e-34 | 5.09e-01 | 0.1177 |
| 5828 | PEX2 | P4T-E | Human | Esophagus | ESCC | 2.01e-38 | 7.15e-01 | 0.1323 |
| 5828 | PEX2 | P5T-E | Human | Esophagus | ESCC | 5.91e-16 | 2.97e-01 | 0.1327 |
| 5828 | PEX2 | P8T-E | Human | Esophagus | ESCC | 9.60e-30 | 4.80e-01 | 0.0889 |
| 5828 | PEX2 | P9T-E | Human | Esophagus | ESCC | 2.68e-17 | 3.20e-01 | 0.1131 |
| 5828 | PEX2 | P10T-E | Human | Esophagus | ESCC | 8.76e-42 | 7.08e-01 | 0.116 |
| 5828 | PEX2 | P11T-E | Human | Esophagus | ESCC | 2.04e-14 | 5.64e-01 | 0.1426 |
| 5828 | PEX2 | P12T-E | Human | Esophagus | ESCC | 1.08e-40 | 7.40e-01 | 0.1122 |
| 5828 | PEX2 | P15T-E | Human | Esophagus | ESCC | 4.42e-21 | 4.39e-01 | 0.1149 |
| 5828 | PEX2 | P16T-E | Human | Esophagus | ESCC | 6.01e-40 | 7.47e-01 | 0.1153 |
| Page: 1 2 3 4 5 6 |
| Tissue | Expression Dynamics | Abbreviation |
| Esophagus | 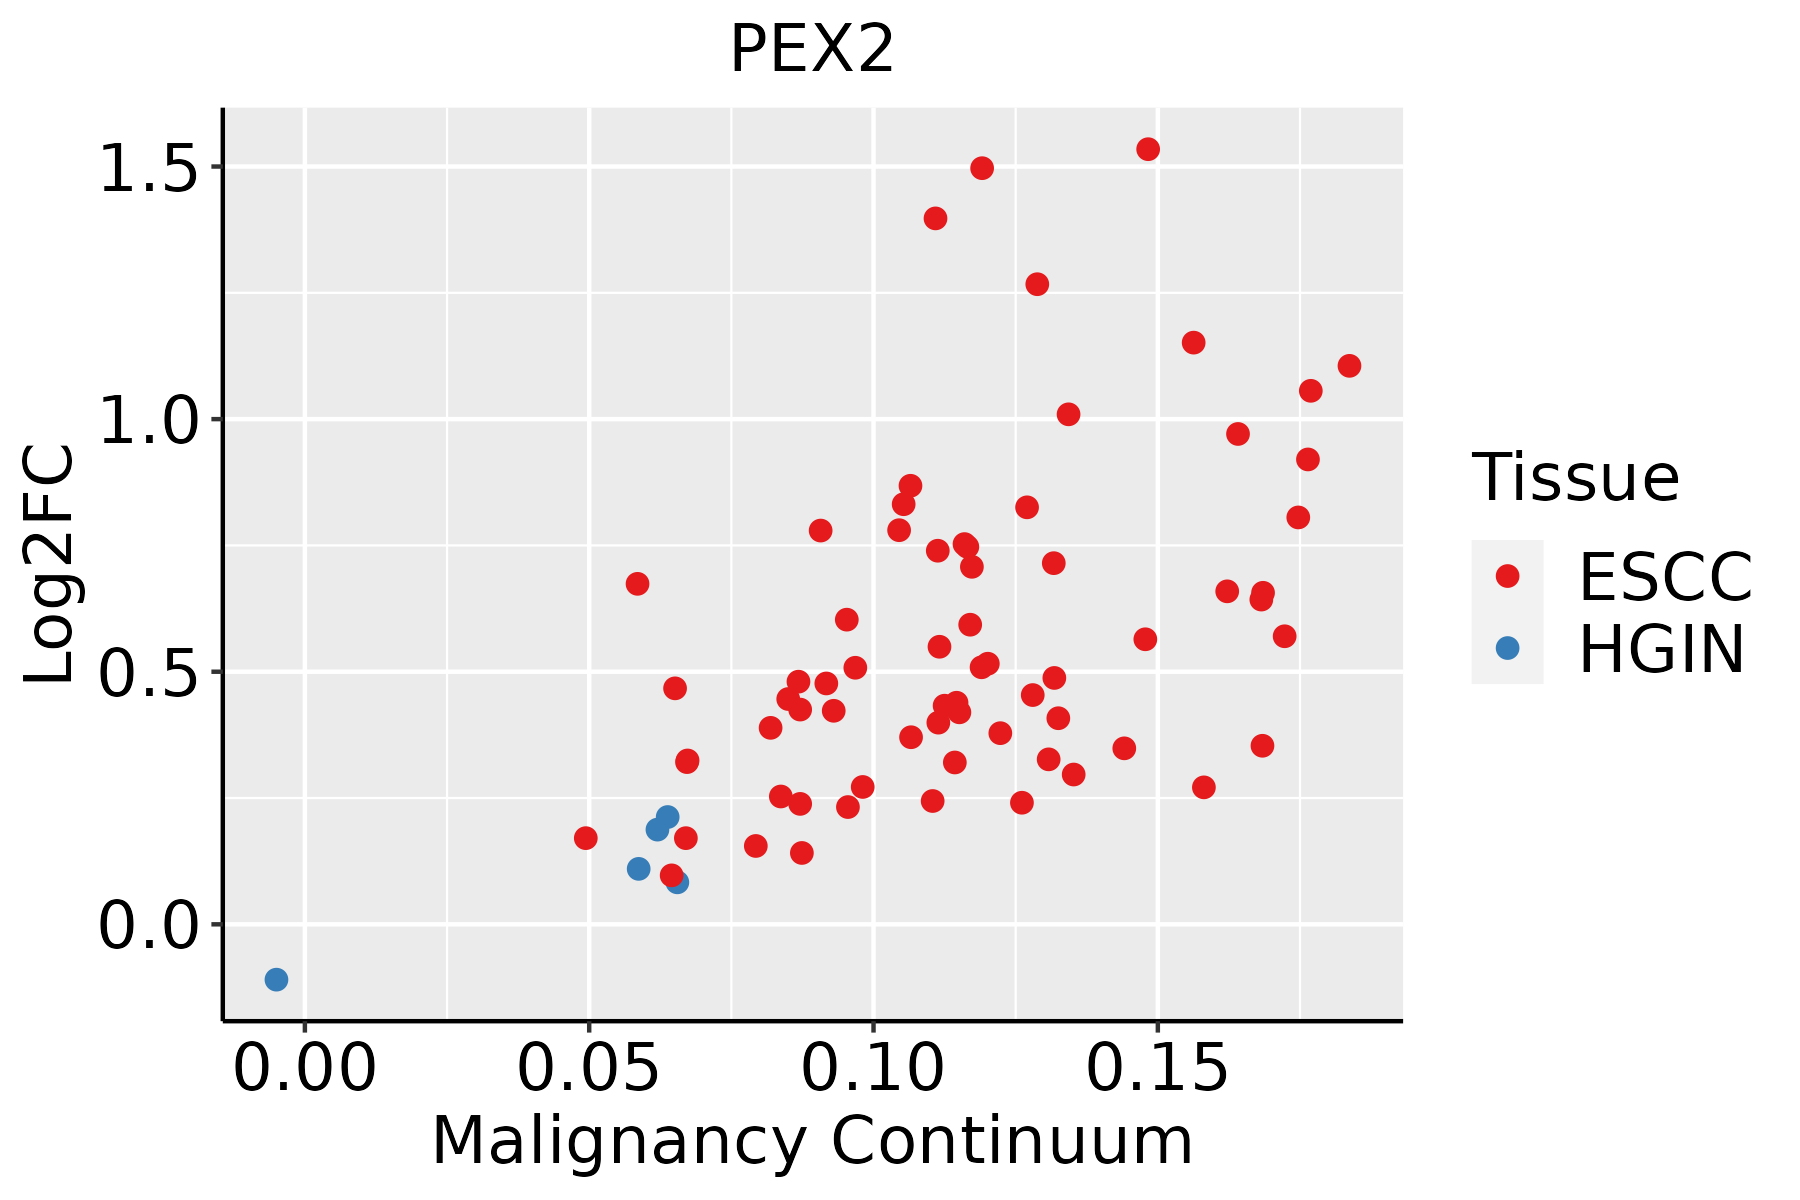 | ESCC: Esophageal squamous cell carcinoma |
| HGIN: High-grade intraepithelial neoplasias | ||
| LGIN: Low-grade intraepithelial neoplasias | ||
| Liver | 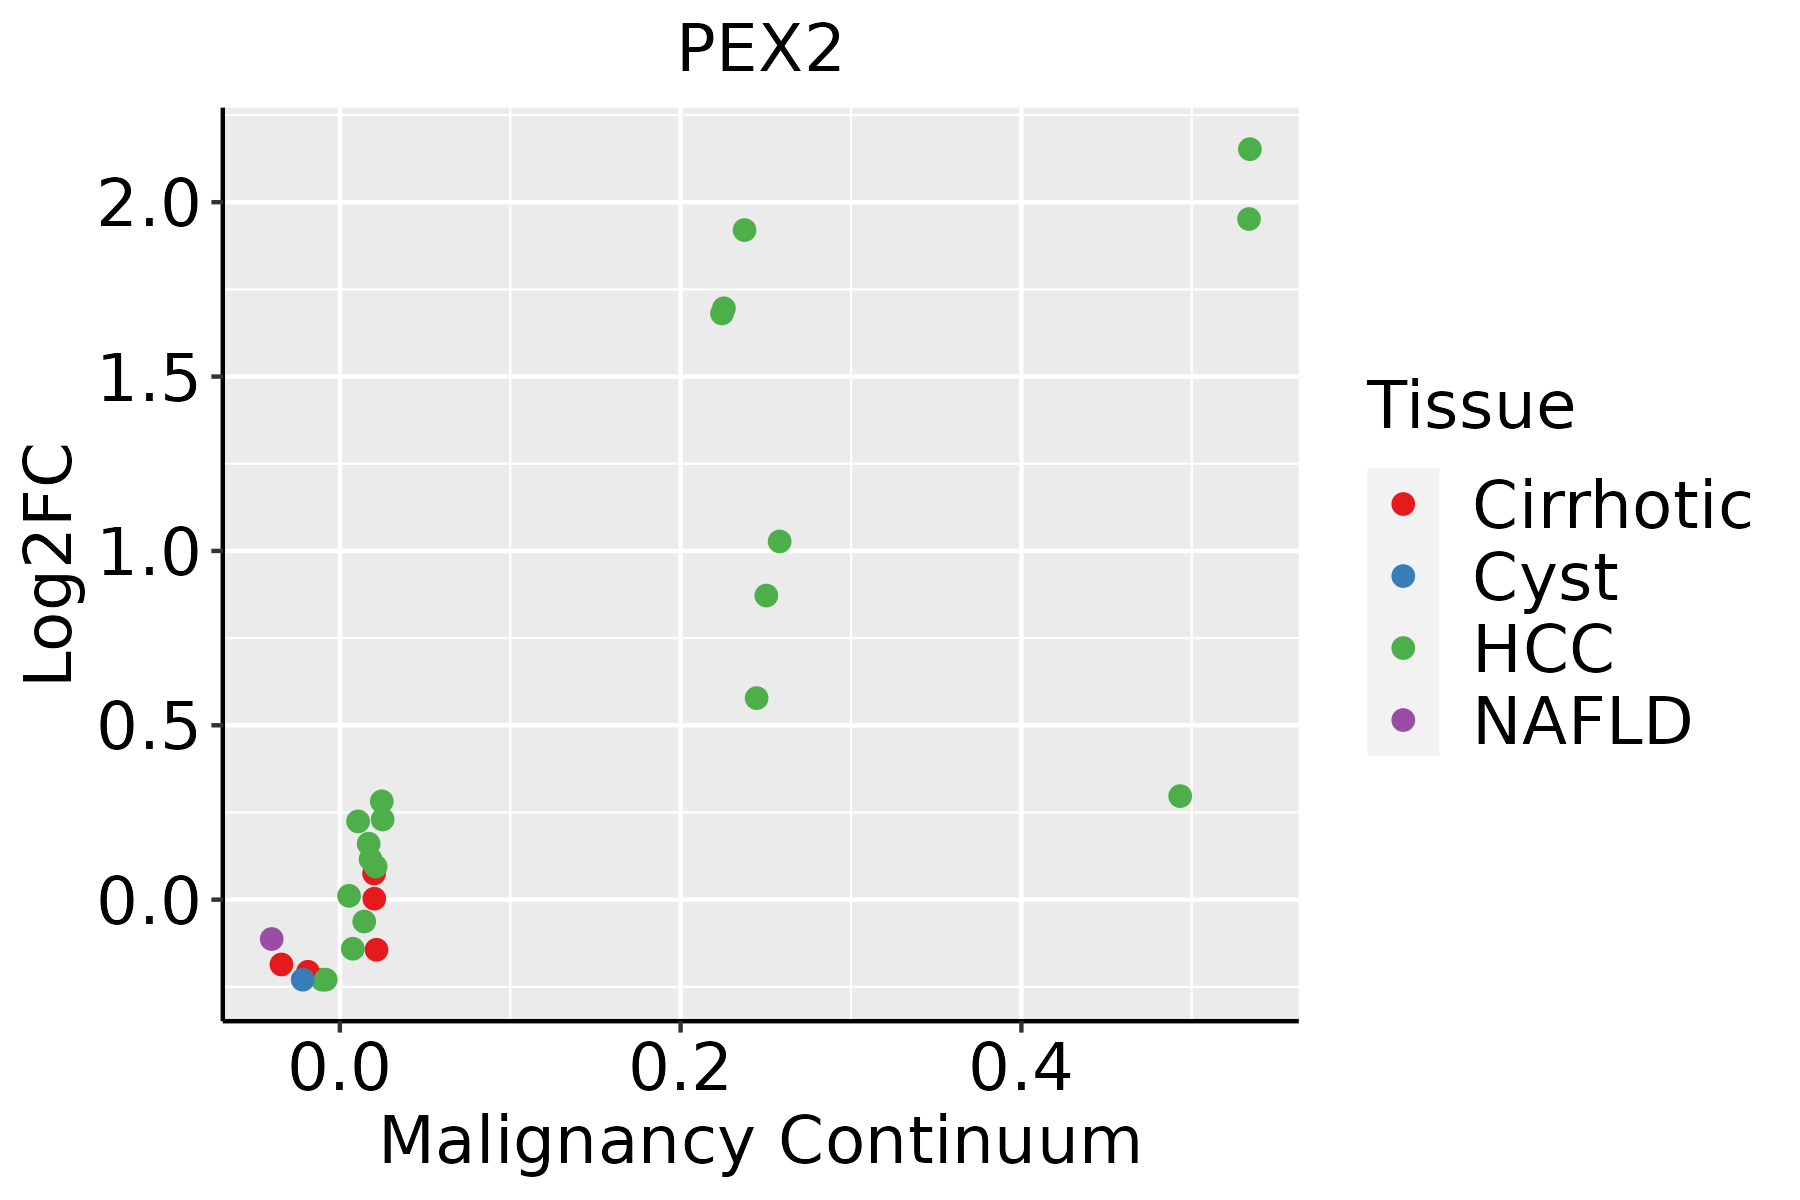 | HCC: Hepatocellular carcinoma |
| NAFLD: Non-alcoholic fatty liver disease | ||
| Oral Cavity | 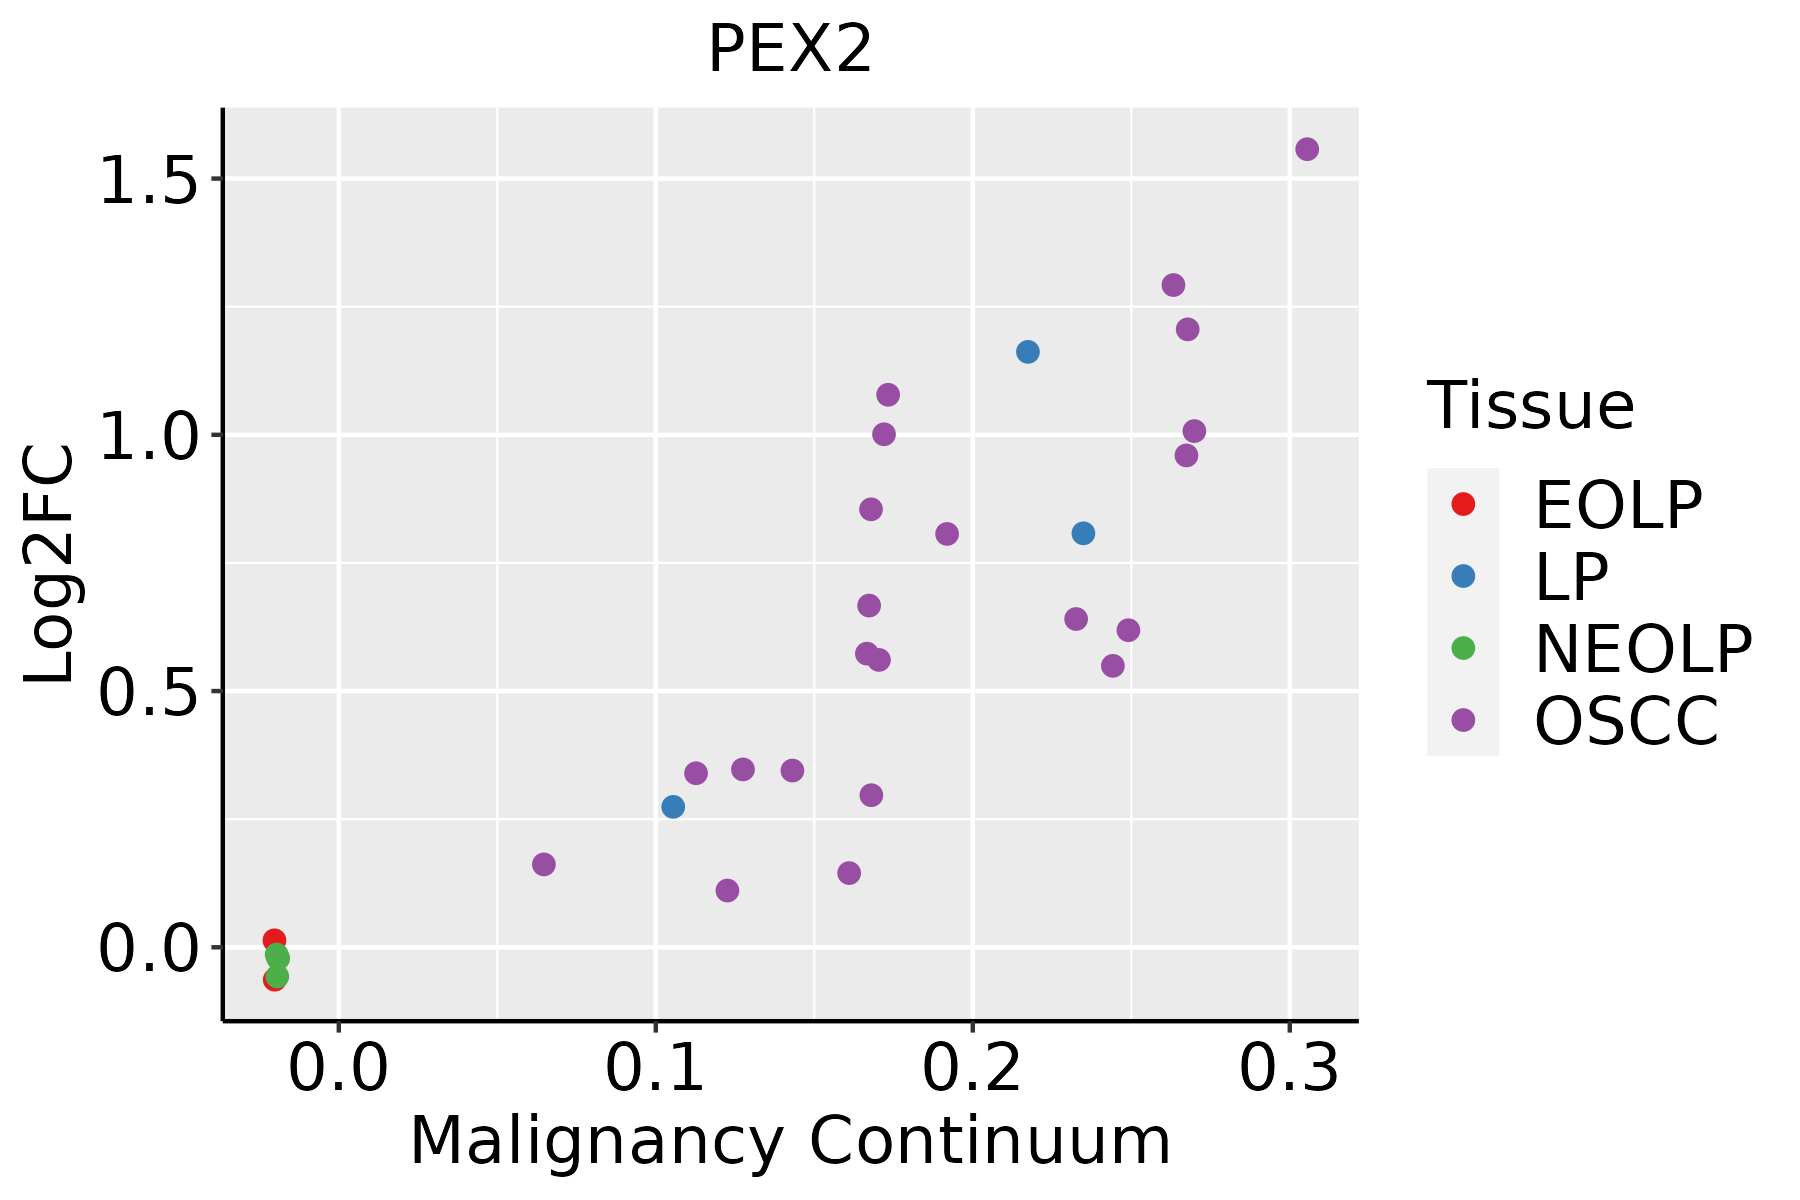 | EOLP: Erosive Oral lichen planus |
| LP: leukoplakia | ||
| NEOLP: Non-erosive oral lichen planus | ||
| OSCC: Oral squamous cell carcinoma | ||
| Skin | 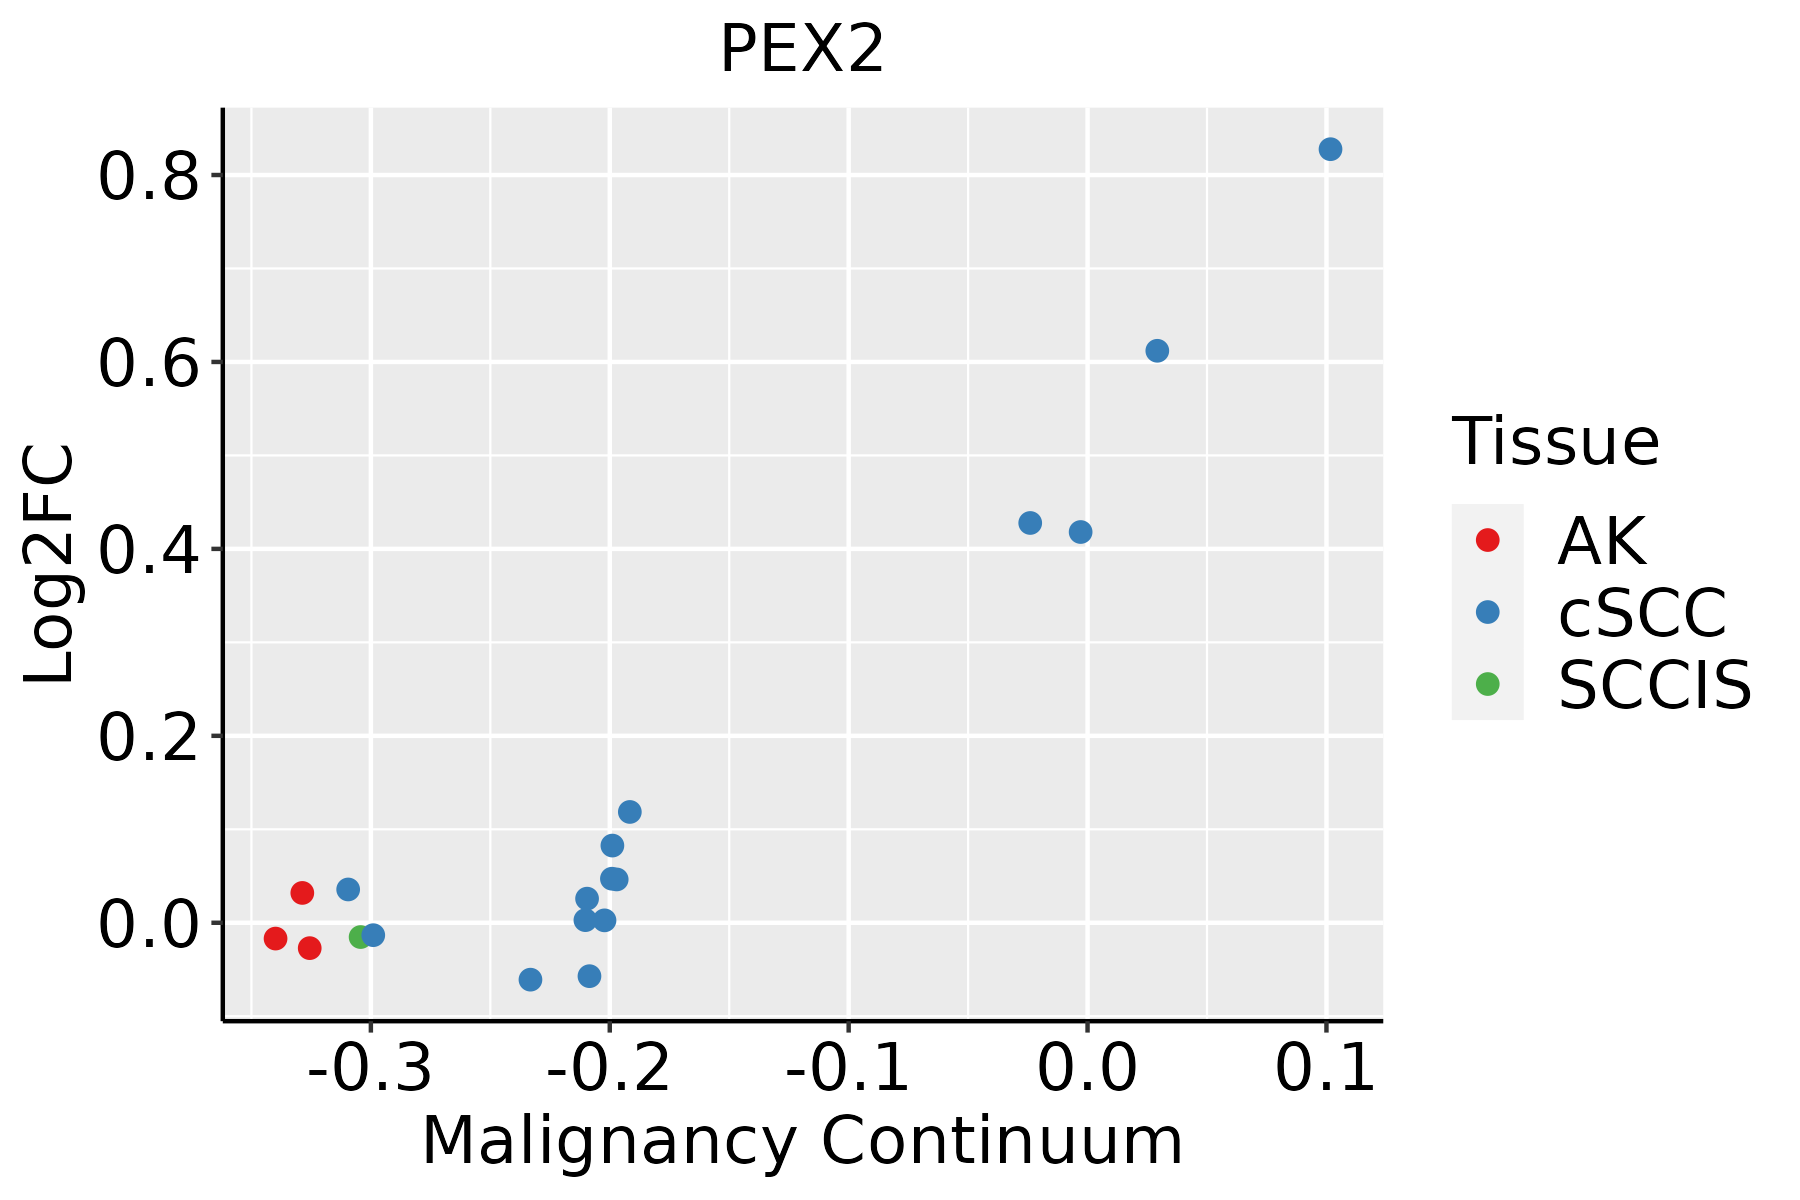 | AK: Actinic keratosis |
| cSCC: Cutaneous squamous cell carcinoma | ||
| SCCIS:squamous cell carcinoma in situ | ||
| Thyroid | 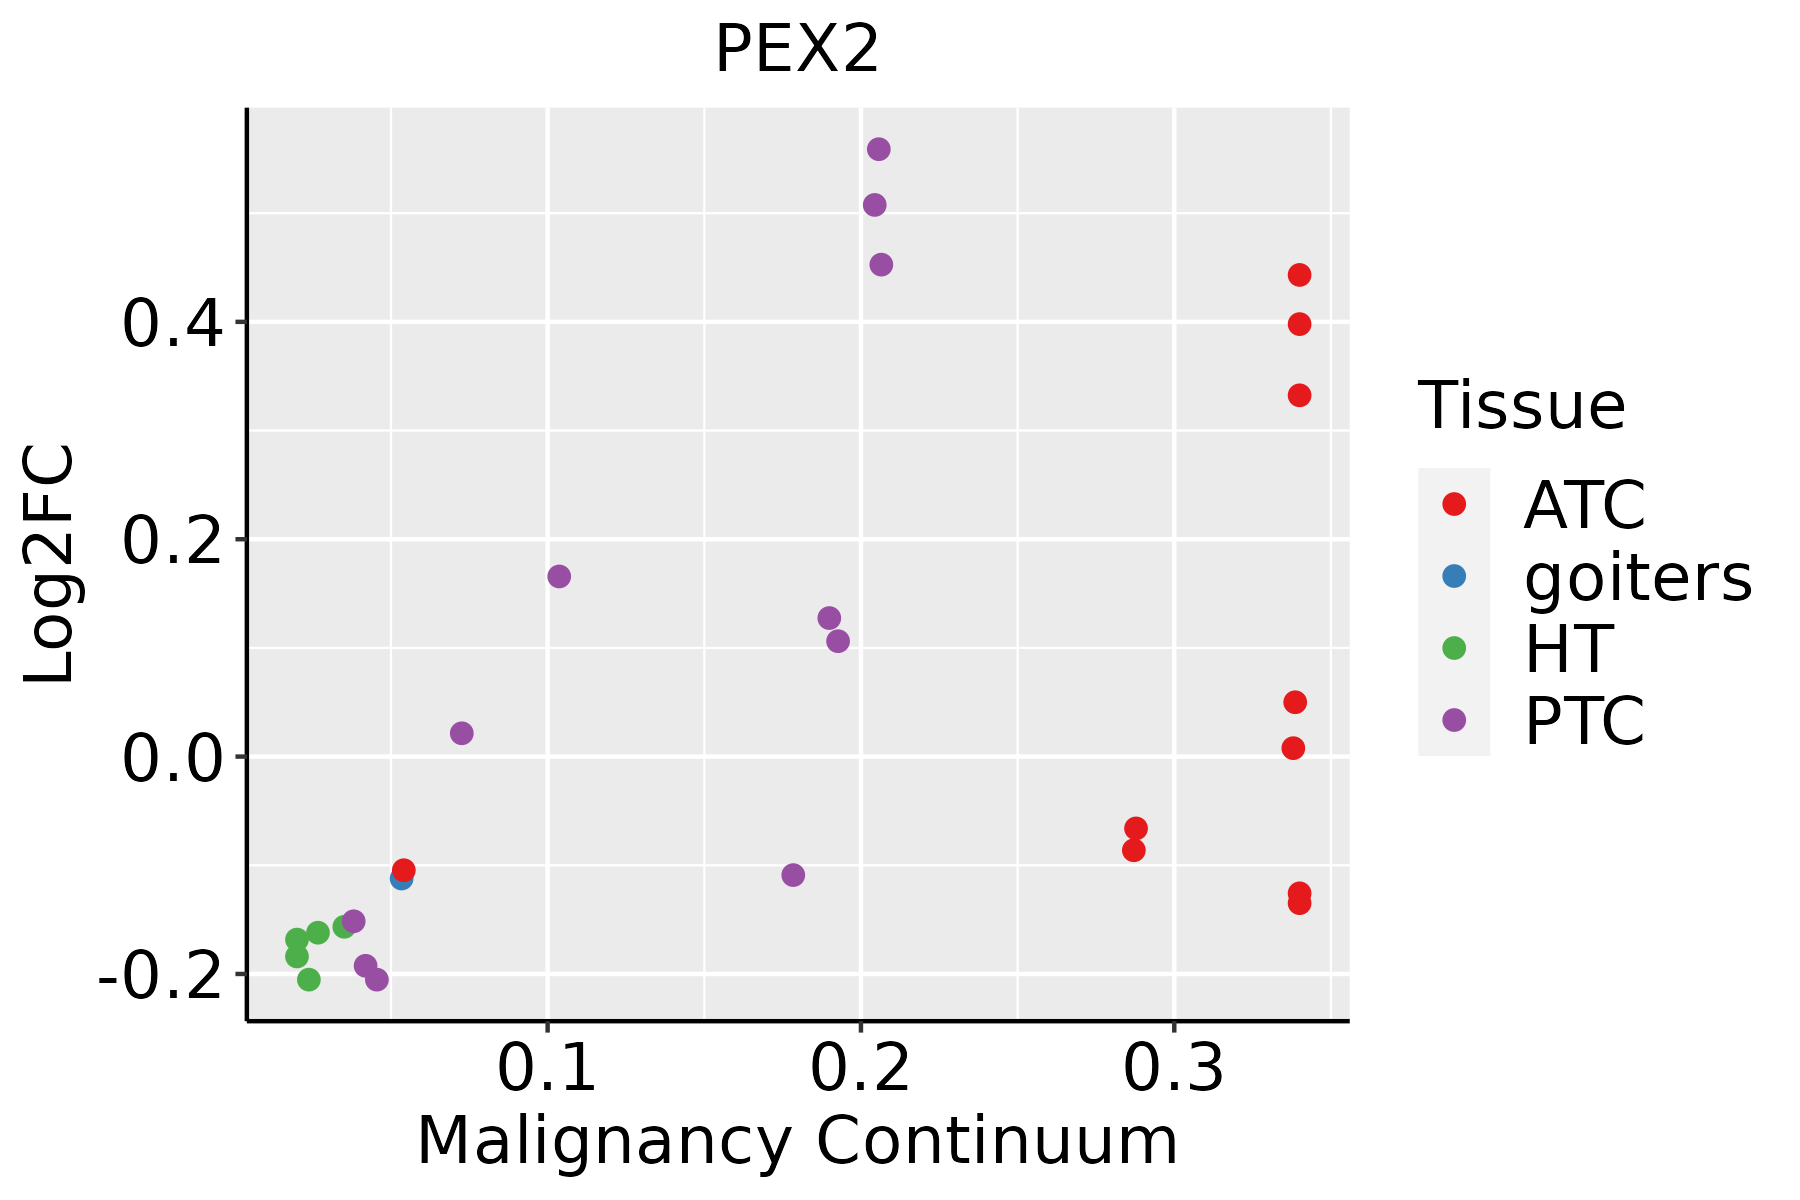 | ATC: Anaplastic thyroid cancer |
| HT: Hashimoto's thyroiditis | ||
| PTC: Papillary thyroid cancer |
| ∗log2FC in expression of this searched gene in stem-like cells from each diseased tissue sample relative to stem-like cells in normal samples in each tissue plotted against the malignancy continuum. Samples are colored based on if they are from different disease stage. |
Top |
Malignant transformation related pathway analysis |
| Find out the enriched GO biological processes and KEGG pathways involved in transition from healthy to precancer to cancer |
| Tissue | Disease Stage | Enriched GO biological Processes |
| Colorectum | AD |  |
| Colorectum | SER |  |
| Colorectum | MSS |  |
| Colorectum | MSI-H |  |
| Colorectum | FAP |  |
| ∗Top 15 enriched GO BP terms are showed in the bar plot of each disease state in each tissue. Each row represents a significant GO biological process which is colored according to the -log10(p.adjust). |
| Page: 1 2 3 4 5 6 7 8 9 |
| GO ID | Tissue | Disease Stage | Description | Gene Ratio | Bg Ratio | pvalue | p.adjust | Count |
| GO:0043574 | Oral cavity | OSCC | peroxisomal transport | 16/7305 | 22/18723 | 1.40e-03 | 6.79e-03 | 16 |
| GO:00066357 | Oral cavity | OSCC | fatty acid beta-oxidation | 42/7305 | 74/18723 | 1.47e-03 | 7.09e-03 | 42 |
| GO:00070312 | Oral cavity | OSCC | peroxisome organization | 23/7305 | 36/18723 | 2.19e-03 | 9.95e-03 | 23 |
| GO:00442826 | Oral cavity | OSCC | small molecule catabolic process | 174/7305 | 376/18723 | 2.25e-03 | 1.00e-02 | 174 |
| GO:00442426 | Oral cavity | OSCC | cellular lipid catabolic process | 104/7305 | 214/18723 | 2.61e-03 | 1.15e-02 | 104 |
| GO:0015919 | Oral cavity | OSCC | peroxisomal membrane transport | 14/7305 | 20/18723 | 4.95e-03 | 1.94e-02 | 14 |
| GO:007259419 | Oral cavity | LP | establishment of protein localization to organelle | 205/4623 | 422/18723 | 6.76e-27 | 3.85e-24 | 205 |
| GO:0006605110 | Oral cavity | LP | protein targeting | 156/4623 | 314/18723 | 5.43e-22 | 1.62e-19 | 156 |
| GO:009015019 | Oral cavity | LP | establishment of protein localization to membrane | 128/4623 | 260/18723 | 7.19e-18 | 1.19e-15 | 128 |
| GO:0031647110 | Oral cavity | LP | regulation of protein stability | 132/4623 | 298/18723 | 8.16e-14 | 7.99e-12 | 132 |
| GO:001703816 | Oral cavity | LP | protein import | 95/4623 | 206/18723 | 1.55e-11 | 1.13e-09 | 95 |
| GO:007180615 | Oral cavity | LP | protein transmembrane transport | 36/4623 | 59/18723 | 3.37e-09 | 1.44e-07 | 36 |
| GO:006500213 | Oral cavity | LP | intracellular protein transmembrane transport | 31/4623 | 51/18723 | 4.70e-08 | 1.64e-06 | 31 |
| GO:000661211 | Oral cavity | LP | protein targeting to membrane | 60/4623 | 131/18723 | 1.10e-07 | 3.59e-06 | 60 |
| GO:004474311 | Oral cavity | LP | protein transmembrane import into intracellular organelle | 22/4623 | 36/18723 | 3.76e-06 | 7.90e-05 | 22 |
| GO:004814413 | Oral cavity | LP | fibroblast proliferation | 32/4623 | 81/18723 | 2.24e-03 | 1.62e-02 | 32 |
| GO:00070311 | Oral cavity | LP | peroxisome organization | 17/4623 | 36/18723 | 2.74e-03 | 1.92e-02 | 17 |
| GO:004814513 | Oral cavity | LP | regulation of fibroblast proliferation | 31/4623 | 80/18723 | 3.69e-03 | 2.44e-02 | 31 |
| GO:004424213 | Oral cavity | LP | cellular lipid catabolic process | 70/4623 | 214/18723 | 4.82e-03 | 3.05e-02 | 70 |
| GO:00066251 | Oral cavity | LP | protein targeting to peroxisome | 10/4623 | 18/18723 | 4.91e-03 | 3.06e-02 | 10 |
| Page: 1 2 3 4 5 6 7 8 9 |
| Pathway ID | Tissue | Disease Stage | Description | Gene Ratio | Bg Ratio | pvalue | p.adjust | qvalue | Count |
| hsa041467 | Esophagus | ESCC | Peroxisome | 55/4205 | 82/8465 | 1.04e-03 | 3.27e-03 | 1.68e-03 | 55 |
| hsa0414612 | Esophagus | ESCC | Peroxisome | 55/4205 | 82/8465 | 1.04e-03 | 3.27e-03 | 1.68e-03 | 55 |
| hsa041462 | Liver | Cirrhotic | Peroxisome | 36/2530 | 82/8465 | 4.79e-03 | 1.74e-02 | 1.07e-02 | 36 |
| hsa041463 | Liver | Cirrhotic | Peroxisome | 36/2530 | 82/8465 | 4.79e-03 | 1.74e-02 | 1.07e-02 | 36 |
| hsa041464 | Liver | HCC | Peroxisome | 58/4020 | 82/8465 | 1.57e-05 | 1.05e-04 | 5.85e-05 | 58 |
| hsa041465 | Liver | HCC | Peroxisome | 58/4020 | 82/8465 | 1.57e-05 | 1.05e-04 | 5.85e-05 | 58 |
| hsa041466 | Oral cavity | OSCC | Peroxisome | 47/3704 | 82/8465 | 9.01e-03 | 2.01e-02 | 1.03e-02 | 47 |
| hsa0414611 | Oral cavity | OSCC | Peroxisome | 47/3704 | 82/8465 | 9.01e-03 | 2.01e-02 | 1.03e-02 | 47 |
| hsa0414621 | Oral cavity | LP | Peroxisome | 33/2418 | 82/8465 | 1.48e-02 | 4.69e-02 | 3.03e-02 | 33 |
| hsa0414631 | Oral cavity | LP | Peroxisome | 33/2418 | 82/8465 | 1.48e-02 | 4.69e-02 | 3.03e-02 | 33 |
| Page: 1 |
Top |
Cell-cell communication analysis |
| Identification of potential cell-cell interactions between two cell types and their ligand-receptor pairs for different disease states |
| Ligand | Receptor | LRpair | Pathway | Tissue | Disease Stage |
| Page: 1 |
Top |
Single-cell gene regulatory network inference analysis |
| Find out the significant the regulons (TFs) and the target genes of each regulon across cell types for different disease states |
| TF | Cell Type | Tissue | Disease Stage | Target Gene | RSS | Regulon Activity |
| ∗The dot plots of a searched regulon are shown for all cell subpopulations in each disease state of each tissue based on the regulon specific score inferred using pySCENIC and by calculating the average expression. |
| Page: 1 |
Top |
Somatic mutation of malignant transformation related genes |
| Annotation of somatic variants for genes involved in malignant transformation |
| Hugo Symbol | Variant Class | Variant Classification | dbSNP RS | HGVSc | HGVSp | HGVSp Short | SWISSPROT | BIOTYPE | SIFT | PolyPhen | Tumor Sample Barcode | Tissue | Histology | Sex | Age | Stage | Therapy Types | Drugs | Outcome |
| PEX2 | SNV | Missense_Mutation | rs564144139 | c.506N>A | p.Arg169His | p.R169H | P28328 | protein_coding | deleterious(0) | probably_damaging(1) | TCGA-A7-A13F-01 | Breast | breast invasive carcinoma | Female | <65 | III/IV | Chemotherapy | doxorubicin | SD |
| PEX2 | SNV | Missense_Mutation | c.904N>A | p.Val302Ile | p.V302I | P28328 | protein_coding | tolerated_low_confidence(0.22) | benign(0.084) | TCGA-AO-A0JF-01 | Breast | breast invasive carcinoma | Female | >=65 | I/II | Chemotherapy | doxorubicin | SD | |
| PEX2 | SNV | Missense_Mutation | c.220G>T | p.Ala74Ser | p.A74S | P28328 | protein_coding | tolerated(0.13) | probably_damaging(0.976) | TCGA-AA-3660-01 | Colorectum | colon adenocarcinoma | Female | <65 | I/II | Unknown | Unknown | SD | |
| PEX2 | SNV | Missense_Mutation | rs747866716 | c.205N>G | p.Ile69Val | p.I69V | P28328 | protein_coding | tolerated(0.92) | benign(0.007) | TCGA-AY-6197-01 | Colorectum | colon adenocarcinoma | Male | <65 | I/II | Unknown | Unknown | SD |
| PEX2 | SNV | Missense_Mutation | rs199845625 | c.374N>A | p.Arg125Gln | p.R125Q | P28328 | protein_coding | tolerated(0.52) | benign(0.167) | TCGA-AZ-4315-01 | Colorectum | colon adenocarcinoma | Male | <65 | I/II | Unknown | Unknown | SD |
| PEX2 | SNV | Missense_Mutation | novel | c.460N>G | p.Phe154Val | p.F154V | P28328 | protein_coding | deleterious(0.01) | probably_damaging(0.994) | TCGA-CA-6717-01 | Colorectum | colon adenocarcinoma | Male | <65 | I/II | Chemotherapy | oxaliplatin | CR |
| PEX2 | SNV | Missense_Mutation | c.589N>C | p.Trp197Arg | p.W197R | P28328 | protein_coding | deleterious(0) | probably_damaging(1) | TCGA-CM-6171-01 | Colorectum | colon adenocarcinoma | Female | >=65 | I/II | Unknown | Unknown | SD | |
| PEX2 | SNV | Missense_Mutation | rs544763390 | c.892G>A | p.Glu298Lys | p.E298K | P28328 | protein_coding | deleterious_low_confidence(0.01) | possibly_damaging(0.557) | TCGA-D5-6540-01 | Colorectum | colon adenocarcinoma | Male | >=65 | I/II | Unknown | Unknown | SD |
| PEX2 | SNV | Missense_Mutation | c.126N>A | p.His42Gln | p.H42Q | P28328 | protein_coding | tolerated(1) | benign(0.01) | TCGA-EI-6513-01 | Colorectum | rectum adenocarcinoma | Male | <65 | III/IV | Unknown | Unknown | SD | |
| PEX2 | deletion | Frame_Shift_Del | c.268delT | p.Ser90ProfsTer4 | p.S90Pfs*4 | P28328 | protein_coding | TCGA-A6-5661-01 | Colorectum | colon adenocarcinoma | Female | >=65 | I/II | Unknown | Unknown | SD |
| Page: 1 2 3 4 5 6 |
Top |
Related drugs of malignant transformation related genes |
| Identification of chemicals and drugs interact with genes involved in malignant transfromation |
| (DGIdb 4.0) |
| Entrez ID | Symbol | Category | Interaction Types | Drug Claim Name | Drug Name | PMIDs |
| Page: 1 |

Copyright 2023-Present -The University of Texas Health Science Center at Houston |