
|
|||||
|
 | |
| |
| |
| |
| |
| |
|
Gene: NR2F2 |
Gene summary for NR2F2 |
| Gene information | Species | Human | Gene symbol | NR2F2 | Gene ID | 7026 |
| Gene name | nuclear receptor subfamily 2 group F member 2 | |
| Gene Alias | ARP-1 | |
| Cytomap | 15q26.2 | |
| Gene Type | protein-coding | GO ID | GO:0000003 | UniProtAcc | P24468 |
Top |
Malignant transformation analysis |
| Identification of the aberrant gene expression in precancerous and cancerous lesions by comparing the gene expression of stem-like cells in diseased tissues with normal stem cells |
| Entrez ID | Symbol | Replicates | Species | Organ | Tissue | Adj P-value | Log2FC | Malignancy |
| 7026 | NR2F2 | GSM4909282 | Human | Breast | IDC | 1.05e-09 | 3.49e-01 | -0.0288 |
| 7026 | NR2F2 | GSM4909286 | Human | Breast | IDC | 2.83e-04 | 1.74e-01 | 0.1081 |
| 7026 | NR2F2 | GSM4909291 | Human | Breast | IDC | 3.11e-11 | 5.62e-01 | 0.1753 |
| 7026 | NR2F2 | GSM4909293 | Human | Breast | IDC | 1.73e-33 | 6.41e-01 | 0.1581 |
| 7026 | NR2F2 | GSM4909308 | Human | Breast | IDC | 8.63e-06 | 3.36e-01 | 0.158 |
| 7026 | NR2F2 | GSM4909311 | Human | Breast | IDC | 3.94e-03 | -3.93e-02 | 0.1534 |
| 7026 | NR2F2 | GSM4909317 | Human | Breast | IDC | 1.88e-03 | 3.23e-01 | 0.1355 |
| 7026 | NR2F2 | GSM4909319 | Human | Breast | IDC | 5.01e-06 | -1.55e-01 | 0.1563 |
| 7026 | NR2F2 | brca10 | Human | Breast | Precancer | 1.37e-02 | -9.38e-02 | -0.0029 |
| 7026 | NR2F2 | M2 | Human | Breast | IDC | 3.09e-02 | 1.40e-01 | 0.21 |
| 7026 | NR2F2 | M5 | Human | Breast | IDC | 3.92e-11 | 8.81e-01 | 0.1598 |
| 7026 | NR2F2 | NCCBC14 | Human | Breast | DCIS | 1.11e-04 | 2.92e-01 | 0.2021 |
| 7026 | NR2F2 | NCCBC5 | Human | Breast | DCIS | 2.29e-05 | 4.96e-02 | 0.2046 |
| 7026 | NR2F2 | P1 | Human | Breast | IDC | 2.59e-02 | -5.21e-02 | 0.1527 |
| 7026 | NR2F2 | P3 | Human | Breast | IDC | 5.07e-03 | 5.13e-01 | 0.1542 |
| 7026 | NR2F2 | DCIS2 | Human | Breast | DCIS | 3.44e-09 | 6.72e-02 | 0.0085 |
| 7026 | NR2F2 | HTA11_347_2000001011 | Human | Colorectum | AD | 1.15e-16 | 4.66e-01 | -0.1954 |
| 7026 | NR2F2 | HTA11_696_2000001011 | Human | Colorectum | AD | 2.14e-05 | 3.00e-01 | -0.1464 |
| 7026 | NR2F2 | HTA11_866_2000001011 | Human | Colorectum | AD | 2.60e-02 | 2.29e-01 | -0.1001 |
| 7026 | NR2F2 | HTA11_1391_2000001011 | Human | Colorectum | AD | 7.06e-03 | 2.37e-01 | -0.059 |
| Page: 1 2 3 4 5 6 7 |
| Tissue | Expression Dynamics | Abbreviation |
| Breast |  | IDC: Invasive ductal carcinoma |
| DCIS: Ductal carcinoma in situ | ||
| Precancer(BRCA1-mut): Precancerous lesion from BRCA1 mutation carriers | ||
| Colorectum (GSE201348) | 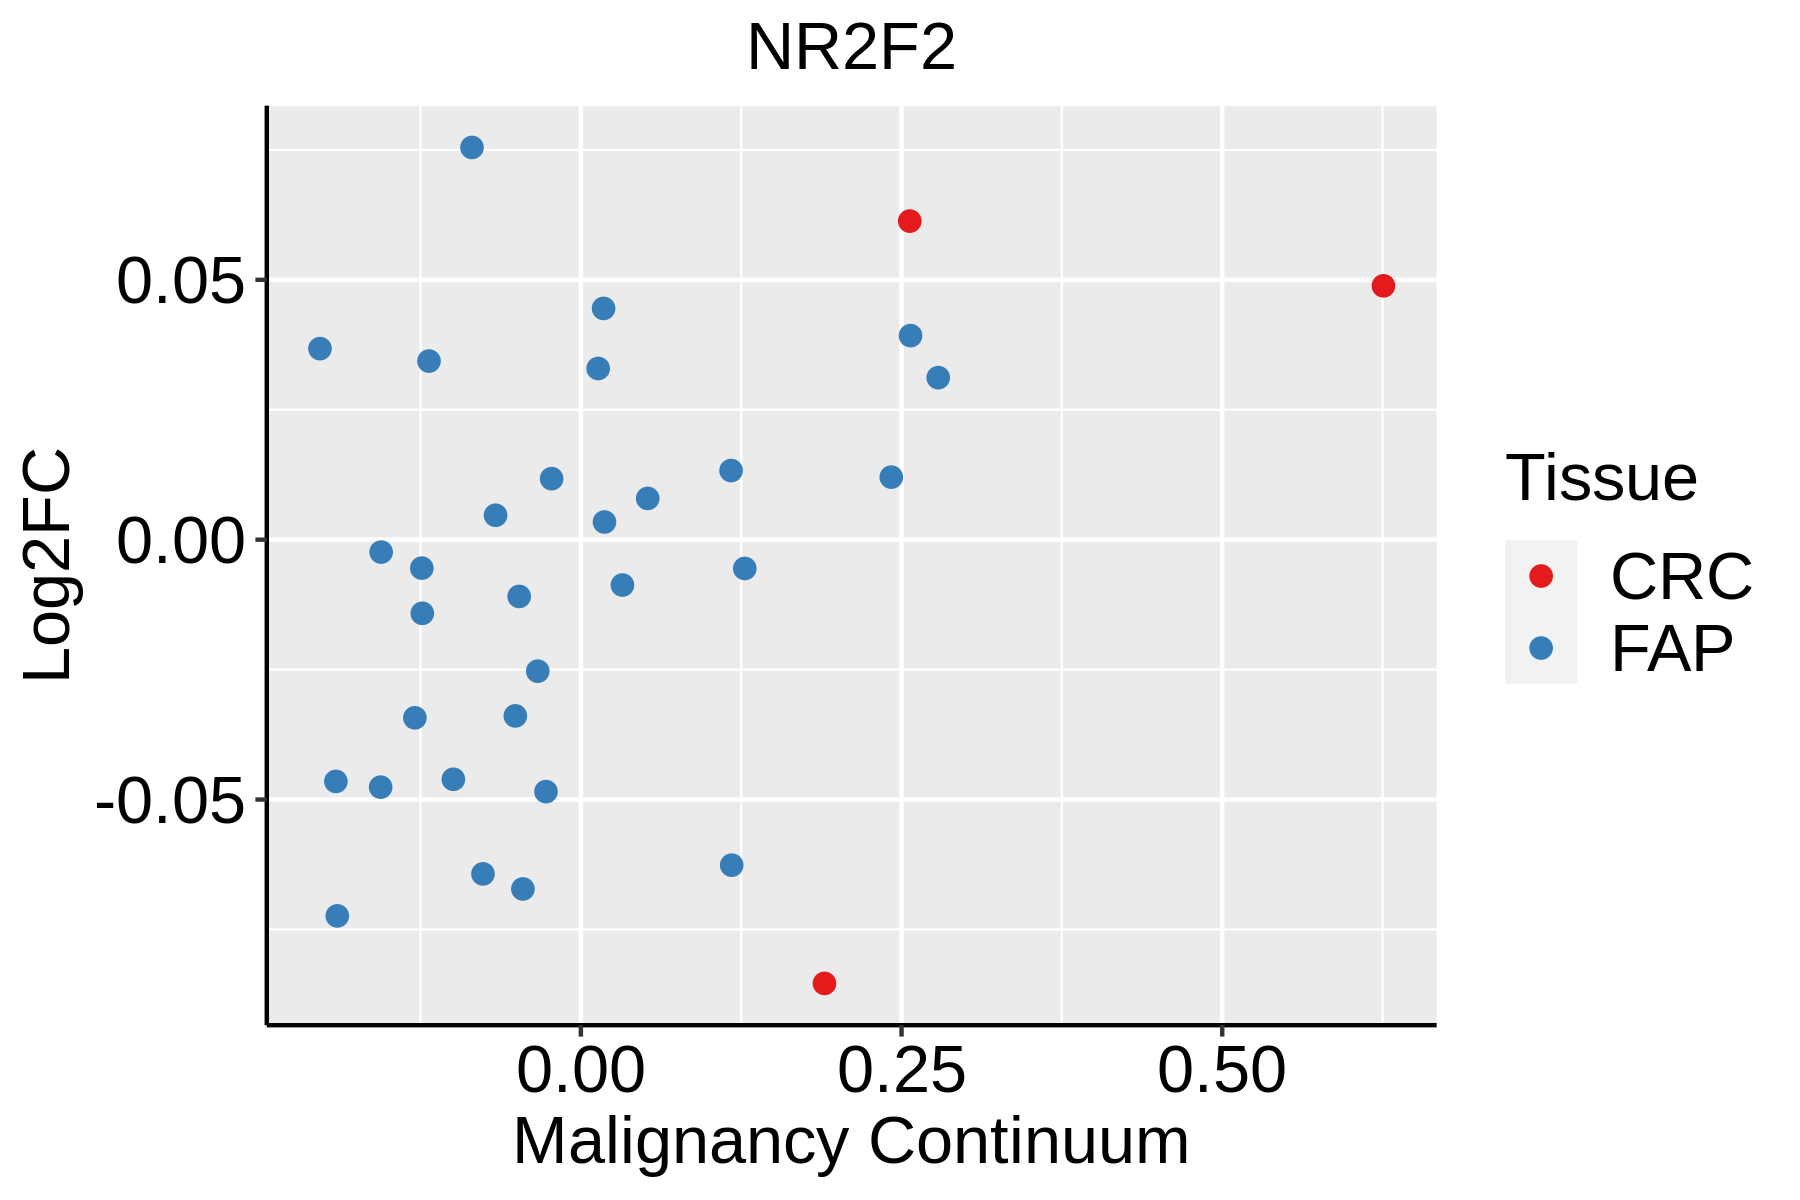 | FAP: Familial adenomatous polyposis |
| CRC: Colorectal cancer | ||
| Colorectum (HTA11) |  | AD: Adenomas |
| SER: Sessile serrated lesions | ||
| MSI-H: Microsatellite-high colorectal cancer | ||
| MSS: Microsatellite stable colorectal cancer | ||
| Endometrium | 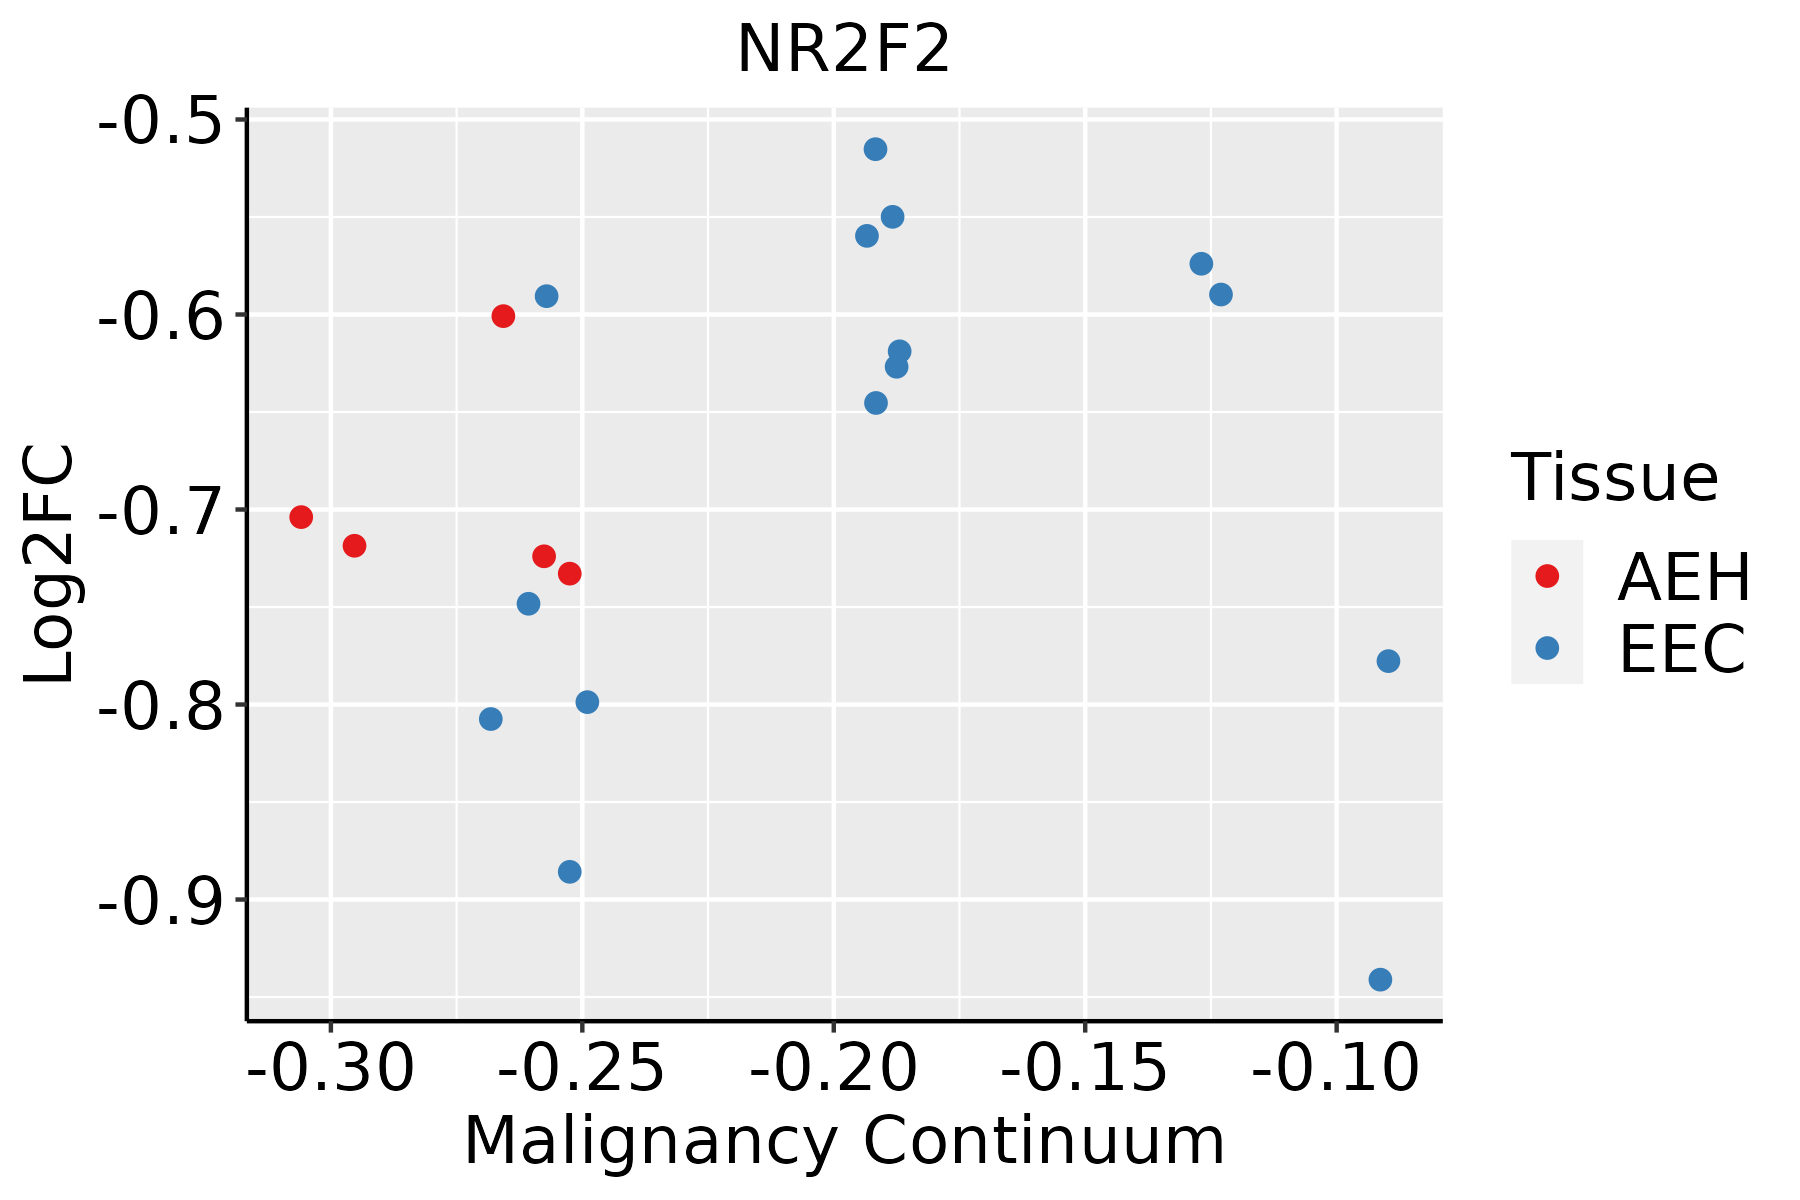 | AEH: Atypical endometrial hyperplasia |
| EEC: Endometrioid Cancer | ||
| Esophagus | 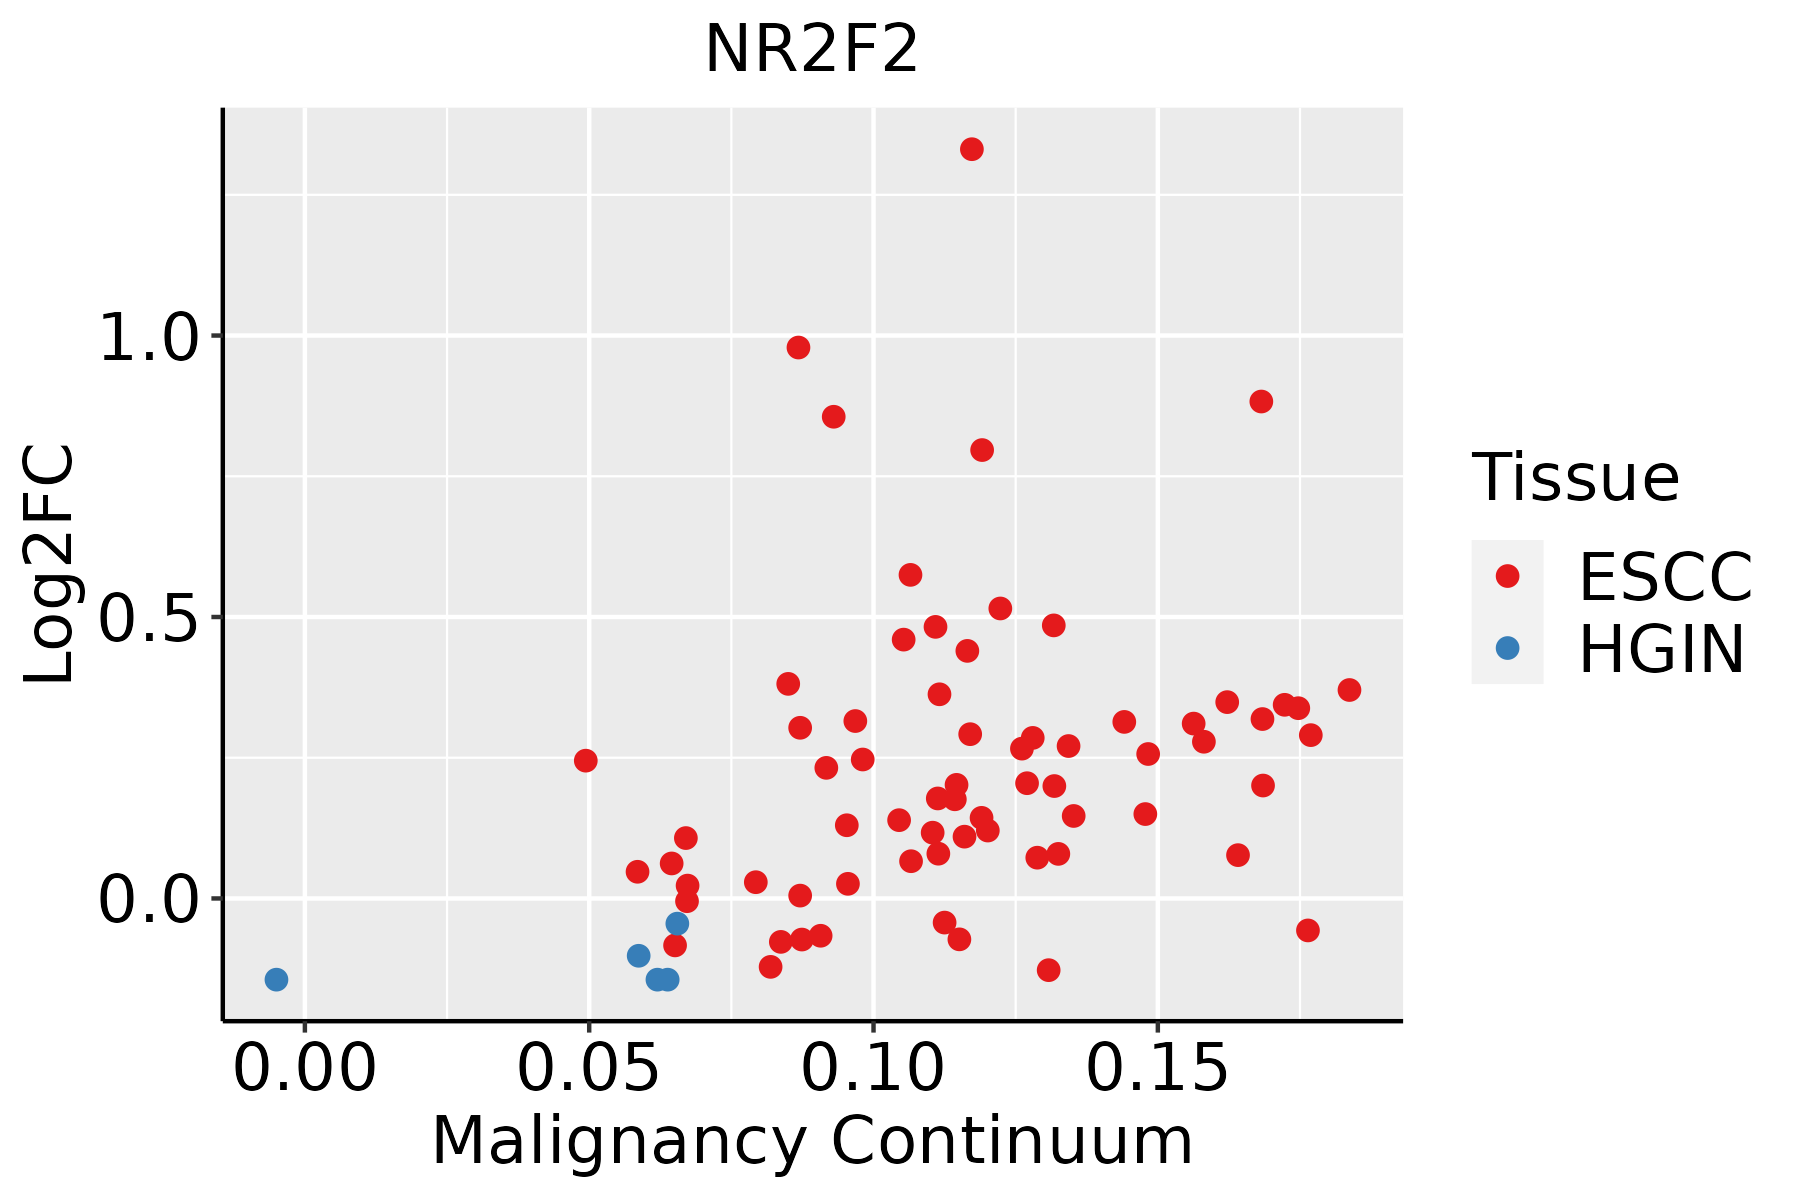 | ESCC: Esophageal squamous cell carcinoma |
| HGIN: High-grade intraepithelial neoplasias | ||
| LGIN: Low-grade intraepithelial neoplasias | ||
| Liver |  | HCC: Hepatocellular carcinoma |
| NAFLD: Non-alcoholic fatty liver disease | ||
| Oral Cavity |  | EOLP: Erosive Oral lichen planus |
| LP: leukoplakia | ||
| NEOLP: Non-erosive oral lichen planus | ||
| OSCC: Oral squamous cell carcinoma | ||
| Prostate | 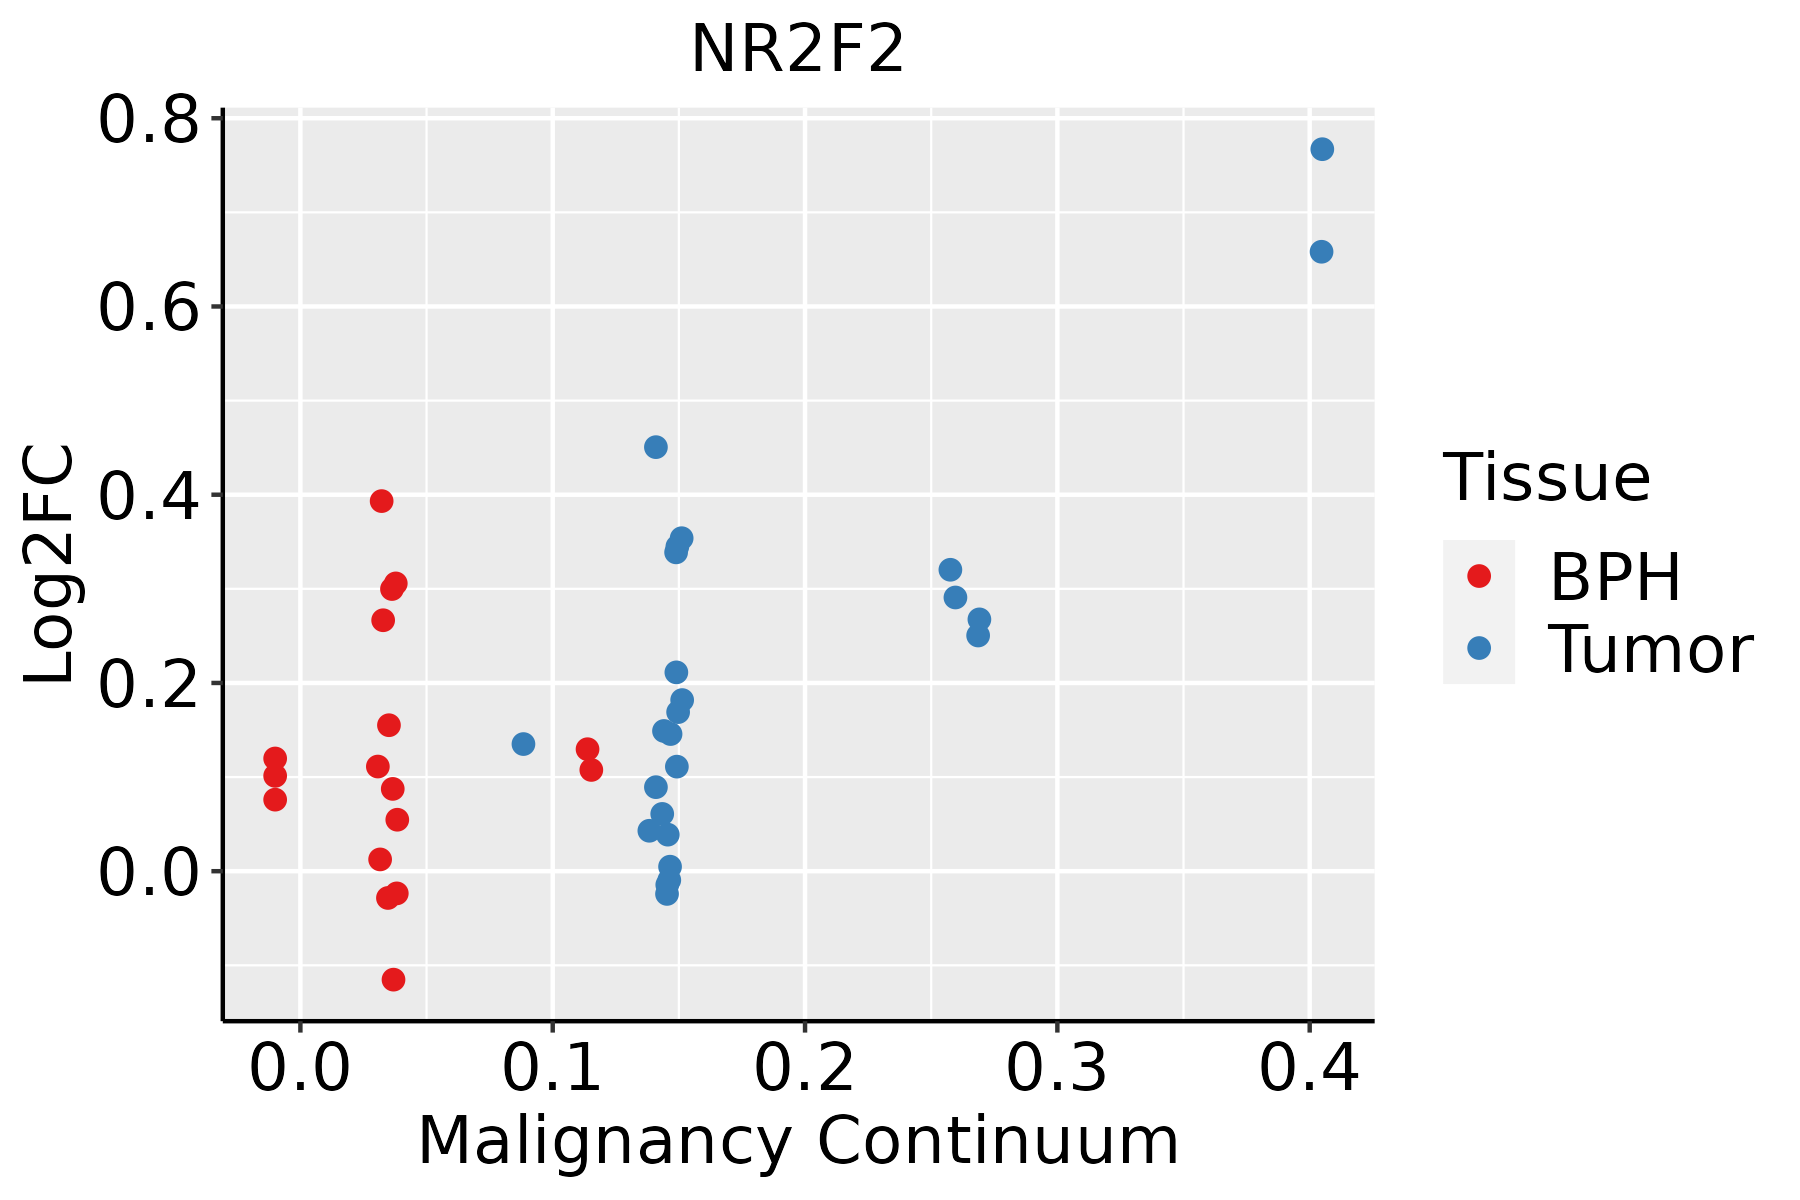 | BPH: Benign Prostatic Hyperplasia |
| Thyroid | 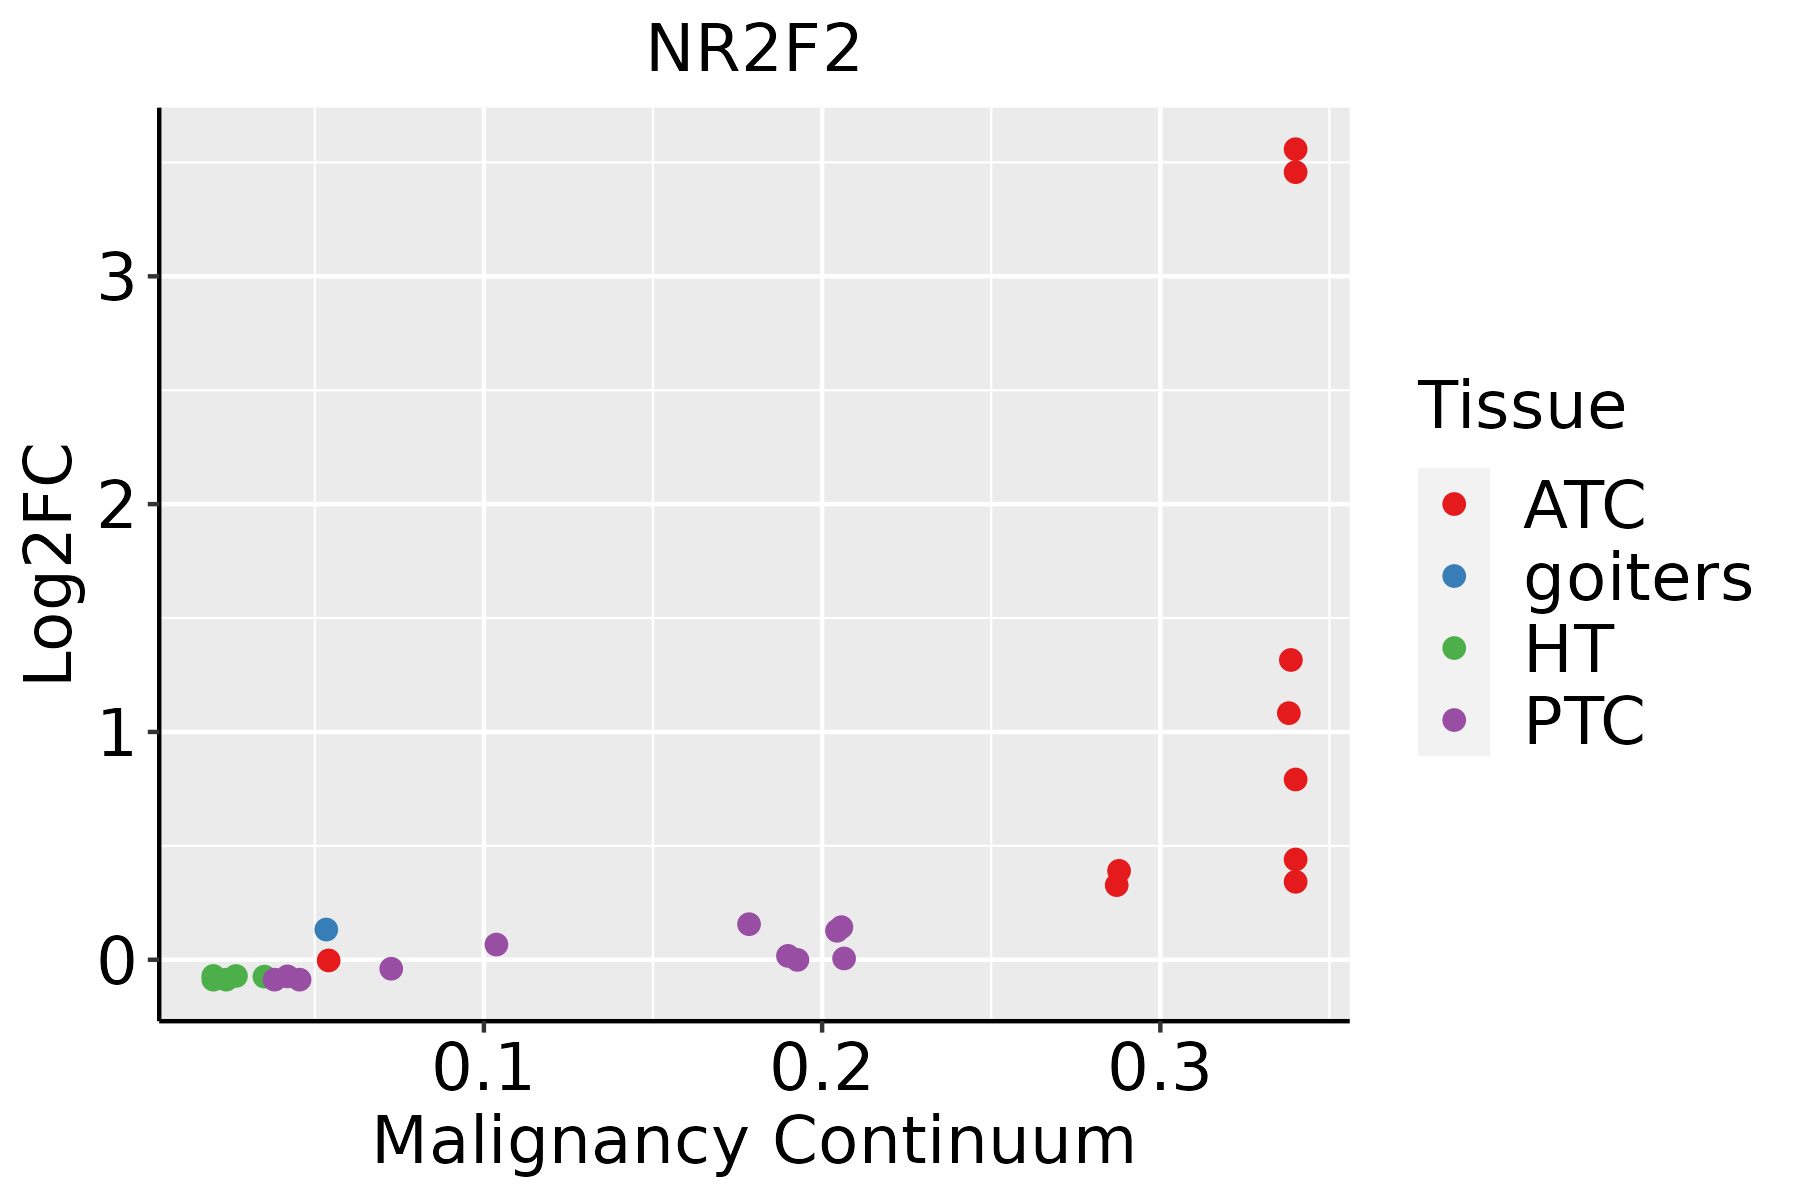 | ATC: Anaplastic thyroid cancer |
| HT: Hashimoto's thyroiditis | ||
| PTC: Papillary thyroid cancer |
| ∗log2FC in expression of this searched gene in stem-like cells from each diseased tissue sample relative to stem-like cells in normal samples in each tissue plotted against the malignancy continuum. Samples are colored based on if they are from different disease stage. |
Top |
Malignant transformation related pathway analysis |
| Find out the enriched GO biological processes and KEGG pathways involved in transition from healthy to precancer to cancer |
| Tissue | Disease Stage | Enriched GO biological Processes |
| Colorectum | AD |  |
| Colorectum | SER |  |
| Colorectum | MSS |  |
| Colorectum | MSI-H |  |
| Colorectum | FAP |  |
| ∗Top 15 enriched GO BP terms are showed in the bar plot of each disease state in each tissue. Each row represents a significant GO biological process which is colored according to the -log10(p.adjust). |
| Page: 1 2 3 4 5 6 7 8 9 |
| GO ID | Tissue | Disease Stage | Description | Gene Ratio | Bg Ratio | pvalue | p.adjust | Count |
| GO:00018901 | Colorectum | SER | placenta development | 43/2897 | 144/18723 | 9.10e-06 | 3.03e-04 | 43 |
| GO:00018921 | Colorectum | SER | embryonic placenta development | 28/2897 | 82/18723 | 2.24e-05 | 6.43e-04 | 28 |
| GO:00105631 | Colorectum | SER | negative regulation of phosphorus metabolic process | 101/2897 | 442/18723 | 2.39e-05 | 6.70e-04 | 101 |
| GO:00459361 | Colorectum | SER | negative regulation of phosphate metabolic process | 100/2897 | 441/18723 | 3.62e-05 | 9.39e-04 | 100 |
| GO:00016671 | Colorectum | SER | ameboidal-type cell migration | 105/2897 | 475/18723 | 6.97e-05 | 1.59e-03 | 105 |
| GO:00019331 | Colorectum | SER | negative regulation of protein phosphorylation | 79/2897 | 342/18723 | 1.21e-04 | 2.49e-03 | 79 |
| GO:00901321 | Colorectum | SER | epithelium migration | 82/2897 | 360/18723 | 1.50e-04 | 2.93e-03 | 82 |
| GO:00106311 | Colorectum | SER | epithelial cell migration | 81/2897 | 357/18723 | 1.87e-04 | 3.44e-03 | 81 |
| GO:00423261 | Colorectum | SER | negative regulation of phosphorylation | 86/2897 | 385/18723 | 2.10e-04 | 3.78e-03 | 86 |
| GO:00901301 | Colorectum | SER | tissue migration | 82/2897 | 365/18723 | 2.40e-04 | 4.12e-03 | 82 |
| GO:00305221 | Colorectum | SER | intracellular receptor signaling pathway | 63/2897 | 265/18723 | 2.47e-04 | 4.20e-03 | 63 |
| GO:00106321 | Colorectum | SER | regulation of epithelial cell migration | 68/2897 | 292/18723 | 2.72e-04 | 4.53e-03 | 68 |
| GO:00336731 | Colorectum | SER | negative regulation of kinase activity | 57/2897 | 237/18723 | 3.48e-04 | 5.46e-03 | 57 |
| GO:00064691 | Colorectum | SER | negative regulation of protein kinase activity | 52/2897 | 212/18723 | 3.75e-04 | 5.74e-03 | 52 |
| GO:00487361 | Colorectum | SER | appendage development | 42/2897 | 172/18723 | 1.43e-03 | 1.55e-02 | 42 |
| GO:00601731 | Colorectum | SER | limb development | 42/2897 | 172/18723 | 1.43e-03 | 1.55e-02 | 42 |
| GO:00435421 | Colorectum | SER | endothelial cell migration | 61/2897 | 279/18723 | 2.76e-03 | 2.47e-02 | 61 |
| GO:00017011 | Colorectum | SER | in utero embryonic development | 77/2897 | 367/18723 | 2.77e-03 | 2.48e-02 | 77 |
| GO:00614581 | Colorectum | SER | reproductive system development | 87/2897 | 427/18723 | 3.69e-03 | 3.07e-02 | 87 |
| GO:00719001 | Colorectum | SER | regulation of protein serine/threonine kinase activity | 74/2897 | 359/18723 | 5.22e-03 | 3.96e-02 | 74 |
| Page: 1 2 3 4 5 6 7 8 9 10 11 12 13 14 15 16 17 18 19 20 21 22 23 24 25 26 27 28 29 30 31 32 33 34 |
| Pathway ID | Tissue | Disease Stage | Description | Gene Ratio | Bg Ratio | pvalue | p.adjust | qvalue | Count |
| Page: 1 |
Top |
Cell-cell communication analysis |
| Identification of potential cell-cell interactions between two cell types and their ligand-receptor pairs for different disease states |
| Ligand | Receptor | LRpair | Pathway | Tissue | Disease Stage |
| Page: 1 |
Top |
Single-cell gene regulatory network inference analysis |
| Find out the significant the regulons (TFs) and the target genes of each regulon across cell types for different disease states |
| TF | Cell Type | Tissue | Disease Stage | Target Gene | RSS | Regulon Activity |
| NR2F2 | BAS | Breast | ADJ | COL4A1,AARD,IGFBP7, etc. | 1.45e-01 |  |
| NR2F2 | BAS | Breast | Healthy | RGS5,IGFBP5,ADIRF, etc. | 2.43e-01 |  |
| NR2F2 | COL | Cervix | HSIL_HPV | SLC40A1,KRT8,TM4SF4, etc. | 3.14e-01 |  |
| NR2F2 | IMGOB | Colorectum | FAP | COL16A1,SDK2,XBP1, etc. | 1.99e-01 |  |
| NR2F2 | GLAN | Endometrium | AEH | COL3A1,COL1A1,COL1A2, etc. | 2.43e-01 |  |
| NR2F2 | PERI | Esophagus | ESCC | IGFBP7,PTCH1,NR2F2-AS1, etc. | 2.29e-01 |  |
| NR2F2 | MSC | Esophagus | ESCC | IGFBP7,PTCH1,NR2F2-AS1, etc. | 2.58e-01 | |
| NR2F2 | AT2L | Lung | Healthy | LUM,ZC3H14,TIMP3, etc. | 1.66e-01 |  |
| NR2F2 | PERI | Lung | AIS | RGS5,PDGFRB,DLC1, etc. | 1.79e-01 |  |
| NR2F2 | PERI | Lung | MIAC | RGS5,PDGFRB,DLC1, etc. | 1.72e-01 |  |
| ∗The dot plots of a searched regulon are shown for all cell subpopulations in each disease state of each tissue based on the regulon specific score inferred using pySCENIC and by calculating the average expression. |
| Page: 1 2 3 |
Top |
Somatic mutation of malignant transformation related genes |
| Annotation of somatic variants for genes involved in malignant transformation |
| Hugo Symbol | Variant Class | Variant Classification | dbSNP RS | HGVSc | HGVSp | HGVSp Short | SWISSPROT | BIOTYPE | SIFT | PolyPhen | Tumor Sample Barcode | Tissue | Histology | Sex | Age | Stage | Therapy Types | Drugs | Outcome |
| NR2F2 | SNV | Missense_Mutation | novel | c.1064A>C | p.Asn355Thr | p.N355T | P24468 | protein_coding | tolerated(0.42) | possibly_damaging(0.543) | TCGA-A2-A25A-01 | Breast | breast invasive carcinoma | Female | <65 | I/II | Unspecific | Cytoxan | SD |
| NR2F2 | SNV | Missense_Mutation | c.1094N>C | p.Leu365Pro | p.L365P | P24468 | protein_coding | deleterious(0) | probably_damaging(1) | TCGA-D8-A1XK-01 | Breast | breast invasive carcinoma | Female | <65 | I/II | Chemotherapy | doxorubicine+cyclophosphamide | SD | |
| NR2F2 | SNV | Missense_Mutation | c.653N>A | p.Arg218Lys | p.R218K | P24468 | protein_coding | tolerated(0.07) | probably_damaging(0.997) | TCGA-EA-A1QS-01 | Cervix | cervical & endocervical cancer | Female | <65 | I/II | Unknown | Unknown | SD | |
| NR2F2 | SNV | Missense_Mutation | c.1102C>A | p.Pro368Thr | p.P368T | P24468 | protein_coding | deleterious(0.02) | probably_damaging(1) | TCGA-EA-A50E-01 | Cervix | cervical & endocervical cancer | Female | <65 | I/II | Unknown | Unknown | PD | |
| NR2F2 | SNV | Missense_Mutation | novel | c.814N>A | p.Ala272Thr | p.A272T | P24468 | protein_coding | deleterious(0.01) | benign(0.272) | TCGA-GH-A9DA-01 | Cervix | cervical & endocervical cancer | Female | <65 | I/II | Unknown | Unknown | SD |
| NR2F2 | SNV | Missense_Mutation | novel | c.823C>A | p.Leu275Met | p.L275M | P24468 | protein_coding | tolerated(0.12) | probably_damaging(0.97) | TCGA-MA-AA42-01 | Cervix | cervical & endocervical cancer | Female | >=65 | I/II | Unknown | Unknown | SD |
| NR2F2 | SNV | Missense_Mutation | c.911N>T | p.Ala304Val | p.A304V | P24468 | protein_coding | tolerated(0.08) | benign(0.022) | TCGA-AA-3678-01 | Colorectum | colon adenocarcinoma | Female | <65 | III/IV | Chemotherapy | folinic | CR | |
| NR2F2 | SNV | Missense_Mutation | c.1112N>A | p.Arg371His | p.R371H | P24468 | protein_coding | deleterious(0) | probably_damaging(1) | TCGA-AA-3715-01 | Colorectum | colon adenocarcinoma | Male | >=65 | I/II | Unknown | Unknown | PD | |
| NR2F2 | SNV | Missense_Mutation | novel | c.517N>T | p.Asn173Tyr | p.N173Y | P24468 | protein_coding | deleterious(0.03) | benign(0.003) | TCGA-AA-3855-01 | Colorectum | colon adenocarcinoma | Male | >=65 | I/II | Unknown | Unknown | SD |
| NR2F2 | SNV | Missense_Mutation | c.899N>G | p.Glu300Gly | p.E300G | P24468 | protein_coding | deleterious(0.03) | probably_damaging(1) | TCGA-AZ-4313-01 | Colorectum | colon adenocarcinoma | Female | <65 | I/II | Unknown | Unknown | SD |
| Page: 1 2 3 4 5 6 |
Top |
Related drugs of malignant transformation related genes |
| Identification of chemicals and drugs interact with genes involved in malignant transfromation |
| (DGIdb 4.0) |
| Entrez ID | Symbol | Category | Interaction Types | Drug Claim Name | Drug Name | PMIDs |
| 7026 | NR2F2 | NUCLEAR HORMONE RECEPTOR, TRANSCRIPTION FACTOR, DRUGGABLE GENOME | CYCLOHEXIMIDE | CYCLOHEXIMIDE | ||
| 7026 | NR2F2 | NUCLEAR HORMONE RECEPTOR, TRANSCRIPTION FACTOR, DRUGGABLE GENOME | GNF-PF-1678 | CHEMBL580340 | ||
| 7026 | NR2F2 | NUCLEAR HORMONE RECEPTOR, TRANSCRIPTION FACTOR, DRUGGABLE GENOME | TCMDC-125620 | CHEMBL530291 | ||
| 7026 | NR2F2 | NUCLEAR HORMONE RECEPTOR, TRANSCRIPTION FACTOR, DRUGGABLE GENOME | RESACTIN A | RESACTIN A | ||
| 7026 | NR2F2 | NUCLEAR HORMONE RECEPTOR, TRANSCRIPTION FACTOR, DRUGGABLE GENOME | PYRIDABEN | PYRIDABEN | ||
| 7026 | NR2F2 | NUCLEAR HORMONE RECEPTOR, TRANSCRIPTION FACTOR, DRUGGABLE GENOME | GNF-PF-4659 | CHEMBL584442 |
| Page: 1 |

Copyright 2023-Present -The University of Texas Health Science Center at Houston |