Schematic overview of the cellular and molecular mechanisms involved in the cancer progression, including the proposed cellular and molecular mechanisms in cancer cells trajectory. AT1: alveolar type 1 cells; AT2: alveolar type 2 cells; AAH: atypical adenomatous hyperplasia; AIS: adenocarcinoma in situ; MIA: minimally invasive adenocarcinoma; IA: invasive adenocarcinoma; EMT: epithelial-mesenchymal transition

Home

Download

Statistics

Help

Contact

Center for Computational Systems Medicine
leaf

Gene summary

leaf

Malignant transformation analysis

leaf

Malignant transformation related pathway analysis

leaf

Cell-cell communication analysis

leaf

Single-cell gene regulatory network inference analysis

leaf

Somatic mutation of malignant transformation related genes

leaf

Related drugs of malignant transformation related genes

Gene: NMT1

Gene summary for NMT1

check button Gene summary.

Gene informationSpeciesHuman
Gene symbol

NMT1

Gene ID

4836

Gene nameN-myristoyltransferase 1
Gene AliasNMT
Cytomap17q21.31
Gene Typeprotein-coding
GO ID

GO:0001701

UniProtAcc

P30419


Top

Malignant transformation analysis

check button Identification of the aberrant gene expression in precancerous and cancerous lesions by comparing the gene expression of stem-like cells in diseased tissues with normal stem cells
check button Malignant transformation involving gene list.
Entrez IDSymbolReplicatesSpeciesOrganTissueAdj P-valueLog2FCMalignancy
4836NMT1LZE2THumanEsophagusESCC2.46e-033.67e-010.082
4836NMT1LZE4THumanEsophagusESCC2.79e-041.88e-010.0811
4836NMT1LZE7THumanEsophagusESCC5.87e-063.14e-010.0667
4836NMT1LZE21D1HumanEsophagusHGIN1.03e-021.49e-010.0632
4836NMT1LZE22D1HumanEsophagusHGIN1.06e-031.61e-010.0595
4836NMT1LZE22THumanEsophagusESCC2.58e-042.67e-010.068
4836NMT1LZE24THumanEsophagusESCC5.95e-082.97e-010.0596
4836NMT1P1T-EHumanEsophagusESCC3.04e-074.23e-010.0875
4836NMT1P2T-EHumanEsophagusESCC7.90e-172.84e-010.1177
4836NMT1P4T-EHumanEsophagusESCC2.27e-163.60e-010.1323
4836NMT1P5T-EHumanEsophagusESCC6.14e-375.92e-010.1327
4836NMT1P8T-EHumanEsophagusESCC1.88e-274.74e-010.0889
4836NMT1P9T-EHumanEsophagusESCC1.26e-102.82e-010.1131
4836NMT1P10T-EHumanEsophagusESCC1.05e-271.41e-010.116
4836NMT1P11T-EHumanEsophagusESCC3.51e-186.10e-010.1426
4836NMT1P12T-EHumanEsophagusESCC8.83e-203.37e-010.1122
4836NMT1P15T-EHumanEsophagusESCC1.32e-164.56e-010.1149
4836NMT1P16T-EHumanEsophagusESCC8.04e-222.03e-010.1153
4836NMT1P17T-EHumanEsophagusESCC6.69e-165.44e-010.1278
4836NMT1P19T-EHumanEsophagusESCC7.33e-056.20e-010.1662
Page: 1 2 3 4 5 6 7 

check button Transcriptomic changes along malignancy continuum.
TissueExpression DynamicsAbbreviation
EsophagusThe image shows the transcriptomic changes along malignancy continuum.log2FC in expression of this searched gene in stem-like cells from each diseased tissue sample relative to stem-like cells in normal samples in each tissue plotted against the malignancy continuum. Samples are colored based on if they are from different disease stage.
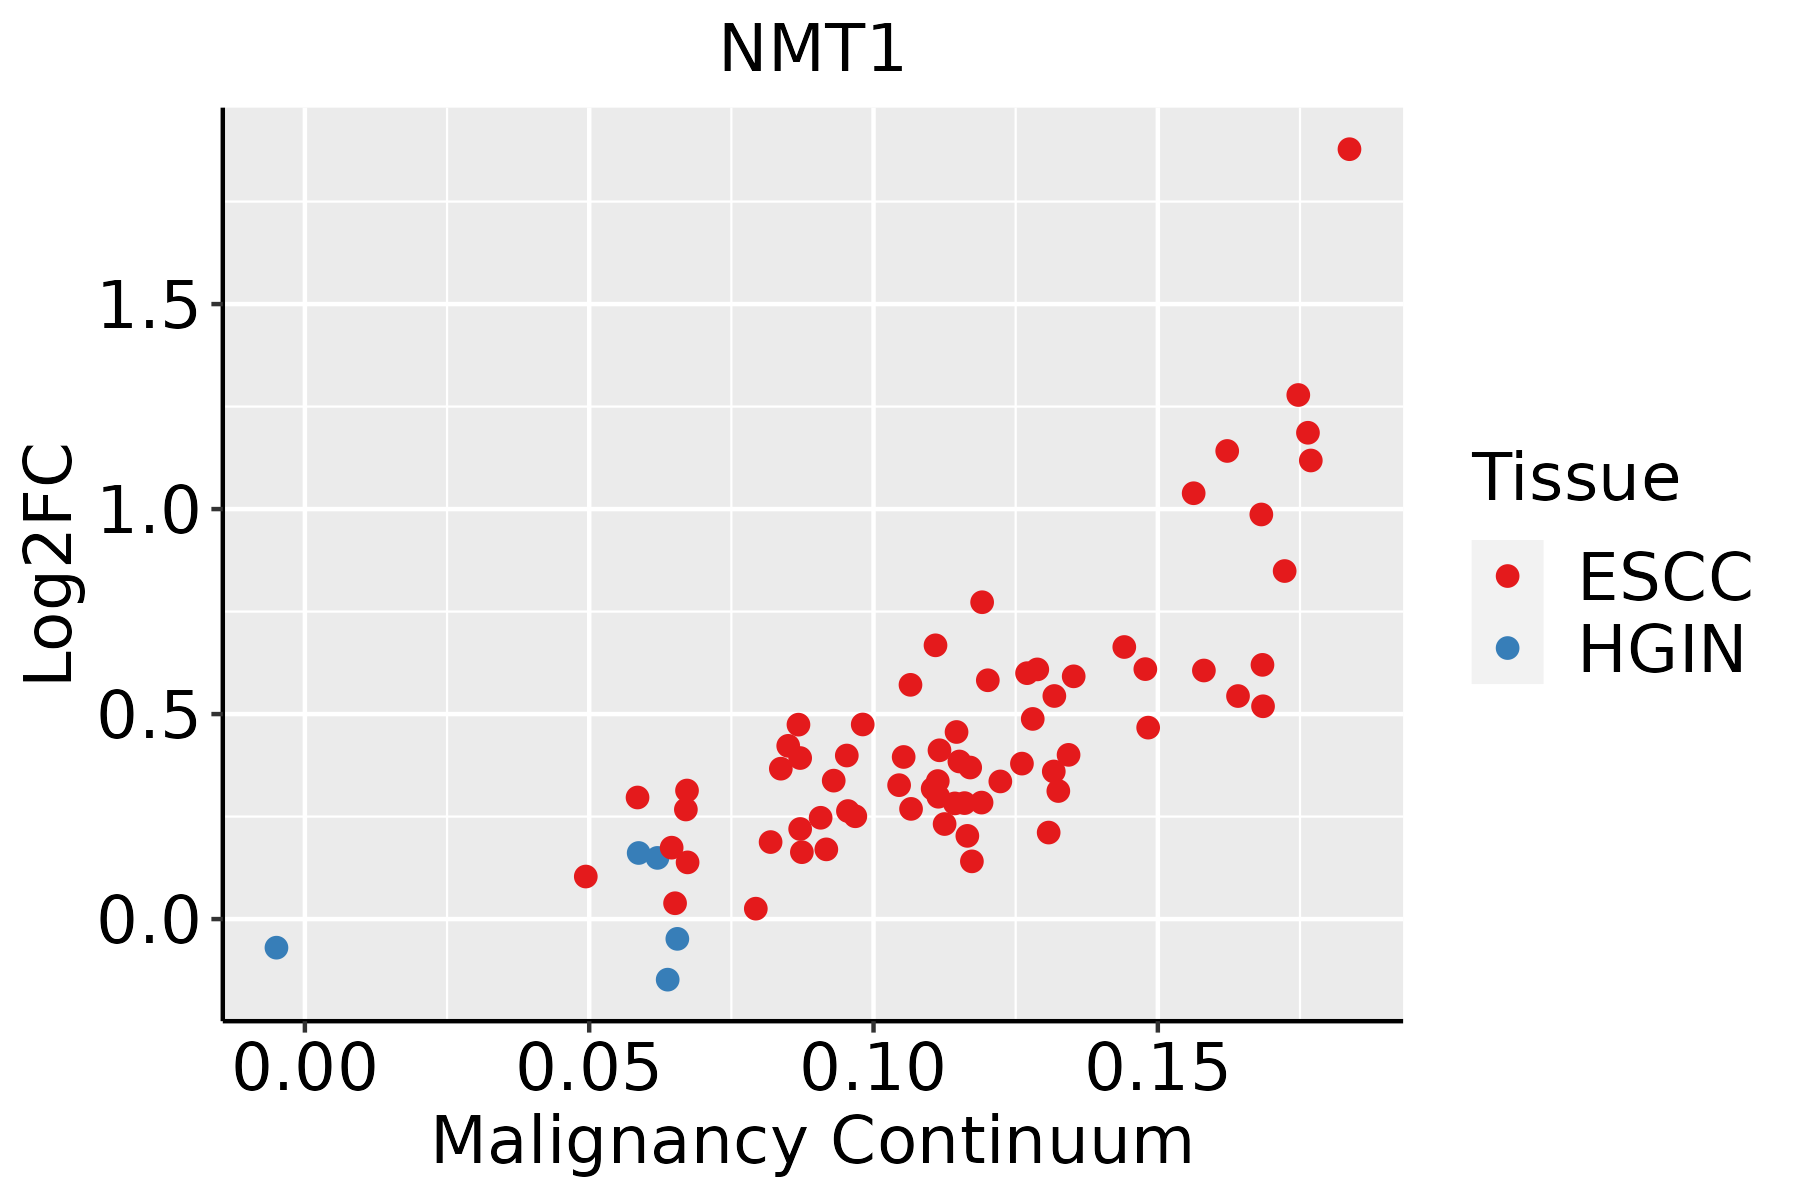
ESCC: Esophageal squamous cell carcinoma
HGIN: High-grade intraepithelial neoplasias
LGIN: Low-grade intraepithelial neoplasias
LiverThe image shows the transcriptomic changes along malignancy continuum.log2FC in expression of this searched gene in stem-like cells from each diseased tissue sample relative to stem-like cells in normal samples in each tissue plotted against the malignancy continuum. Samples are colored based on if they are from different disease stage.
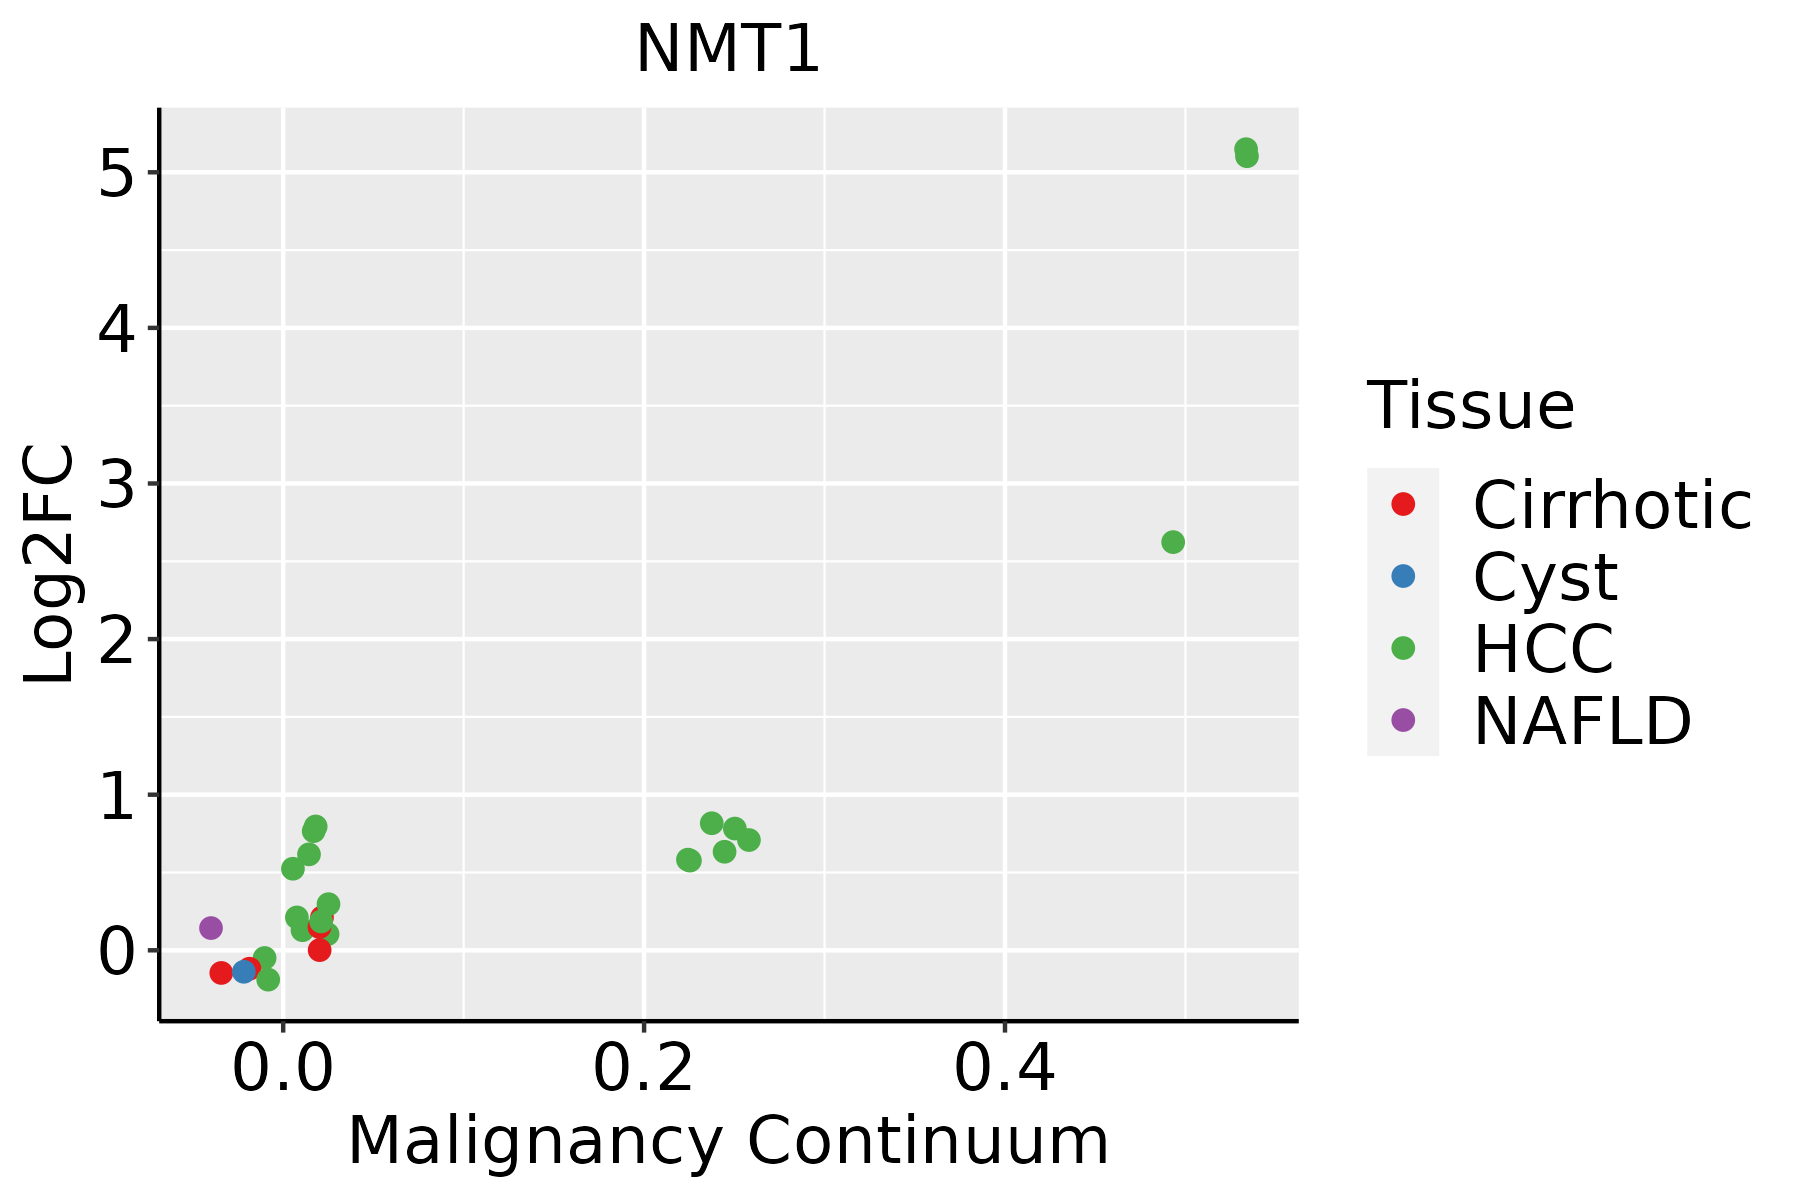
HCC: Hepatocellular carcinoma
NAFLD: Non-alcoholic fatty liver disease
Oral CavityThe image shows the transcriptomic changes along malignancy continuum.log2FC in expression of this searched gene in stem-like cells from each diseased tissue sample relative to stem-like cells in normal samples in each tissue plotted against the malignancy continuum. Samples are colored based on if they are from different disease stage.
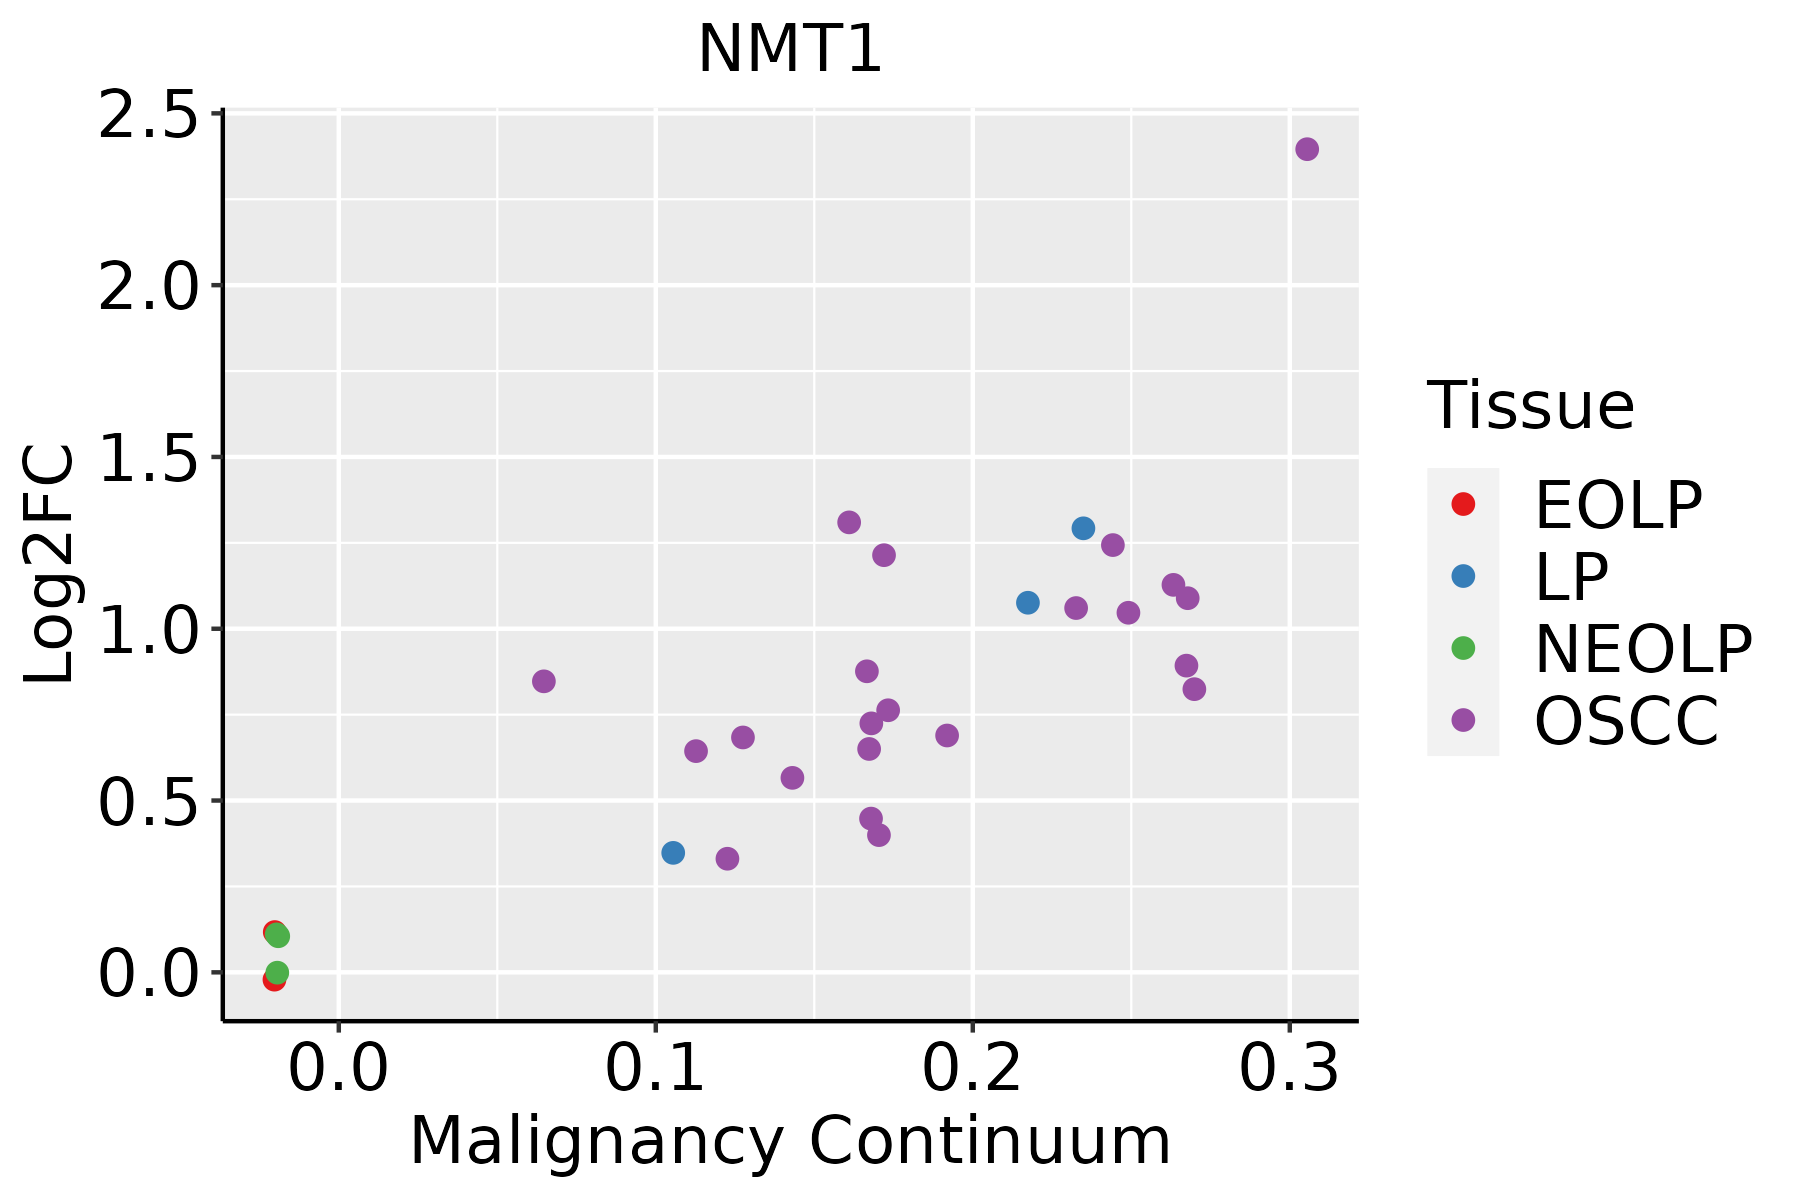
EOLP: Erosive Oral lichen planus
LP: leukoplakia
NEOLP: Non-erosive oral lichen planus
OSCC: Oral squamous cell carcinoma
SkinThe image shows the transcriptomic changes along malignancy continuum.log2FC in expression of this searched gene in stem-like cells from each diseased tissue sample relative to stem-like cells in normal samples in each tissue plotted against the malignancy continuum. Samples are colored based on if they are from different disease stage.
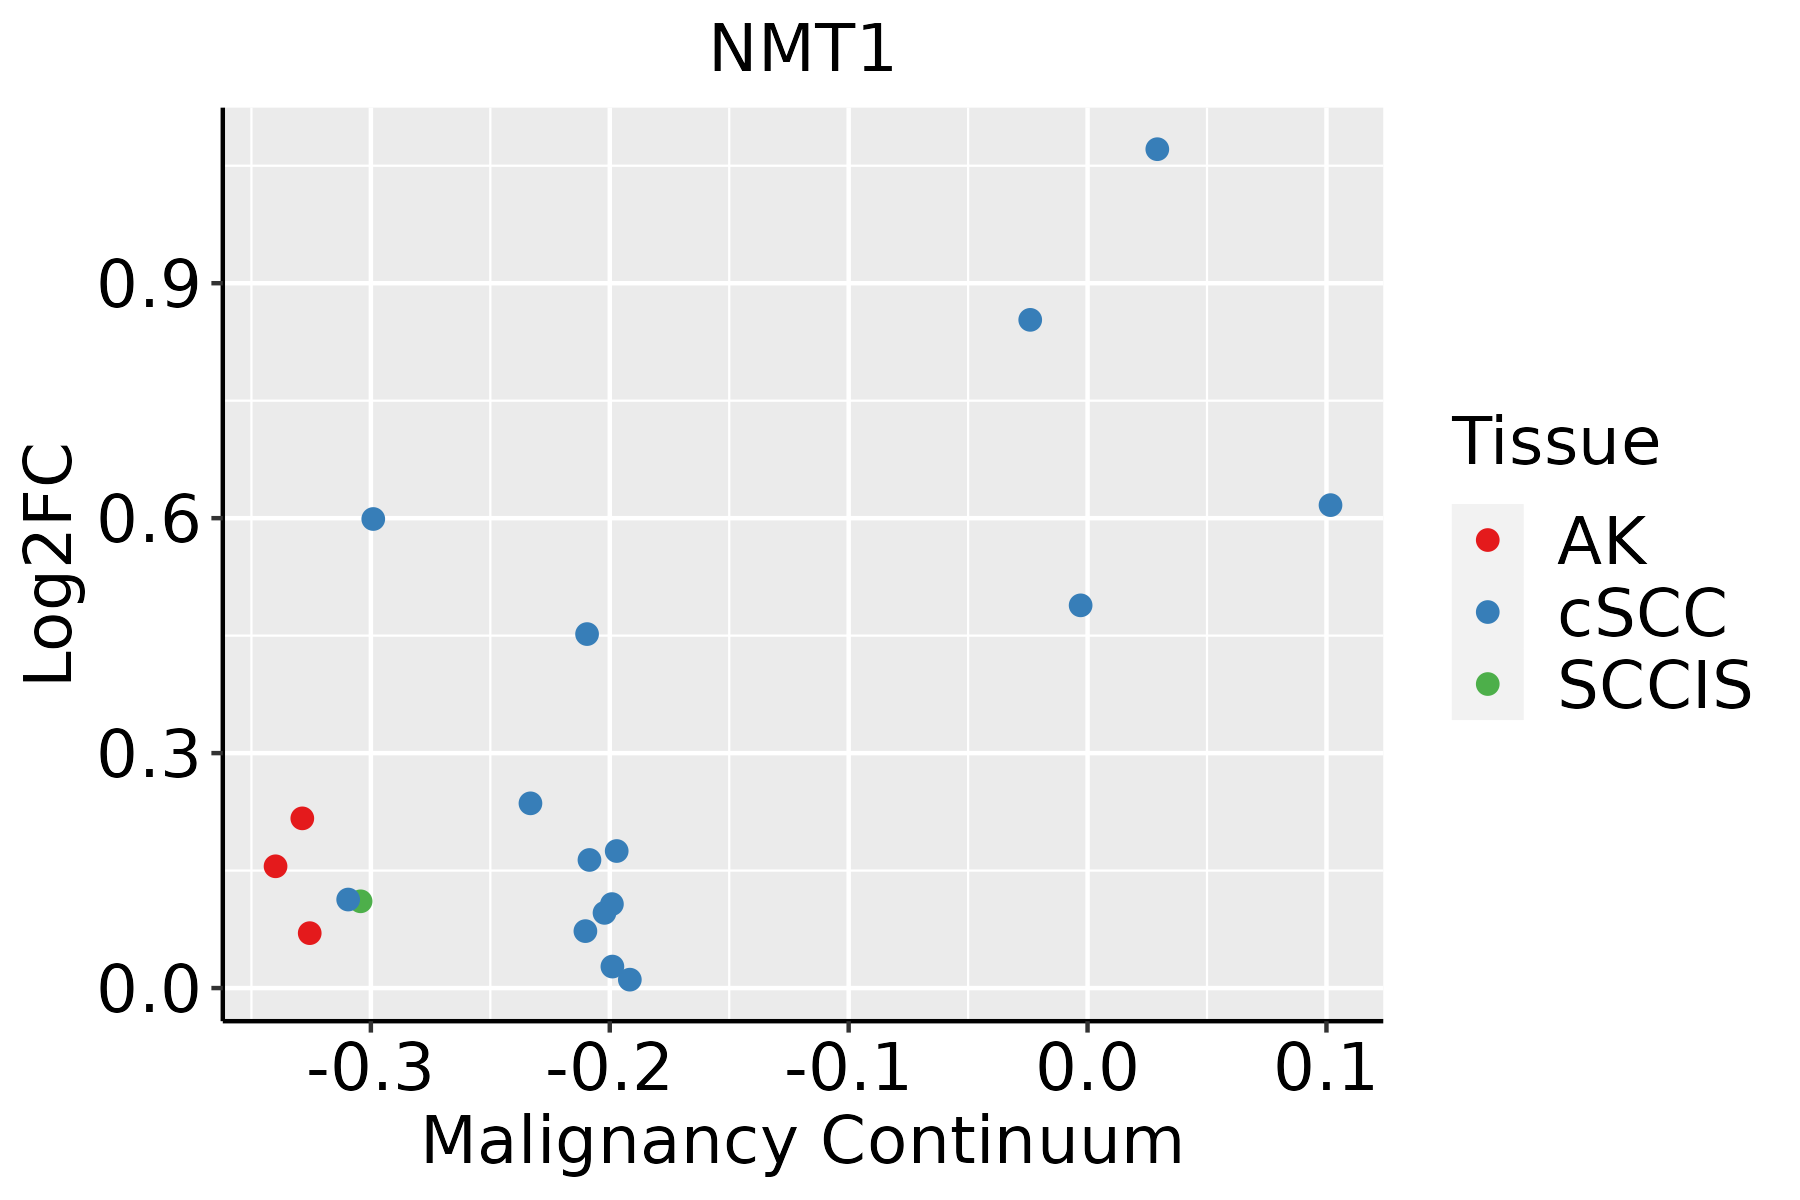
AK: Actinic keratosis
cSCC: Cutaneous squamous cell carcinoma
SCCIS:squamous cell carcinoma in situ
ThyroidThe image shows the transcriptomic changes along malignancy continuum.log2FC in expression of this searched gene in stem-like cells from each diseased tissue sample relative to stem-like cells in normal samples in each tissue plotted against the malignancy continuum. Samples are colored based on if they are from different disease stage.ATC: Anaplastic thyroid cancer
HT: Hashimoto's thyroiditis
PTC: Papillary thyroid cancer
∗log2FC in expression of this searched gene in stem-like cells from each diseased tissue sample relative to stem-like cells in normal samples in each tissue plotted against the malignancy continuum. Samples are colored based on if they are from different disease stage.

Top

Malignant transformation related pathway analysis

check buttonFind out the enriched GO biological processes and KEGG pathways involved in transition from healthy to precancer to cancer
check button Figure of enriched GO biological processes.
TissueDisease StageEnriched GO biological Processes
ColorectumADGO analysis - Figure of enriched GO biological processes: Top 15 enriched GO BP terms are showed in the bar plot of each disease state in each tissue. Each row represents a significant GO biological process which is colored according to the -log10(p.adjust).
ColorectumSERGO analysis - Figure of enriched GO biological processes: Top 15 enriched GO BP terms are showed in the bar plot of each disease state in each tissue. Each row represents a significant GO biological process which is colored according to the -log10(p.adjust).
ColorectumMSSGO analysis - Figure of enriched GO biological processes: Top 15 enriched GO BP terms are showed in the bar plot of each disease state in each tissue. Each row represents a significant GO biological process which is colored according to the -log10(p.adjust).
ColorectumMSI-HGO analysis - Figure of enriched GO biological processes: Top 15 enriched GO BP terms are showed in the bar plot of each disease state in each tissue. Each row represents a significant GO biological process which is colored according to the -log10(p.adjust).
ColorectumFAPGO analysis - Figure of enriched GO biological processes: Top 15 enriched GO BP terms are showed in the bar plot of each disease state in each tissue. Each row represents a significant GO biological process which is colored according to the -log10(p.adjust).
∗Top 15 enriched GO BP terms are showed in the bar plot of each disease state in each tissue. Each row represents a significant GO biological process which is colored according to the -log10(p.adjust).
Page: 1 2 3 4 5 6 7 8 9 

check button Enriched GO biological processes.
GO IDTissueDisease StageDescriptionGene RatioBg Ratiopvaluep.adjustCount
GO:00905599EsophagusESCCregulation of membrane permeability58/855278/187232.38e-073.61e-0658
GO:00357948EsophagusESCCpositive regulation of mitochondrial membrane permeability36/855243/187232.90e-074.20e-0636
GO:000647914EsophagusESCCprotein methylation115/8552181/187239.07e-071.16e-05115
GO:000821314EsophagusESCCprotein alkylation115/8552181/187239.07e-071.16e-05115
GO:009734510EsophagusESCCmitochondrial outer membrane permeabilization28/855232/187231.02e-061.29e-0528
GO:00310583EsophagusESCCpositive regulation of histone modification65/855292/187231.04e-061.31e-0565
GO:190547719EsophagusESCCpositive regulation of protein localization to membrane73/8552106/187231.13e-061.40e-0573
GO:190268614EsophagusESCCmitochondrial outer membrane permeabilization involved in programmed cell death33/855240/187231.80e-062.11e-0533
GO:009015118EsophagusESCCestablishment of protein localization to mitochondrial membrane26/855230/187233.79e-064.12e-0526
GO:19021108EsophagusESCCpositive regulation of mitochondrial membrane permeability involved in apoptotic process31/855238/187235.93e-066.10e-0531
GO:00015101EsophagusESCCRNA methylation58/855283/187236.87e-066.94e-0558
GO:19057108EsophagusESCCpositive regulation of membrane permeability37/855248/187238.99e-068.65e-0537
GO:00421573EsophagusESCClipoprotein metabolic process86/8552135/187231.78e-051.57e-0486
GO:000941611EsophagusESCCresponse to light stimulus183/8552320/187232.03e-051.76e-04183
GO:00064973EsophagusESCCprotein lipidation62/855292/187232.08e-051.80e-0462
GO:00165718EsophagusESCChistone methylation89/8552141/187232.17e-051.87e-0489
GO:19010289EsophagusESCCregulation of mitochondrial outer membrane permeabilization involved in apoptotic signaling pathway19/855221/187232.28e-051.96e-0419
GO:00421583EsophagusESCClipoprotein biosynthetic process64/855296/187232.61e-052.20e-0464
GO:19021086EsophagusESCCregulation of mitochondrial membrane permeability involved in apoptotic process34/855245/187234.37e-053.49e-0434
GO:190374715EsophagusESCCregulation of establishment of protein localization to mitochondrion37/855250/187234.42e-053.51e-0437
Page: 1 2 3 4 5 6 7 8 9 10 11 12 13 14 15 16 17 18 19 20 21 22 23 24 25 26 27 28 29 30 31 32 33 34 35 36 

check button Enriched KEGG pathways.
Pathway IDTissueDisease StageDescriptionGene RatioBg Ratiopvaluep.adjustqvalueCount
Page: 1 

Top

Cell-cell communication analysis

check buttonIdentification of potential cell-cell interactions between two cell types and their ligand-receptor pairs for different disease states
LigandReceptorLRpairPathwayTissueDisease Stage
Page: 1 

Top

Single-cell gene regulatory network inference analysis

check buttonFind out the significant the regulons (TFs) and the target genes of each regulon across cell types for different disease states
TFCell TypeTissueDisease StageTarget GeneRSSRegulon Activity
∗The dot plots of a searched regulon are shown for all cell subpopulations in each disease state of each tissue based on the regulon specific score inferred using pySCENIC and by calculating the average expression.
Page: 1 

Top

Somatic mutation of malignant transformation related genes

check buttonAnnotation of somatic variants for genes involved in malignant transformation
Hugo SymbolVariant ClassVariant ClassificationdbSNP RSHGVScHGVSpHGVSp ShortSWISSPROTBIOTYPESIFTPolyPhenTumor Sample BarcodeTissueHistologySexAgeStageTherapy TypesDrugsOutcome
NMT1SNVMissense_Mutationc.344N>Ap.Arg115Glnp.R115QP30419protein_codingtolerated(0.08)benign(0.138)TCGA-A8-A08H-01Breastbreast invasive carcinomaFemale>=65I/IIUnknownUnknownSD
NMT1SNVMissense_Mutationnovelc.763N>Tp.Arg255Cysp.R255CP30419protein_codingdeleterious(0)probably_damaging(1)TCGA-AC-A3W6-01Breastbreast invasive carcinomaFemale>=65III/IVUnknownUnknownSD
NMT1SNVMissense_Mutationnovelc.177N>Tp.Lys59Asnp.K59NP30419protein_codingtolerated(0.12)benign(0.264)TCGA-AN-A046-01Breastbreast invasive carcinomaFemale>=65I/IIUnknownUnknownSD
NMT1SNVMissense_Mutationc.732N>Tp.Glu244Aspp.E244DP30419protein_codingdeleterious(0.02)benign(0.232)TCGA-BH-A18G-01Breastbreast invasive carcinomaFemale>=65I/IIUnknownUnknownSD
NMT1insertionFrame_Shift_Insnovelc.965_966insAGGTATTCATTGTCTGGTGACTTTATATAAGAAAGGAAp.Thr323GlyfsTer15p.T323Gfs*15P30419protein_codingTCGA-A8-A07Z-01Breastbreast invasive carcinomaFemale>=65I/IIUnspecificExemestaneSD
NMT1insertionFrame_Shift_Insnovelc.792_793insAGTTp.Arg265SerfsTer45p.R265Sfs*45P30419protein_codingTCGA-B6-A0IA-01Breastbreast invasive carcinomaFemale<65I/IIUnknownUnknownSD
NMT1insertionFrame_Shift_Insnovelc.793_794insCTACCATGCCAGGGGGCAGAAGGATTTGTp.Arg265ProfsTer47p.R265Pfs*47P30419protein_codingTCGA-B6-A0IA-01Breastbreast invasive carcinomaFemale<65I/IIUnknownUnknownSD
NMT1SNVMissense_Mutationnovelc.532G>Cp.Glu178Glnp.E178QP30419protein_codingtolerated(0.1)probably_damaging(0.996)TCGA-C5-A1MH-01Cervixcervical & endocervical cancerFemale>=65III/IVChemotherapycisplatinPD
NMT1SNVMissense_Mutationnovelc.1368N>Tp.Met456Ilep.M456IP30419protein_codingdeleterious(0)probably_damaging(1)TCGA-C5-A901-01Cervixcervical & endocervical cancerFemale<65I/IIUnknownUnknownSD
NMT1SNVMissense_Mutationc.10G>Ap.Glu4Lysp.E4KP30419protein_codingdeleterious_low_confidence(0.04)benign(0.017)TCGA-JX-A3Q0-01Cervixcervical & endocervical cancerFemale<65III/IVUnknownUnknownSD
Page: 1 2 3 4 5 6 

Top

Related drugs of malignant transformation related genes

check buttonIdentification of chemicals and drugs interact with genes involved in malignant transfromation
(DGIdb 4.0)
Entrez IDSymbolCategoryInteraction TypesDrug Claim NameDrug NamePMIDs
Page: 1