Schematic overview of the cellular and molecular mechanisms involved in the cancer progression, including the proposed cellular and molecular mechanisms in cancer cells trajectory. AT1: alveolar type 1 cells; AT2: alveolar type 2 cells; AAH: atypical adenomatous hyperplasia; AIS: adenocarcinoma in situ; MIA: minimally invasive adenocarcinoma; IA: invasive adenocarcinoma; EMT: epithelial-mesenchymal transition

Home

Download

Statistics

Help

Contact

Center for Computational Systems Medicine
leaf

Gene summary

leaf

Malignant transformation analysis

leaf

Malignant transformation related pathway analysis

leaf

Cell-cell communication analysis

leaf

Single-cell gene regulatory network inference analysis

leaf

Somatic mutation of malignant transformation related genes

leaf

Related drugs of malignant transformation related genes

Gene: MYLIP

Gene summary for MYLIP

check button Gene summary.

Gene informationSpeciesHuman
Gene symbol

MYLIP

Gene ID

29116

Gene namemyosin regulatory light chain interacting protein
Gene AliasIDOL
Cytomap6p22.3
Gene Typeprotein-coding
GO ID

GO:0006464

UniProtAcc

Q8WY64


Top

Malignant transformation analysis

check button Identification of the aberrant gene expression in precancerous and cancerous lesions by comparing the gene expression of stem-like cells in diseased tissues with normal stem cells
check button Malignant transformation involving gene list.
Entrez IDSymbolReplicatesSpeciesOrganTissueAdj P-valueLog2FCMalignancy
29116MYLIPHTA11_3410_2000001011HumanColorectumAD5.49e-033.08e-020.0155
29116MYLIPHTA11_1938_2000001011HumanColorectumAD6.37e-042.60e-01-0.0811
29116MYLIPHTA11_866_3004761011HumanColorectumAD5.60e-083.75e-010.096
29116MYLIPHTA11_7696_3000711011HumanColorectumAD1.52e-032.61e-010.0674
29116MYLIPHTA11_99999965104_69814HumanColorectumMSS9.71e-127.07e-010.281
29116MYLIPHTA11_99999971662_82457HumanColorectumMSS4.45e-085.04e-010.3859
29116MYLIPA002-C-205HumanColorectumFAP1.43e-02-1.58e-01-0.1236
29116MYLIPA015-C-104HumanColorectumFAP7.32e-04-2.15e-01-0.1899
29116MYLIPA002-C-016HumanColorectumFAP9.51e-03-1.63e-010.0521
29116MYLIPA002-C-116HumanColorectumFAP8.21e-04-1.67e-01-0.0452
29116MYLIPA018-E-020HumanColorectumFAP1.74e-02-1.76e-01-0.2034
29116MYLIPAEH-subject1HumanEndometriumAEH2.19e-031.81e-01-0.3059
29116MYLIPAEH-subject2HumanEndometriumAEH2.61e-051.53e-03-0.2525
29116MYLIPAEH-subject4HumanEndometriumAEH2.86e-024.96e-02-0.2657
29116MYLIPAEH-subject5HumanEndometriumAEH4.62e-05-2.47e-01-0.2953
29116MYLIPEEC-subject1HumanEndometriumEEC5.02e-04-1.83e-02-0.2682
29116MYLIPEEC-subject2HumanEndometriumEEC5.42e-09-3.14e-01-0.2607
29116MYLIPEEC-subject3HumanEndometriumEEC4.47e-19-3.52e-01-0.2525
29116MYLIPGSM5276934HumanEndometriumEEC2.66e-21-4.48e-01-0.0913
29116MYLIPGSM5276935HumanEndometriumEEC1.99e-06-2.91e-01-0.123
Page: 1 2 3 4 5 6 7 8 

check button Transcriptomic changes along malignancy continuum.
TissueExpression DynamicsAbbreviation
Colorectum (GSE201348)The image shows the transcriptomic changes along malignancy continuum.log2FC in expression of this searched gene in stem-like cells from each diseased tissue sample relative to stem-like cells in normal samples in each tissue plotted against the malignancy continuum. Samples are colored based on if they are from different disease stage.FAP: Familial adenomatous polyposis
CRC: Colorectal cancer
Colorectum (HTA11)The image shows the transcriptomic changes along malignancy continuum.log2FC in expression of this searched gene in stem-like cells from each diseased tissue sample relative to stem-like cells in normal samples in each tissue plotted against the malignancy continuum. Samples are colored based on if they are from different disease stage.AD: Adenomas
SER: Sessile serrated lesions
MSI-H: Microsatellite-high colorectal cancer
MSS: Microsatellite stable colorectal cancer
EndometriumThe image shows the transcriptomic changes along malignancy continuum.log2FC in expression of this searched gene in stem-like cells from each diseased tissue sample relative to stem-like cells in normal samples in each tissue plotted against the malignancy continuum. Samples are colored based on if they are from different disease stage.
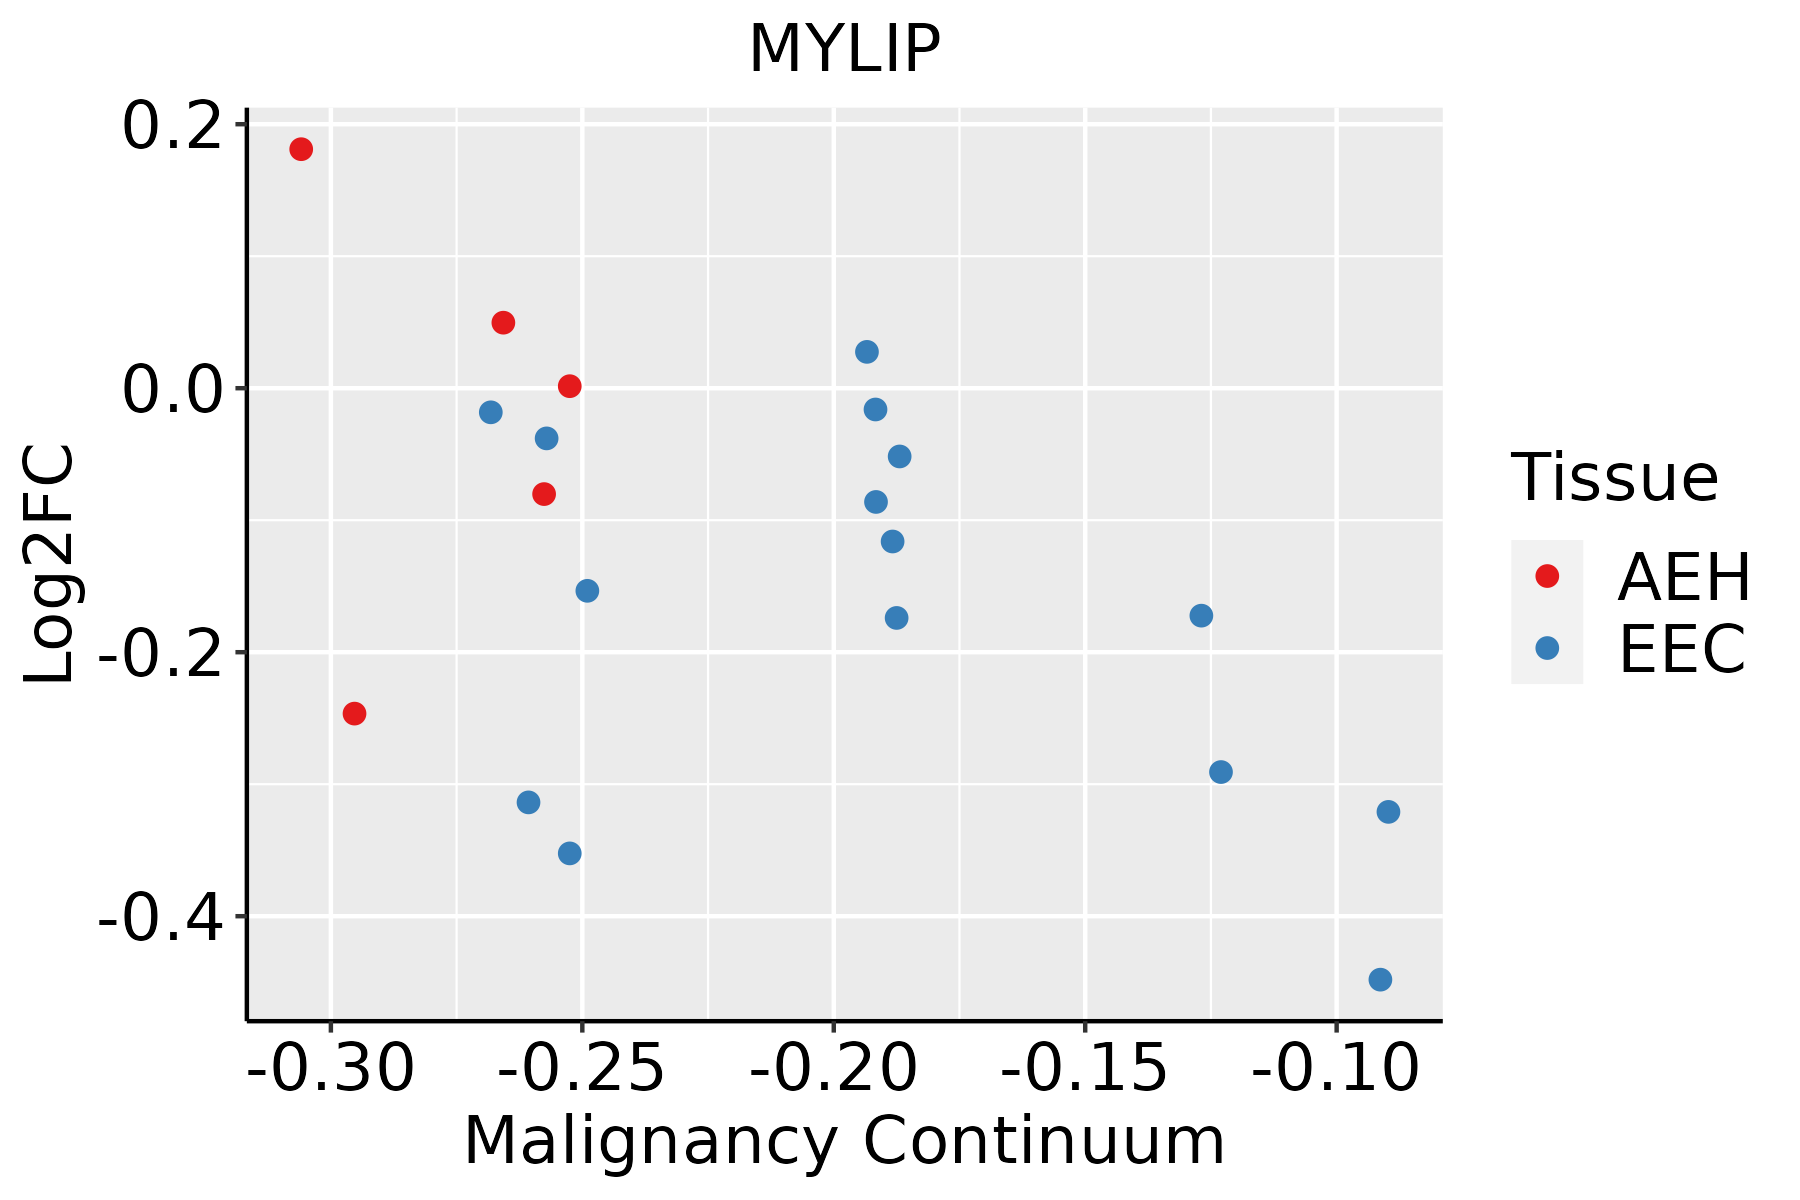
AEH: Atypical endometrial hyperplasia
EEC: Endometrioid Cancer
EsophagusThe image shows the transcriptomic changes along malignancy continuum.log2FC in expression of this searched gene in stem-like cells from each diseased tissue sample relative to stem-like cells in normal samples in each tissue plotted against the malignancy continuum. Samples are colored based on if they are from different disease stage.
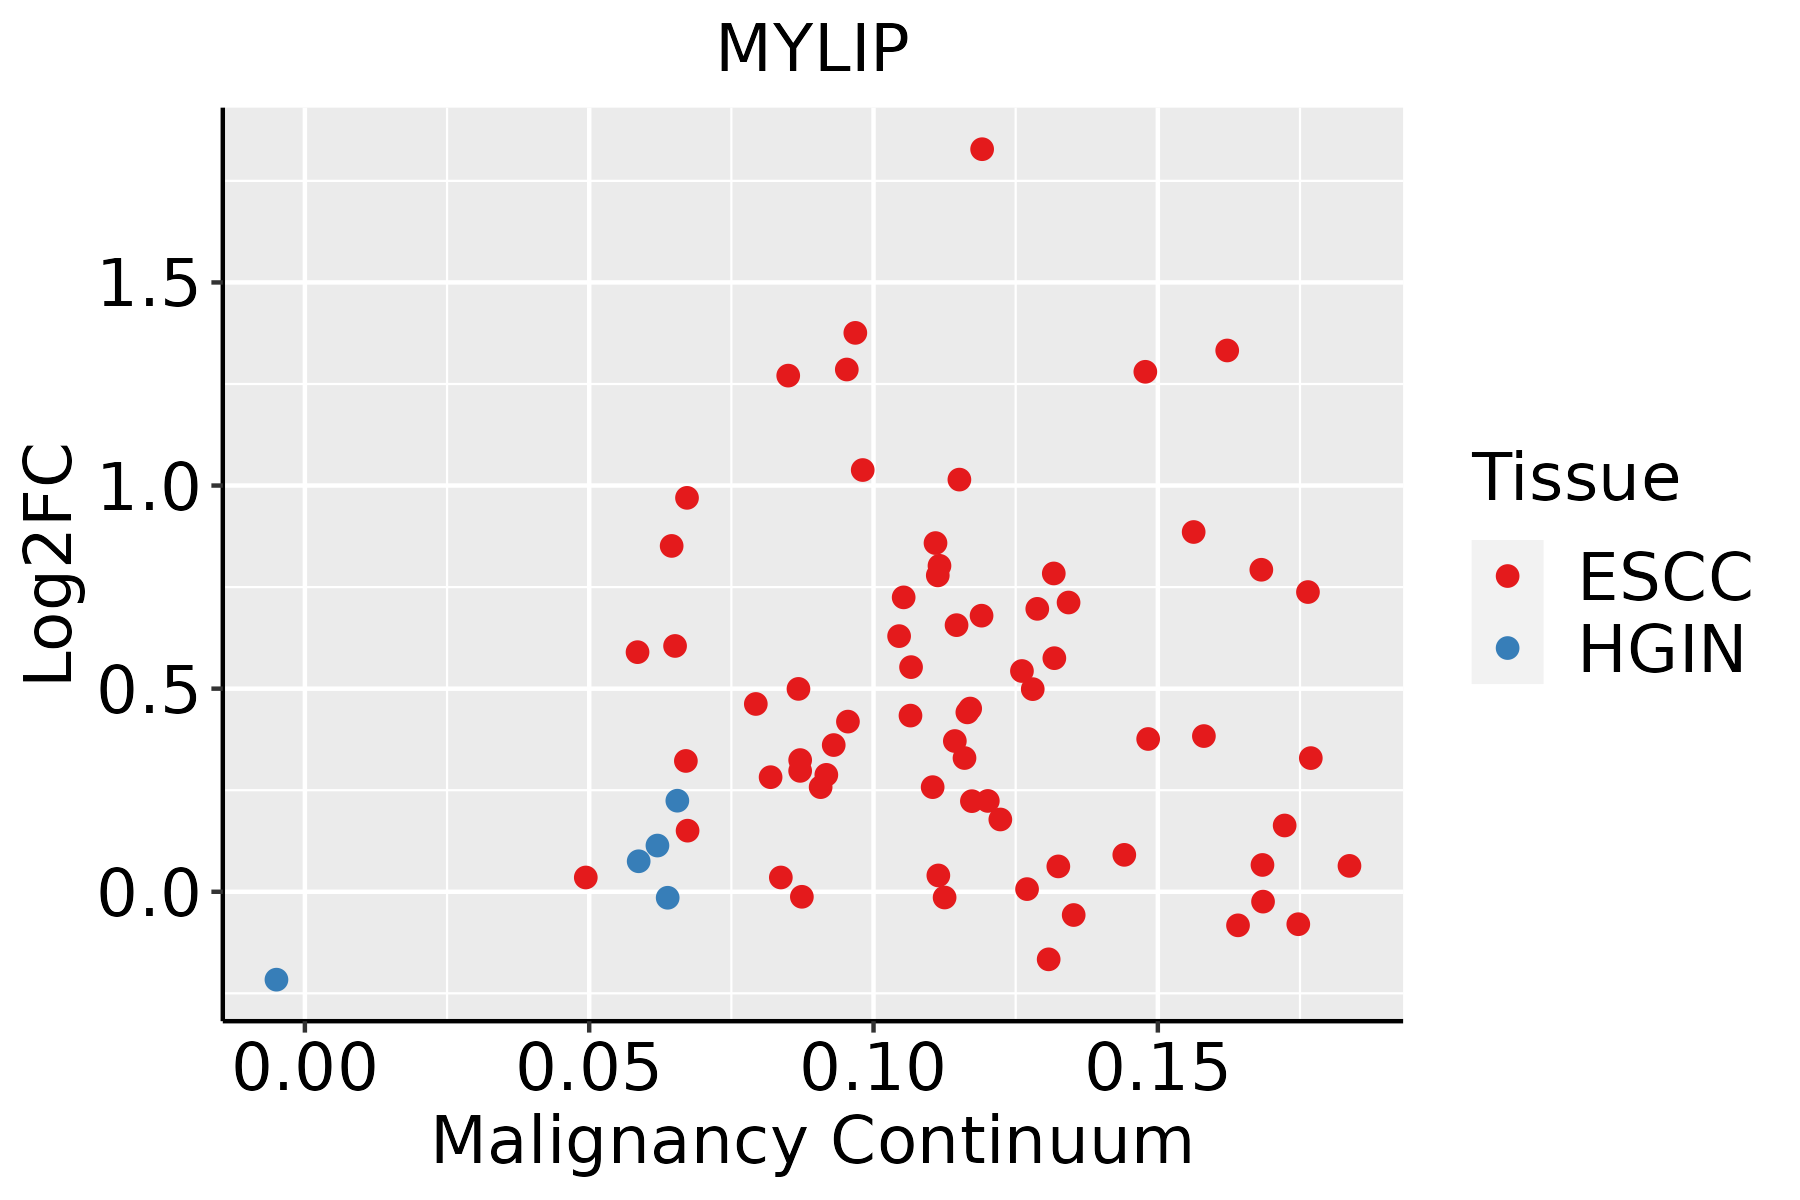
ESCC: Esophageal squamous cell carcinoma
HGIN: High-grade intraepithelial neoplasias
LGIN: Low-grade intraepithelial neoplasias
LiverThe image shows the transcriptomic changes along malignancy continuum.log2FC in expression of this searched gene in stem-like cells from each diseased tissue sample relative to stem-like cells in normal samples in each tissue plotted against the malignancy continuum. Samples are colored based on if they are from different disease stage.
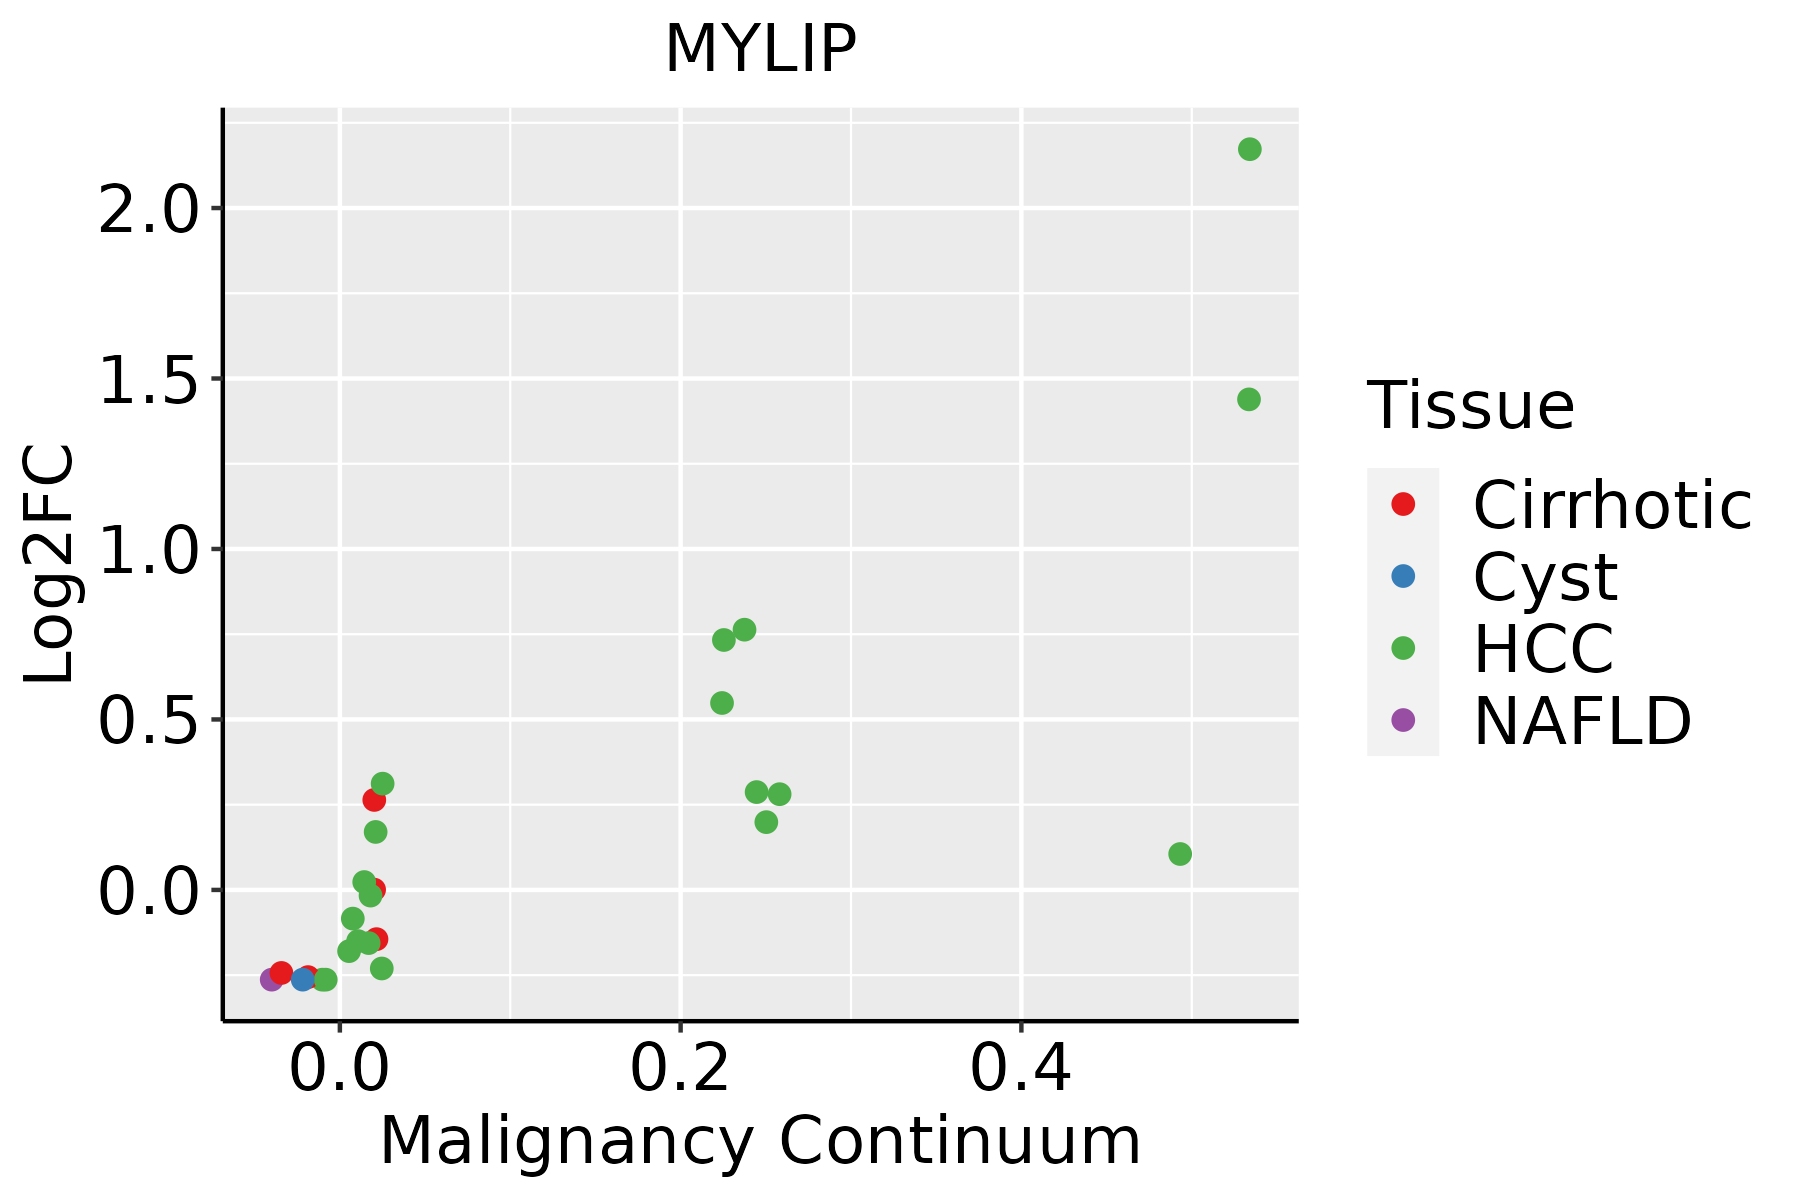
HCC: Hepatocellular carcinoma
NAFLD: Non-alcoholic fatty liver disease
LungThe image shows the transcriptomic changes along malignancy continuum.log2FC in expression of this searched gene in stem-like cells from each diseased tissue sample relative to stem-like cells in normal samples in each tissue plotted against the malignancy continuum. Samples are colored based on if they are from different disease stage.
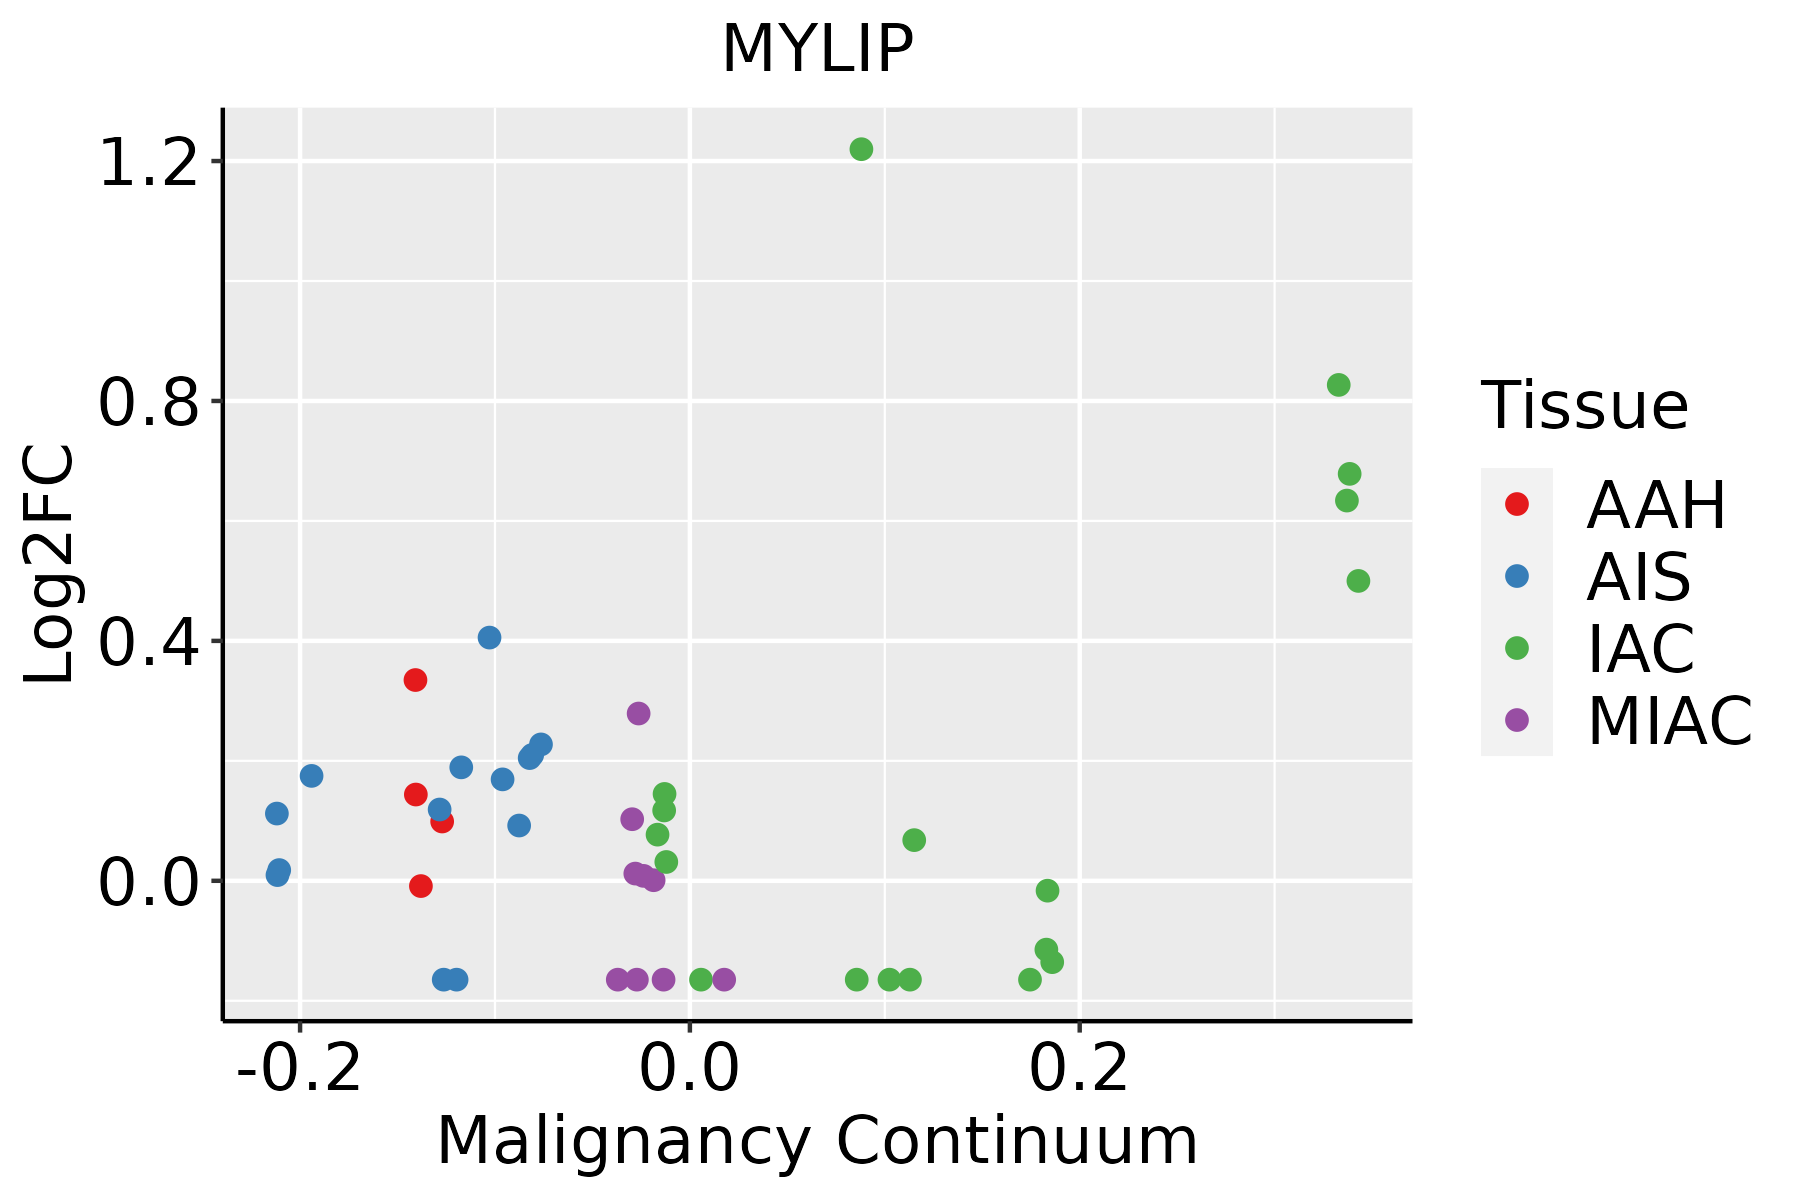
AAH: Atypical adenomatous hyperplasia
AIS: Adenocarcinoma in situ
IAC: Invasive lung adenocarcinoma
MIA: Minimally invasive adenocarcinoma
Oral CavityThe image shows the transcriptomic changes along malignancy continuum.log2FC in expression of this searched gene in stem-like cells from each diseased tissue sample relative to stem-like cells in normal samples in each tissue plotted against the malignancy continuum. Samples are colored based on if they are from different disease stage.
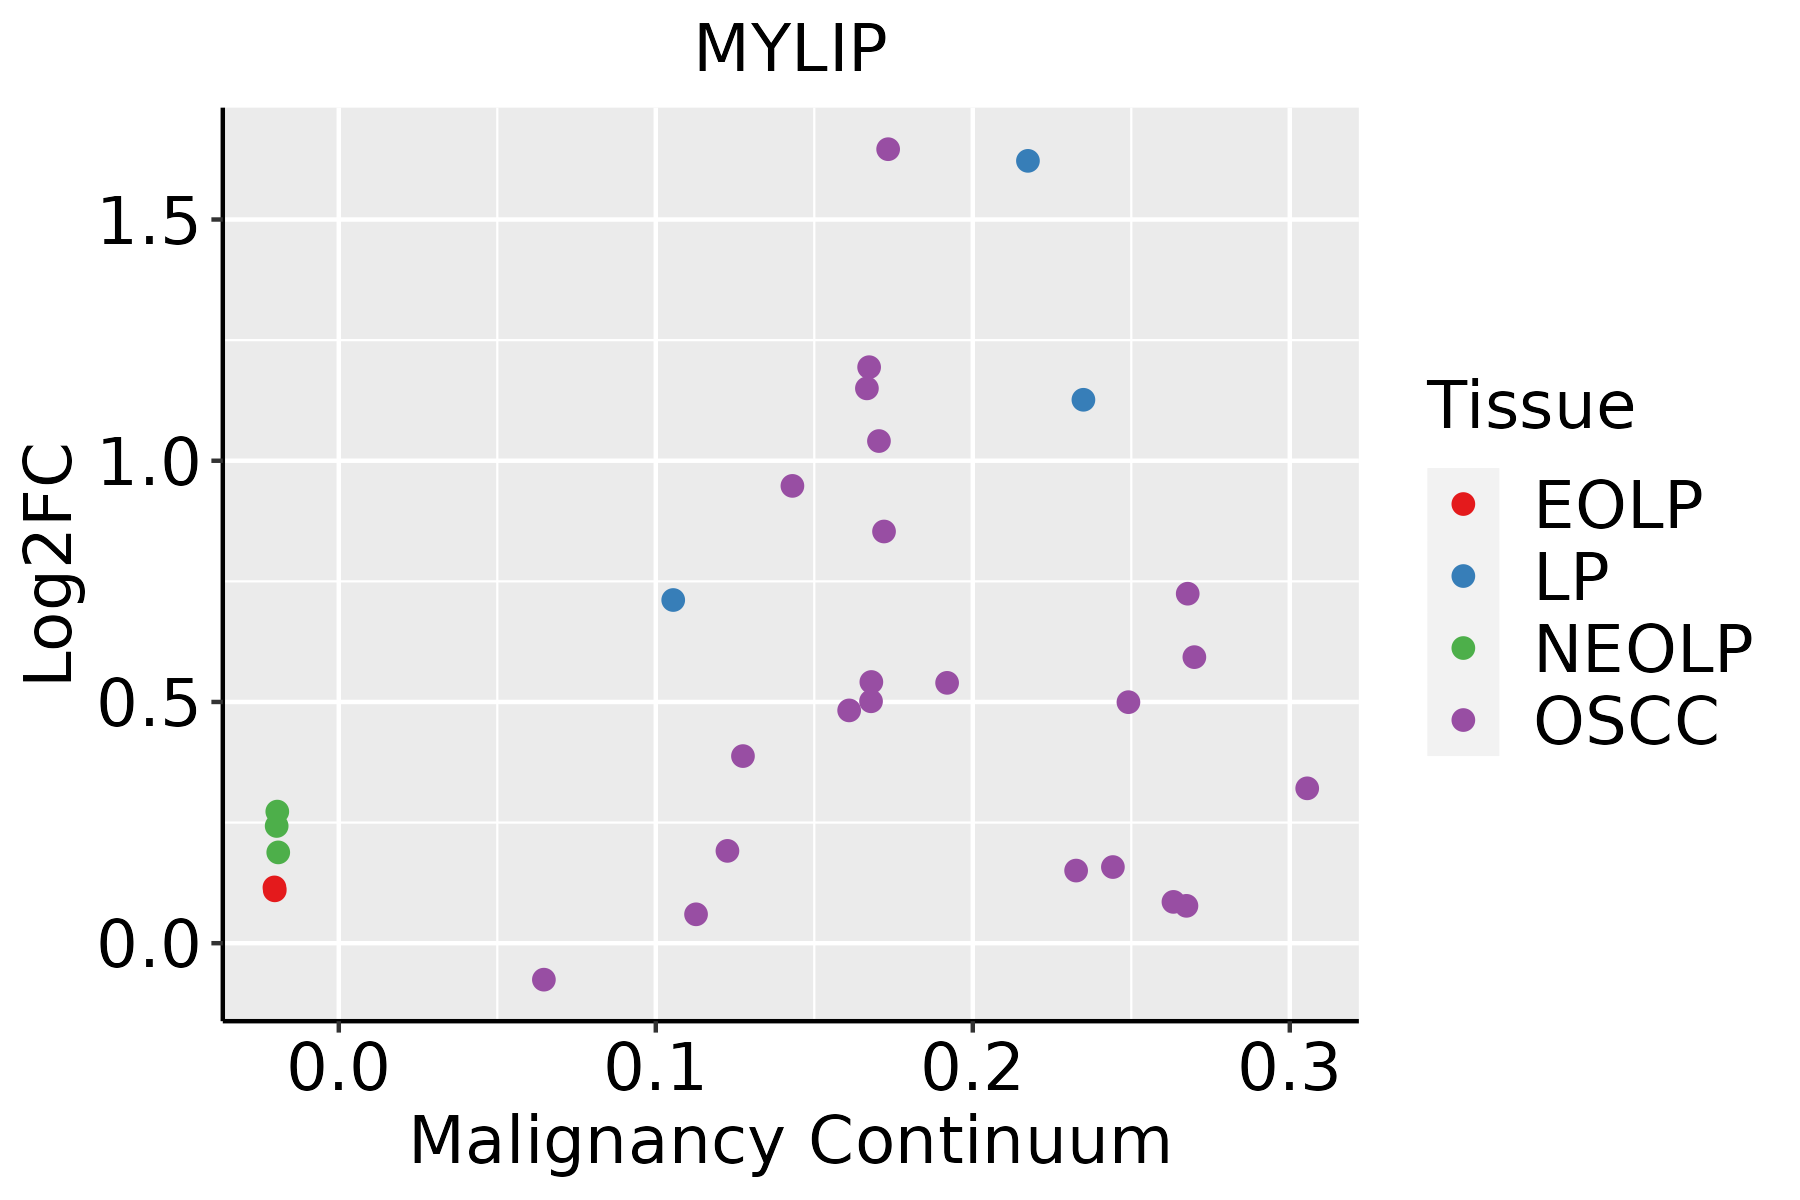
EOLP: Erosive Oral lichen planus
LP: leukoplakia
NEOLP: Non-erosive oral lichen planus
OSCC: Oral squamous cell carcinoma
ProstateThe image shows the transcriptomic changes along malignancy continuum.log2FC in expression of this searched gene in stem-like cells from each diseased tissue sample relative to stem-like cells in normal samples in each tissue plotted against the malignancy continuum. Samples are colored based on if they are from different disease stage.BPH: Benign Prostatic Hyperplasia
ThyroidThe image shows the transcriptomic changes along malignancy continuum.log2FC in expression of this searched gene in stem-like cells from each diseased tissue sample relative to stem-like cells in normal samples in each tissue plotted against the malignancy continuum. Samples are colored based on if they are from different disease stage.
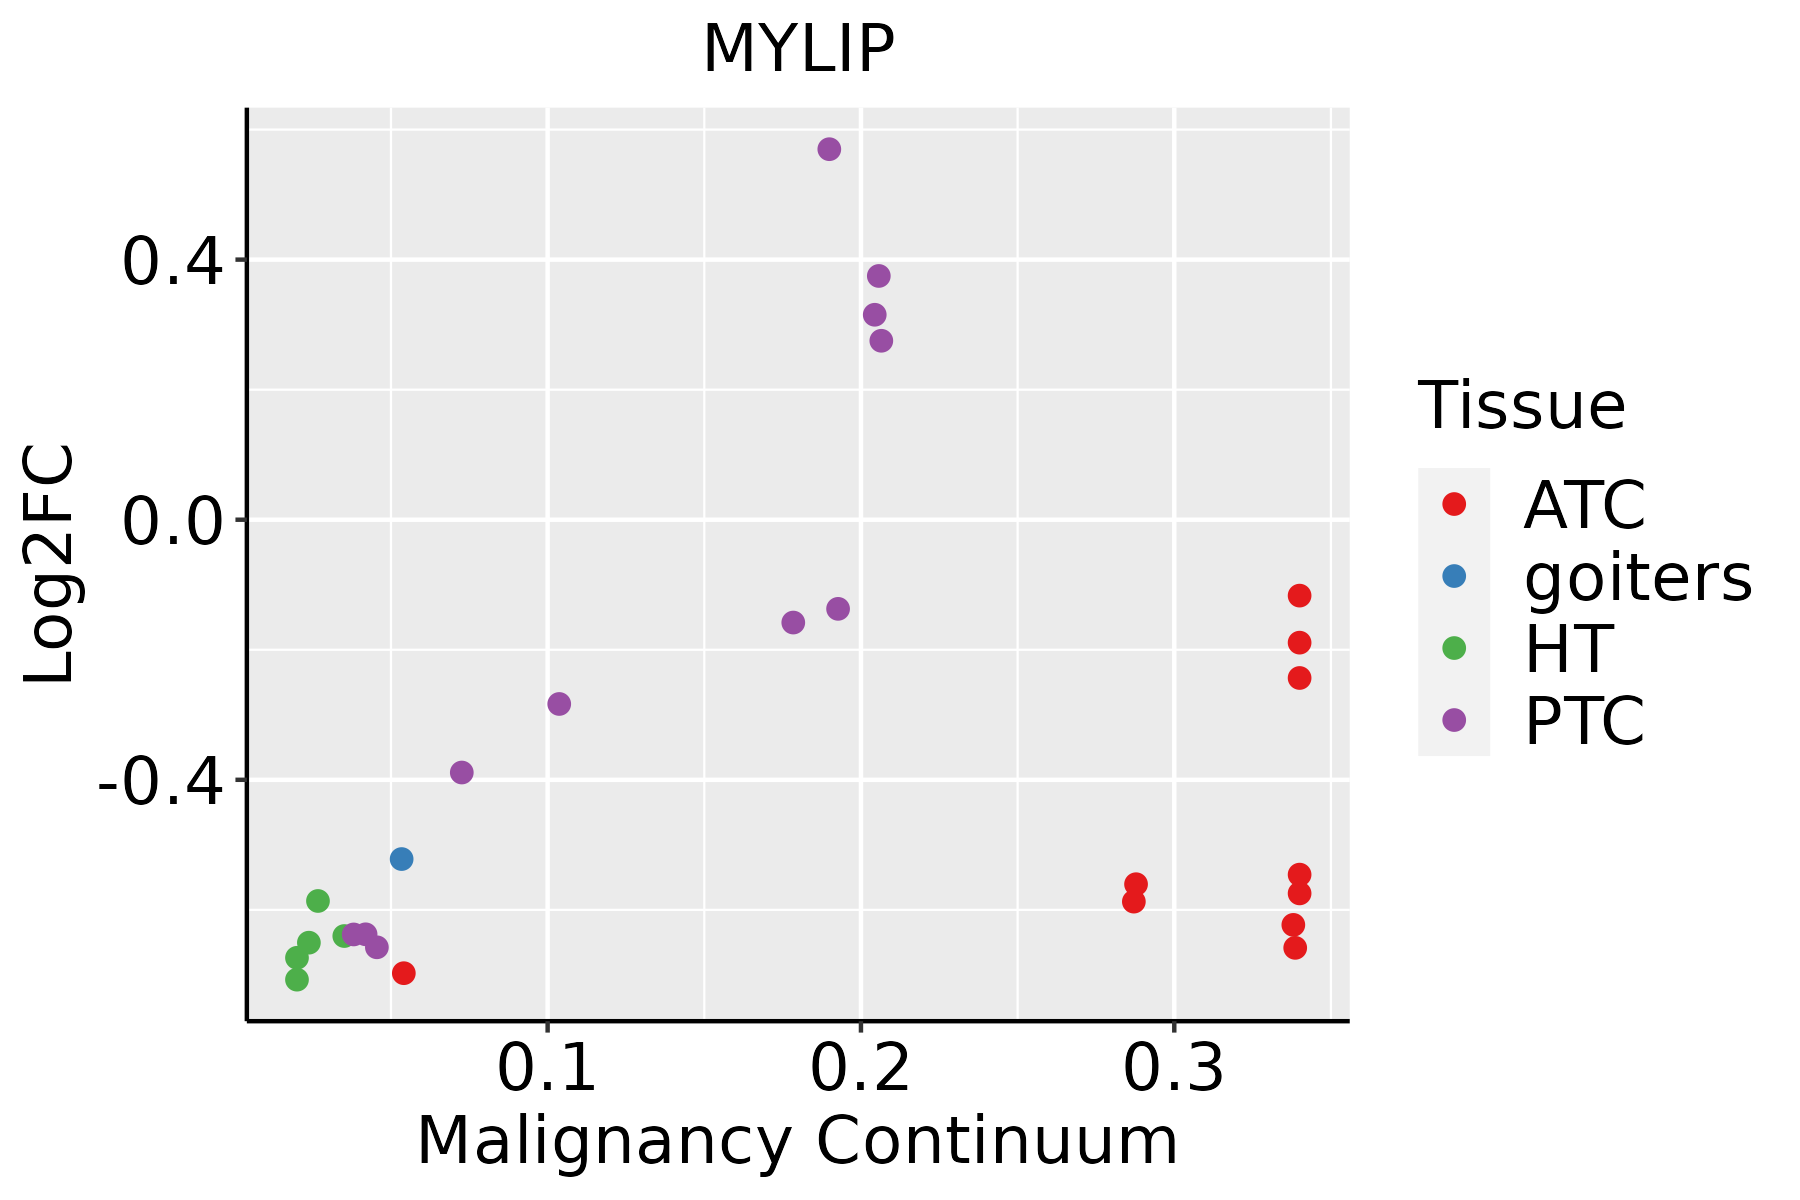
ATC: Anaplastic thyroid cancer
HT: Hashimoto's thyroiditis
PTC: Papillary thyroid cancer
∗log2FC in expression of this searched gene in stem-like cells from each diseased tissue sample relative to stem-like cells in normal samples in each tissue plotted against the malignancy continuum. Samples are colored based on if they are from different disease stage.

Top

Malignant transformation related pathway analysis

check buttonFind out the enriched GO biological processes and KEGG pathways involved in transition from healthy to precancer to cancer
check button Figure of enriched GO biological processes.
TissueDisease StageEnriched GO biological Processes
ColorectumADGO analysis - Figure of enriched GO biological processes: Top 15 enriched GO BP terms are showed in the bar plot of each disease state in each tissue. Each row represents a significant GO biological process which is colored according to the -log10(p.adjust).
ColorectumSERGO analysis - Figure of enriched GO biological processes: Top 15 enriched GO BP terms are showed in the bar plot of each disease state in each tissue. Each row represents a significant GO biological process which is colored according to the -log10(p.adjust).
ColorectumMSSGO analysis - Figure of enriched GO biological processes: Top 15 enriched GO BP terms are showed in the bar plot of each disease state in each tissue. Each row represents a significant GO biological process which is colored according to the -log10(p.adjust).
ColorectumMSI-HGO analysis - Figure of enriched GO biological processes: Top 15 enriched GO BP terms are showed in the bar plot of each disease state in each tissue. Each row represents a significant GO biological process which is colored according to the -log10(p.adjust).
ColorectumFAPGO analysis - Figure of enriched GO biological processes: Top 15 enriched GO BP terms are showed in the bar plot of each disease state in each tissue. Each row represents a significant GO biological process which is colored according to the -log10(p.adjust).
∗Top 15 enriched GO BP terms are showed in the bar plot of each disease state in each tissue. Each row represents a significant GO biological process which is colored according to the -log10(p.adjust).
Page: 1 2 3 4 5 6 7 8 9 

check button Enriched GO biological processes.
GO IDTissueDisease StageDescriptionGene RatioBg Ratiopvaluep.adjustCount
GO:001097521Oral cavityNEOLPregulation of neuron projection development77/2005445/187231.44e-052.53e-0477
GO:003280121Oral cavityNEOLPreceptor catabolic process10/200528/187234.13e-043.82e-0310
GO:200064421Oral cavityNEOLPregulation of receptor catabolic process6/200511/187234.29e-043.91e-036
GO:003134531Oral cavityNEOLPnegative regulation of cell projection organization33/2005186/187232.50e-031.58e-0233
GO:00109777Oral cavityNEOLPnegative regulation of neuron projection development24/2005137/187231.05e-024.88e-0224
GO:004217618ProstateBPHregulation of protein catabolic process139/3107391/187233.71e-203.28e-17139
GO:003164718ProstateBPHregulation of protein stability111/3107298/187234.58e-181.42e-15111
GO:000989618ProstateBPHpositive regulation of catabolic process156/3107492/187234.50e-171.11e-14156
GO:190336218ProstateBPHregulation of cellular protein catabolic process93/3107255/187231.06e-141.40e-1293
GO:004573218ProstateBPHpositive regulation of protein catabolic process82/3107231/187232.08e-121.72e-1082
GO:00109759ProstateBPHregulation of neuron projection development118/3107445/187235.85e-081.57e-06118
GO:00431129ProstateBPHreceptor metabolic process51/3107166/187234.49e-066.71e-0551
GO:00313457ProstateBPHnegative regulation of cell projection organization47/3107186/187231.61e-039.33e-0347
GO:00109776ProstateBPHnegative regulation of neuron projection development36/3107137/187232.64e-031.41e-0236
GO:00328013ProstateBPHreceptor catabolic process11/310728/187233.51e-031.79e-0211
GO:20006442ProstateBPHregulation of receptor catabolic process6/310711/187234.49e-032.19e-026
GO:004217619ProstateTumorregulation of protein catabolic process142/3246391/187239.32e-205.79e-17142
GO:003164719ProstateTumorregulation of protein stability112/3246298/187234.18e-171.18e-14112
GO:000989619ProstateTumorpositive regulation of catabolic process155/3246492/187235.62e-158.52e-13155
GO:190336219ProstateTumorregulation of cellular protein catabolic process95/3246255/187231.92e-142.54e-1295
Page: 1 2 3 4 5 6 7 8 9 

check button Enriched KEGG pathways.
Pathway IDTissueDisease StageDescriptionGene RatioBg Ratiopvaluep.adjustqvalueCount
hsa049792LiverCirrhoticCholesterol metabolism30/253051/84651.59e-051.39e-048.60e-0530
hsa049793LiverCirrhoticCholesterol metabolism30/253051/84651.59e-051.39e-048.60e-0530
hsa049794LiverHCCCholesterol metabolism41/402051/84651.33e-061.35e-057.49e-0641
hsa049795LiverHCCCholesterol metabolism41/402051/84651.33e-061.35e-057.49e-0641
Page: 1 

Top

Cell-cell communication analysis

check buttonIdentification of potential cell-cell interactions between two cell types and their ligand-receptor pairs for different disease states
LigandReceptorLRpairPathwayTissueDisease Stage
Page: 1 

Top

Single-cell gene regulatory network inference analysis

check buttonFind out the significant the regulons (TFs) and the target genes of each regulon across cell types for different disease states
TFCell TypeTissueDisease StageTarget GeneRSSRegulon Activity
∗The dot plots of a searched regulon are shown for all cell subpopulations in each disease state of each tissue based on the regulon specific score inferred using pySCENIC and by calculating the average expression.
Page: 1 

Top

Somatic mutation of malignant transformation related genes

check buttonAnnotation of somatic variants for genes involved in malignant transformation
Hugo SymbolVariant ClassVariant ClassificationdbSNP RSHGVScHGVSpHGVSp ShortSWISSPROTBIOTYPESIFTPolyPhenTumor Sample BarcodeTissueHistologySexAgeStageTherapy TypesDrugsOutcome
MYLIPSNVMissense_Mutationc.1078N>Ap.Cys360Serp.C360SQ8WY64protein_codingtolerated(0.32)benign(0.091)TCGA-D8-A1XS-01Breastbreast invasive carcinomaMale<65III/IVChemotherapyadriamycin+cyclophosphamideSD
MYLIPSNVMissense_Mutationc.568N>Tp.His190Tyrp.H190YQ8WY64protein_codingtolerated(0.15)probably_damaging(0.988)TCGA-GM-A3NW-01Breastbreast invasive carcinomaFemale<65I/IIChemotherapyfluorouracilSD
MYLIPinsertionFrame_Shift_Insnovelc.1126_1127insGTp.Glu376GlyfsTer7p.E376Gfs*7Q8WY64protein_codingTCGA-AN-A0FK-01Breastbreast invasive carcinomaFemale>=65III/IVUnknownUnknownSD
MYLIPinsertionIn_Frame_Insnovelc.1127_1128insTACAACTAGGAGGGGCTTAAACAGGATp.Glu376delinsAspThrThrArgArgGlyLeuAsnArgMetp.E376delinsDTTRRGLNRMQ8WY64protein_codingTCGA-AN-A0FK-01Breastbreast invasive carcinomaFemale>=65III/IVUnknownUnknownSD
MYLIPinsertionNonsense_Mutationnovelc.1093_1094insGATAp.Leu366Terp.L366*Q8WY64protein_codingTCGA-AO-A0JB-01Breastbreast invasive carcinomaFemale<65III/IVChemotherapycyclophosphamideSD
MYLIPdeletionFrame_Shift_Delnovelc.492delNp.Thr166ProfsTer22p.T166Pfs*22Q8WY64protein_codingTCGA-D8-A27V-01Breastbreast invasive carcinomaFemale<65I/IIHormone TherapytamoxiphenSD
MYLIPSNVMissense_Mutationnovelc.4C>Ap.Leu2Metp.L2MQ8WY64protein_codingtolerated(0.12)possibly_damaging(0.879)TCGA-2W-A8YY-01Cervixcervical & endocervical cancerFemale<65I/IIChemotherapycisplatinCR
MYLIPSNVMissense_Mutationnovelc.889G>Ap.Ala297Thrp.A297TQ8WY64protein_codingtolerated(0.07)probably_damaging(0.989)TCGA-EA-A410-01Cervixcervical & endocervical cancerFemale<65I/IIUnknownUnknownSD
MYLIPSNVMissense_Mutationc.160N>Gp.Leu54Valp.L54VQ8WY64protein_codingtolerated(0.07)probably_damaging(0.994)TCGA-CA-6717-01Colorectumcolon adenocarcinomaMale<65I/IIChemotherapyoxaliplatinCR
MYLIPSNVMissense_Mutationc.1184N>Ap.Ile395Asnp.I395NQ8WY64protein_codingdeleterious(0)possibly_damaging(0.776)TCGA-D5-6928-01Colorectumcolon adenocarcinomaMale>=65I/IIUnknownUnknownSD
Page: 1 2 3 4 5 

Top

Related drugs of malignant transformation related genes

check buttonIdentification of chemicals and drugs interact with genes involved in malignant transfromation
(DGIdb 4.0)
Entrez IDSymbolCategoryInteraction TypesDrug Claim NameDrug NamePMIDs
29116MYLIPENZYMEatorvastatinATORVASTATIN25171759
Page: 1