
|
|||||
|
 | |
| |
| |
| |
| |
| |
|
Gene: MYD88 |
Gene summary for MYD88 |
| Gene information | Species | Human | Gene symbol | MYD88 | Gene ID | 4615 |
| Gene name | MYD88 innate immune signal transduction adaptor | |
| Gene Alias | IMD68 | |
| Cytomap | 3p22.2 | |
| Gene Type | protein-coding | GO ID | GO:0000165 | UniProtAcc | Q99836 |
Top |
Malignant transformation analysis |
| Identification of the aberrant gene expression in precancerous and cancerous lesions by comparing the gene expression of stem-like cells in diseased tissues with normal stem cells |
| Entrez ID | Symbol | Replicates | Species | Organ | Tissue | Adj P-value | Log2FC | Malignancy |
| 4615 | MYD88 | HTA11_3410_2000001011 | Human | Colorectum | AD | 9.76e-04 | 9.51e-02 | 0.0155 |
| 4615 | MYD88 | HTA11_2487_2000001011 | Human | Colorectum | SER | 4.50e-07 | 2.75e-01 | -0.1808 |
| 4615 | MYD88 | HTA11_78_2000001011 | Human | Colorectum | AD | 6.63e-03 | 1.42e-01 | -0.1088 |
| 4615 | MYD88 | HTA11_347_2000001011 | Human | Colorectum | AD | 9.31e-11 | 2.30e-01 | -0.1954 |
| 4615 | MYD88 | HTA11_696_2000001011 | Human | Colorectum | AD | 6.42e-05 | 2.31e-01 | -0.1464 |
| 4615 | MYD88 | HTA11_1391_2000001011 | Human | Colorectum | AD | 2.69e-12 | 4.14e-01 | -0.059 |
| 4615 | MYD88 | HTA11_2992_2000001011 | Human | Colorectum | SER | 4.60e-02 | 2.62e-01 | -0.1706 |
| 4615 | MYD88 | HTA11_5212_2000001011 | Human | Colorectum | AD | 3.51e-11 | 5.70e-01 | -0.2061 |
| 4615 | MYD88 | HTA11_866_3004761011 | Human | Colorectum | AD | 3.80e-05 | 1.91e-01 | 0.096 |
| 4615 | MYD88 | HTA11_7696_3000711011 | Human | Colorectum | AD | 2.43e-03 | 1.65e-01 | 0.0674 |
| 4615 | MYD88 | HTA11_99999970781_79442 | Human | Colorectum | MSS | 1.76e-08 | 2.51e-01 | 0.294 |
| 4615 | MYD88 | HTA11_99999965104_69814 | Human | Colorectum | MSS | 2.33e-03 | 1.54e-01 | 0.281 |
| 4615 | MYD88 | HTA11_99999971662_82457 | Human | Colorectum | MSS | 1.73e-07 | 2.81e-01 | 0.3859 |
| 4615 | MYD88 | HTA11_99999973899_84307 | Human | Colorectum | MSS | 1.36e-05 | 2.86e-01 | 0.2585 |
| 4615 | MYD88 | LZE4T | Human | Esophagus | ESCC | 2.24e-04 | 8.61e-02 | 0.0811 |
| 4615 | MYD88 | LZE7T | Human | Esophagus | ESCC | 3.70e-06 | 1.70e-01 | 0.0667 |
| 4615 | MYD88 | LZE20T | Human | Esophagus | ESCC | 3.15e-04 | 6.79e-02 | 0.0662 |
| 4615 | MYD88 | LZE22T | Human | Esophagus | ESCC | 6.68e-03 | 1.84e-01 | 0.068 |
| 4615 | MYD88 | LZE24T | Human | Esophagus | ESCC | 5.92e-12 | 4.54e-01 | 0.0596 |
| 4615 | MYD88 | LZE21T | Human | Esophagus | ESCC | 2.49e-03 | 1.57e-01 | 0.0655 |
| Page: 1 2 3 4 5 6 |
| Tissue | Expression Dynamics | Abbreviation |
| Colorectum (GSE201348) |  | FAP: Familial adenomatous polyposis |
| CRC: Colorectal cancer | ||
| Colorectum (HTA11) |  | AD: Adenomas |
| SER: Sessile serrated lesions | ||
| MSI-H: Microsatellite-high colorectal cancer | ||
| MSS: Microsatellite stable colorectal cancer | ||
| Esophagus | 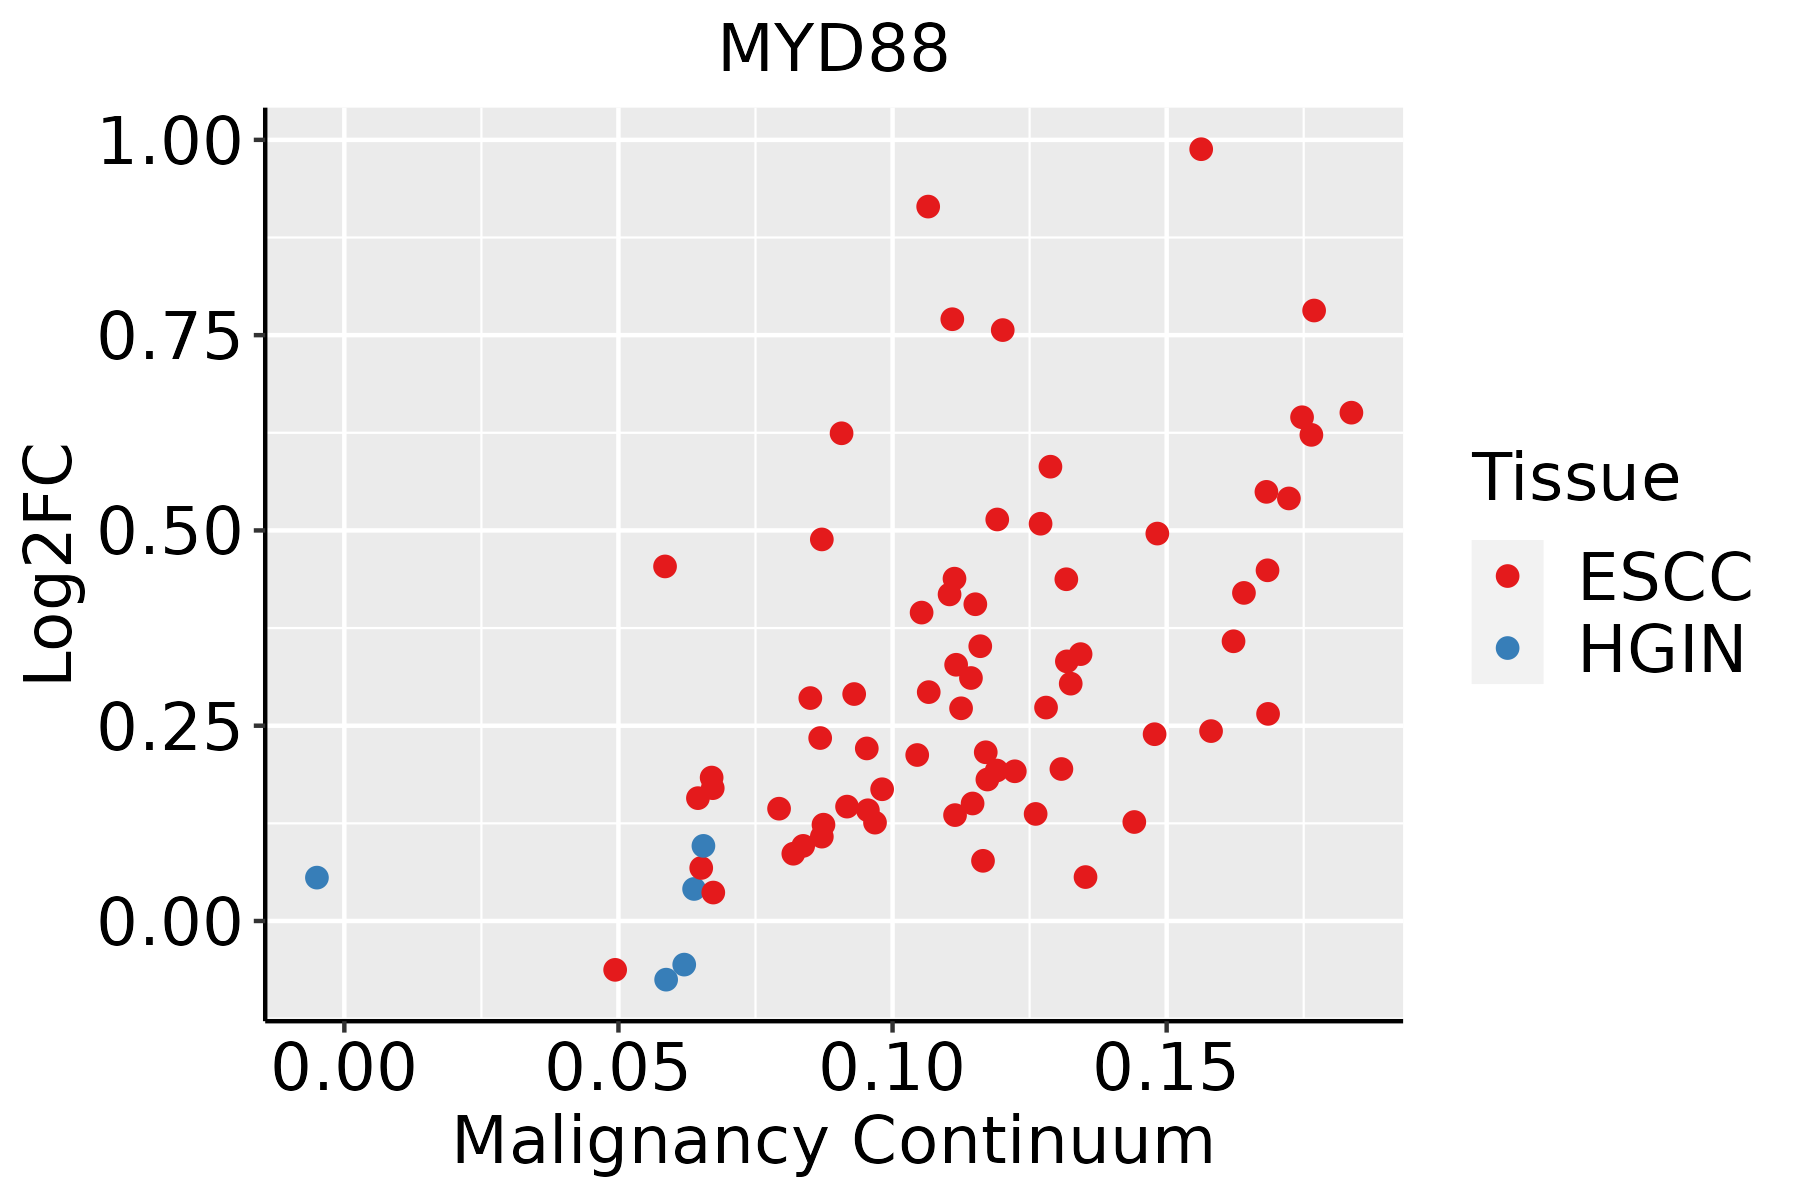 | ESCC: Esophageal squamous cell carcinoma |
| HGIN: High-grade intraepithelial neoplasias | ||
| LGIN: Low-grade intraepithelial neoplasias | ||
| Liver |  | HCC: Hepatocellular carcinoma |
| NAFLD: Non-alcoholic fatty liver disease | ||
| Oral Cavity | 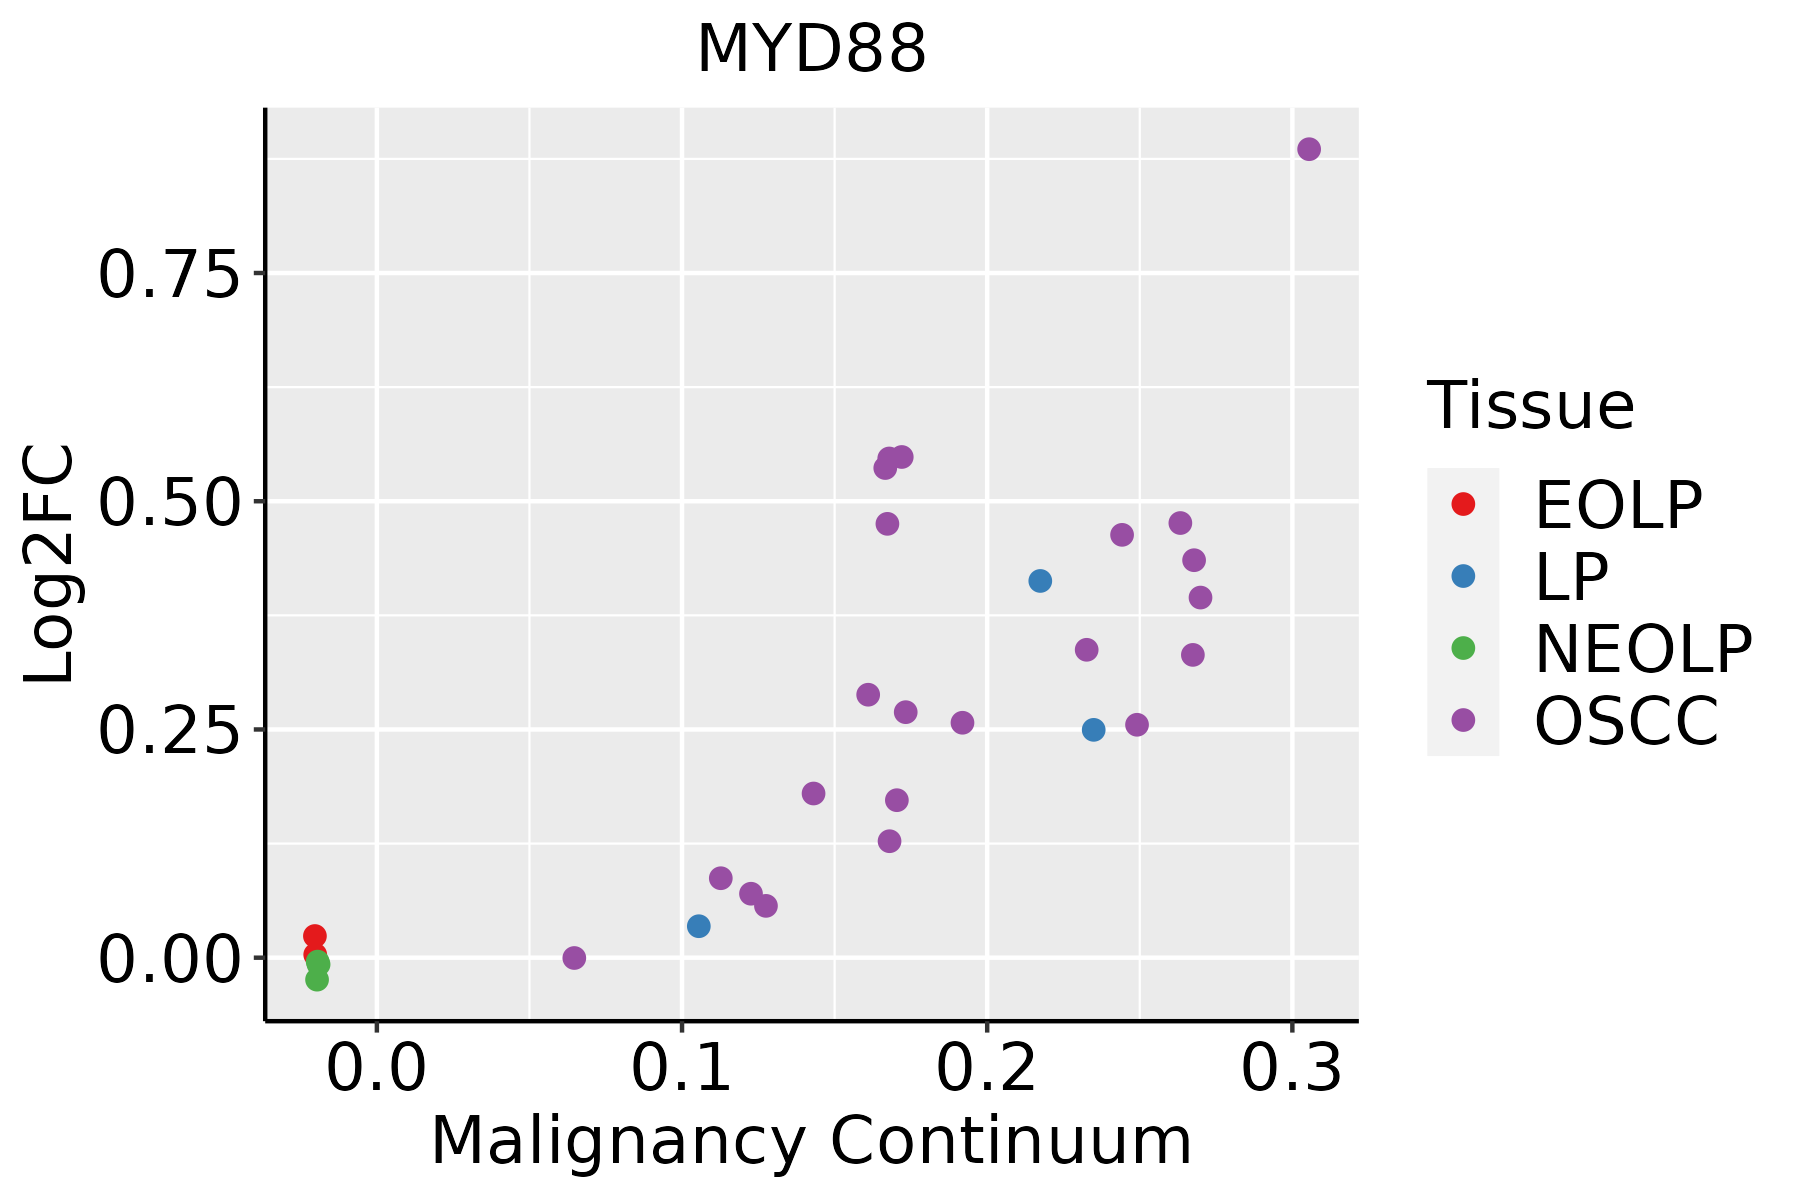 | EOLP: Erosive Oral lichen planus |
| LP: leukoplakia | ||
| NEOLP: Non-erosive oral lichen planus | ||
| OSCC: Oral squamous cell carcinoma | ||
| Skin | 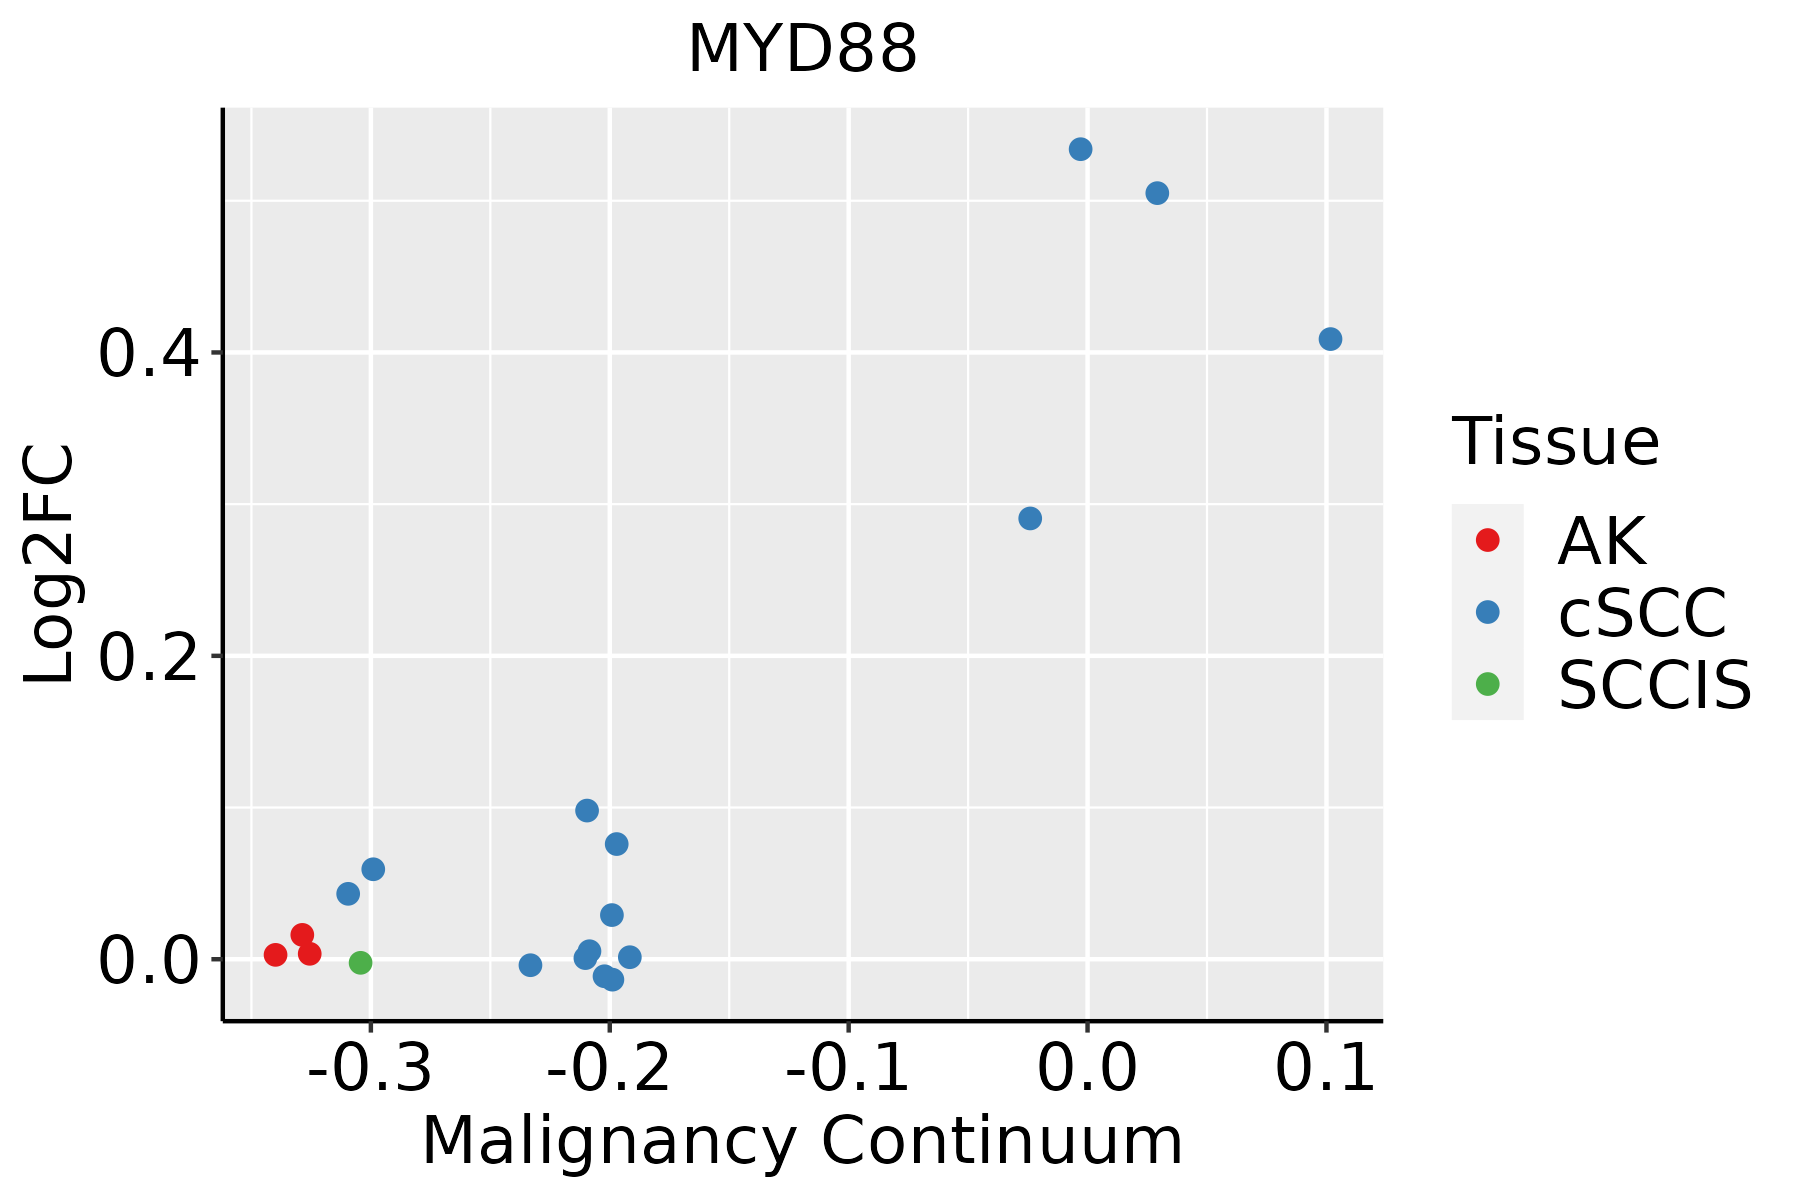 | AK: Actinic keratosis |
| cSCC: Cutaneous squamous cell carcinoma | ||
| SCCIS:squamous cell carcinoma in situ |
| ∗log2FC in expression of this searched gene in stem-like cells from each diseased tissue sample relative to stem-like cells in normal samples in each tissue plotted against the malignancy continuum. Samples are colored based on if they are from different disease stage. |
Top |
Malignant transformation related pathway analysis |
| Find out the enriched GO biological processes and KEGG pathways involved in transition from healthy to precancer to cancer |
| Tissue | Disease Stage | Enriched GO biological Processes |
| Colorectum | AD |  |
| Colorectum | SER |  |
| Colorectum | MSS |  |
| Colorectum | MSI-H |  |
| Colorectum | FAP |  |
| ∗Top 15 enriched GO BP terms are showed in the bar plot of each disease state in each tissue. Each row represents a significant GO biological process which is colored according to the -log10(p.adjust). |
| Page: 1 2 3 4 5 6 7 8 9 |
| GO ID | Tissue | Disease Stage | Description | Gene Ratio | Bg Ratio | pvalue | p.adjust | Count |
| GO:004670018 | Esophagus | ESCC | heterocycle catabolic process | 286/8552 | 445/18723 | 1.12e-15 | 7.47e-14 | 286 |
| GO:004427019 | Esophagus | ESCC | cellular nitrogen compound catabolic process | 288/8552 | 451/18723 | 3.03e-15 | 1.79e-13 | 288 |
| GO:0071496111 | Esophagus | ESCC | cellular response to external stimulus | 215/8552 | 320/18723 | 4.29e-15 | 2.43e-13 | 215 |
| GO:001943918 | Esophagus | ESCC | aromatic compound catabolic process | 295/8552 | 467/18723 | 1.09e-14 | 5.98e-13 | 295 |
| GO:0031334111 | Esophagus | ESCC | positive regulation of protein-containing complex assembly | 166/8552 | 237/18723 | 2.06e-14 | 1.07e-12 | 166 |
| GO:000961518 | Esophagus | ESCC | response to virus | 238/8552 | 367/18723 | 6.65e-14 | 3.32e-12 | 238 |
| GO:190136118 | Esophagus | ESCC | organic cyclic compound catabolic process | 307/8552 | 495/18723 | 9.99e-14 | 4.80e-12 | 307 |
| GO:004312318 | Esophagus | ESCC | positive regulation of I-kappaB kinase/NF-kappaB signaling | 132/8552 | 186/18723 | 2.07e-12 | 8.58e-11 | 132 |
| GO:0043122110 | Esophagus | ESCC | regulation of I-kappaB kinase/NF-kappaB signaling | 167/8552 | 249/18723 | 6.11e-12 | 2.32e-10 | 167 |
| GO:000724919 | Esophagus | ESCC | I-kappaB kinase/NF-kappaB signaling | 183/8552 | 281/18723 | 3.02e-11 | 1.01e-09 | 183 |
| GO:0044403111 | Esophagus | ESCC | biological process involved in symbiotic interaction | 186/8552 | 290/18723 | 1.43e-10 | 4.16e-09 | 186 |
| GO:0009895111 | Esophagus | ESCC | negative regulation of catabolic process | 201/8552 | 320/18723 | 3.88e-10 | 1.05e-08 | 201 |
| GO:00516075 | Esophagus | ESCC | defense response to virus | 171/8552 | 265/18723 | 3.91e-10 | 1.05e-08 | 171 |
| GO:01405465 | Esophagus | ESCC | defense response to symbiont | 171/8552 | 265/18723 | 3.91e-10 | 1.05e-08 | 171 |
| GO:006101319 | Esophagus | ESCC | regulation of mRNA catabolic process | 115/8552 | 166/18723 | 5.90e-10 | 1.49e-08 | 115 |
| GO:007121419 | Esophagus | ESCC | cellular response to abiotic stimulus | 206/8552 | 331/18723 | 7.52e-10 | 1.88e-08 | 206 |
| GO:010400419 | Esophagus | ESCC | cellular response to environmental stimulus | 206/8552 | 331/18723 | 7.52e-10 | 1.88e-08 | 206 |
| GO:004348719 | Esophagus | ESCC | regulation of RNA stability | 117/8552 | 170/18723 | 7.91e-10 | 1.94e-08 | 117 |
| GO:004348819 | Esophagus | ESCC | regulation of mRNA stability | 109/8552 | 158/18723 | 2.40e-09 | 5.35e-08 | 109 |
| GO:0031330111 | Esophagus | ESCC | negative regulation of cellular catabolic process | 166/8552 | 262/18723 | 5.17e-09 | 1.08e-07 | 166 |
| Page: 1 2 3 4 5 6 7 8 9 10 11 12 13 14 15 16 17 18 19 |
| Pathway ID | Tissue | Disease Stage | Description | Gene Ratio | Bg Ratio | pvalue | p.adjust | qvalue | Count |
| hsa05171 | Colorectum | AD | Coronavirus disease - COVID-19 | 113/2092 | 232/8465 | 9.90e-16 | 2.55e-14 | 1.63e-14 | 113 |
| hsa05131 | Colorectum | AD | Shigellosis | 109/2092 | 247/8465 | 1.09e-11 | 2.44e-10 | 1.55e-10 | 109 |
| hsa05132 | Colorectum | AD | Salmonella infection | 102/2092 | 249/8465 | 7.65e-09 | 1.28e-07 | 8.17e-08 | 102 |
| hsa05130 | Colorectum | AD | Pathogenic Escherichia coli infection | 79/2092 | 197/8465 | 1.05e-06 | 1.36e-05 | 8.65e-06 | 79 |
| hsa05135 | Colorectum | AD | Yersinia infection | 58/2092 | 137/8465 | 3.90e-06 | 4.35e-05 | 2.78e-05 | 58 |
| hsa05417 | Colorectum | AD | Lipid and atherosclerosis | 73/2092 | 215/8465 | 1.31e-03 | 8.27e-03 | 5.27e-03 | 73 |
| hsa05170 | Colorectum | AD | Human immunodeficiency virus 1 infection | 72/2092 | 212/8465 | 1.40e-03 | 8.46e-03 | 5.39e-03 | 72 |
| hsa051711 | Colorectum | AD | Coronavirus disease - COVID-19 | 113/2092 | 232/8465 | 9.90e-16 | 2.55e-14 | 1.63e-14 | 113 |
| hsa051311 | Colorectum | AD | Shigellosis | 109/2092 | 247/8465 | 1.09e-11 | 2.44e-10 | 1.55e-10 | 109 |
| hsa051321 | Colorectum | AD | Salmonella infection | 102/2092 | 249/8465 | 7.65e-09 | 1.28e-07 | 8.17e-08 | 102 |
| hsa051301 | Colorectum | AD | Pathogenic Escherichia coli infection | 79/2092 | 197/8465 | 1.05e-06 | 1.36e-05 | 8.65e-06 | 79 |
| hsa051351 | Colorectum | AD | Yersinia infection | 58/2092 | 137/8465 | 3.90e-06 | 4.35e-05 | 2.78e-05 | 58 |
| hsa054171 | Colorectum | AD | Lipid and atherosclerosis | 73/2092 | 215/8465 | 1.31e-03 | 8.27e-03 | 5.27e-03 | 73 |
| hsa051701 | Colorectum | AD | Human immunodeficiency virus 1 infection | 72/2092 | 212/8465 | 1.40e-03 | 8.46e-03 | 5.39e-03 | 72 |
| hsa051712 | Colorectum | SER | Coronavirus disease - COVID-19 | 98/1580 | 232/8465 | 3.33e-17 | 8.50e-16 | 6.17e-16 | 98 |
| hsa051312 | Colorectum | SER | Shigellosis | 87/1580 | 247/8465 | 3.07e-10 | 7.27e-09 | 5.28e-09 | 87 |
| hsa051322 | Colorectum | SER | Salmonella infection | 77/1580 | 249/8465 | 1.56e-06 | 2.35e-05 | 1.71e-05 | 77 |
| hsa051302 | Colorectum | SER | Pathogenic Escherichia coli infection | 60/1580 | 197/8465 | 3.63e-05 | 4.31e-04 | 3.13e-04 | 60 |
| hsa051352 | Colorectum | SER | Yersinia infection | 43/1580 | 137/8465 | 2.15e-04 | 2.10e-03 | 1.52e-03 | 43 |
| hsa051702 | Colorectum | SER | Human immunodeficiency virus 1 infection | 58/1580 | 212/8465 | 1.08e-03 | 8.56e-03 | 6.21e-03 | 58 |
| Page: 1 2 3 4 5 6 7 8 |
Top |
Cell-cell communication analysis |
| Identification of potential cell-cell interactions between two cell types and their ligand-receptor pairs for different disease states |
| Ligand | Receptor | LRpair | Pathway | Tissue | Disease Stage |
| Page: 1 |
Top |
Single-cell gene regulatory network inference analysis |
| Find out the significant the regulons (TFs) and the target genes of each regulon across cell types for different disease states |
| TF | Cell Type | Tissue | Disease Stage | Target Gene | RSS | Regulon Activity |
| ∗The dot plots of a searched regulon are shown for all cell subpopulations in each disease state of each tissue based on the regulon specific score inferred using pySCENIC and by calculating the average expression. |
| Page: 1 |
Top |
Somatic mutation of malignant transformation related genes |
| Annotation of somatic variants for genes involved in malignant transformation |
| Hugo Symbol | Variant Class | Variant Classification | dbSNP RS | HGVSc | HGVSp | HGVSp Short | SWISSPROT | BIOTYPE | SIFT | PolyPhen | Tumor Sample Barcode | Tissue | Histology | Sex | Age | Stage | Therapy Types | Drugs | Outcome |
| MYD88 | SNV | Missense_Mutation | novel | c.64N>A | p.Gly22Arg | p.G22R | protein_coding | tolerated(0.09) | benign(0.003) | TCGA-MA-AA3X-01 | Cervix | cervical & endocervical cancer | Female | <65 | III/IV | Chemotherapy | cisplatin | CR | |
| MYD88 | SNV | Missense_Mutation | rs147683404 | c.624N>G | p.Asp208Glu | p.D208E | protein_coding | tolerated(0.09) | probably_damaging(0.975) | TCGA-AA-3710-01 | Colorectum | colon adenocarcinoma | Female | >=65 | I/II | Unknown | Unknown | SD | |
| MYD88 | SNV | Missense_Mutation | c.127N>T | p.Arg43Trp | p.R43W | protein_coding | deleterious(0) | probably_damaging(1) | TCGA-AU-6004-01 | Colorectum | colon adenocarcinoma | Female | >=65 | I/II | Unknown | Unknown | SD | ||
| MYD88 | SNV | Missense_Mutation | c.557A>C | p.Gln186Pro | p.Q186P | protein_coding | tolerated(0.24) | possibly_damaging(0.576) | TCGA-D5-6928-01 | Colorectum | colon adenocarcinoma | Male | >=65 | I/II | Unknown | Unknown | SD | ||
| MYD88 | SNV | Missense_Mutation | c.833N>G | p.Tyr278Cys | p.Y278C | protein_coding | tolerated(0.15) | probably_damaging(1) | TCGA-AG-A002-01 | Colorectum | rectum adenocarcinoma | Male | <65 | I/II | Unknown | Unknown | SD | ||
| MYD88 | SNV | Missense_Mutation | rs759979054 | c.539N>G | p.Tyr180Cys | p.Y180C | protein_coding | deleterious(0.01) | probably_damaging(0.995) | TCGA-DY-A1DG-01 | Colorectum | rectum adenocarcinoma | Male | >=65 | I/II | Unknown | Unknown | PD | |
| MYD88 | SNV | Missense_Mutation | rs770424976 | c.523G>A | p.Asp175Asn | p.D175N | protein_coding | deleterious(0) | probably_damaging(0.992) | TCGA-A5-A0GP-01 | Endometrium | uterine corpus endometrioid carcinoma | Female | <65 | I/II | Unknown | Unknown | SD | |
| MYD88 | SNV | Missense_Mutation | novel | c.369N>T | p.Glu123Asp | p.E123D | protein_coding | tolerated(0.39) | benign(0.011) | TCGA-AX-A1CE-01 | Endometrium | uterine corpus endometrioid carcinoma | Female | <65 | I/II | Unspecific | Paclitaxel | SD | |
| MYD88 | SNV | Missense_Mutation | novel | c.751N>G | p.Ser251Gly | p.S251G | protein_coding | deleterious(0) | probably_damaging(0.992) | TCGA-AX-A3FT-01 | Endometrium | uterine corpus endometrioid carcinoma | Female | <65 | I/II | Unknown | Unknown | SD | |
| MYD88 | SNV | Missense_Mutation | rs769446050 | c.517C>T | p.Arg173Cys | p.R173C | protein_coding | tolerated(0.29) | benign(0.007) | TCGA-B5-A0JY-01 | Endometrium | uterine corpus endometrioid carcinoma | Female | <65 | III/IV | Chemotherapy | doxorubicin | SD |
| Page: 1 2 3 |
Top |
Related drugs of malignant transformation related genes |
| Identification of chemicals and drugs interact with genes involved in malignant transfromation |
| (DGIdb 4.0) |
| Entrez ID | Symbol | Category | Interaction Types | Drug Claim Name | Drug Name | PMIDs |
| 4615 | MYD88 | CLINICALLY ACTIONABLE | Ibrutinib | IBRUTINIB | ||
| 4615 | MYD88 | CLINICALLY ACTIONABLE | IMO-8400 | BAZLITORAN | ||
| 4615 | MYD88 | CLINICALLY ACTIONABLE | Vorinostat | VORINOSTAT | 27733371 | |
| 4615 | MYD88 | CLINICALLY ACTIONABLE | IBRUTINIB | IBRUTINIB | 25853747 | |
| 4615 | MYD88 | CLINICALLY ACTIONABLE | N/A | 25055137,22944768,26230596,24903481,26792260 | ||
| 4615 | MYD88 | CLINICALLY ACTIONABLE | eFT508 | TOMIVOSERTIB | ||
| 4615 | MYD88 | CLINICALLY ACTIONABLE | fentanyl | FENTANYL | ||
| 4615 | MYD88 | CLINICALLY ACTIONABLE | ST2825 |
| Page: 1 |

Copyright 2023-Present -The University of Texas Health Science Center at Houston |