
|
|||||
|
 | |
| |
| |
| |
| |
| |
|
Gene: MVK |
Gene summary for MVK |
| Gene information | Species | Human | Gene symbol | MVK | Gene ID | 4598 |
| Gene name | mevalonate kinase | |
| Gene Alias | LRBP | |
| Cytomap | 12q24.11 | |
| Gene Type | protein-coding | GO ID | GO:0006066 | UniProtAcc | B2RDU6 |
Top |
Malignant transformation analysis |
| Identification of the aberrant gene expression in precancerous and cancerous lesions by comparing the gene expression of stem-like cells in diseased tissues with normal stem cells |
| Entrez ID | Symbol | Replicates | Species | Organ | Tissue | Adj P-value | Log2FC | Malignancy |
| 4598 | MVK | LZE7T | Human | Esophagus | ESCC | 3.02e-02 | 1.85e-01 | 0.0667 |
| 4598 | MVK | LZE24T | Human | Esophagus | ESCC | 2.31e-05 | 1.95e-01 | 0.0596 |
| 4598 | MVK | P1T-E | Human | Esophagus | ESCC | 2.57e-06 | 2.49e-01 | 0.0875 |
| 4598 | MVK | P2T-E | Human | Esophagus | ESCC | 5.29e-19 | 3.44e-01 | 0.1177 |
| 4598 | MVK | P4T-E | Human | Esophagus | ESCC | 6.17e-14 | 4.22e-01 | 0.1323 |
| 4598 | MVK | P5T-E | Human | Esophagus | ESCC | 1.04e-19 | 3.46e-01 | 0.1327 |
| 4598 | MVK | P8T-E | Human | Esophagus | ESCC | 6.72e-26 | 5.38e-01 | 0.0889 |
| 4598 | MVK | P10T-E | Human | Esophagus | ESCC | 2.00e-21 | 4.53e-01 | 0.116 |
| 4598 | MVK | P11T-E | Human | Esophagus | ESCC | 1.62e-07 | 3.39e-01 | 0.1426 |
| 4598 | MVK | P12T-E | Human | Esophagus | ESCC | 1.32e-07 | 1.86e-01 | 0.1122 |
| 4598 | MVK | P15T-E | Human | Esophagus | ESCC | 4.00e-11 | 2.47e-01 | 0.1149 |
| 4598 | MVK | P16T-E | Human | Esophagus | ESCC | 6.57e-06 | 1.52e-01 | 0.1153 |
| 4598 | MVK | P17T-E | Human | Esophagus | ESCC | 3.62e-04 | 2.12e-01 | 0.1278 |
| 4598 | MVK | P19T-E | Human | Esophagus | ESCC | 4.38e-02 | 3.65e-01 | 0.1662 |
| 4598 | MVK | P20T-E | Human | Esophagus | ESCC | 2.12e-09 | 1.92e-01 | 0.1124 |
| 4598 | MVK | P21T-E | Human | Esophagus | ESCC | 4.85e-24 | 5.76e-01 | 0.1617 |
| 4598 | MVK | P22T-E | Human | Esophagus | ESCC | 1.52e-12 | 2.70e-01 | 0.1236 |
| 4598 | MVK | P23T-E | Human | Esophagus | ESCC | 5.69e-11 | 3.20e-01 | 0.108 |
| 4598 | MVK | P24T-E | Human | Esophagus | ESCC | 8.56e-04 | 1.72e-01 | 0.1287 |
| 4598 | MVK | P26T-E | Human | Esophagus | ESCC | 7.03e-18 | 3.90e-01 | 0.1276 |
| Page: 1 2 3 4 |
| Tissue | Expression Dynamics | Abbreviation |
| Esophagus | 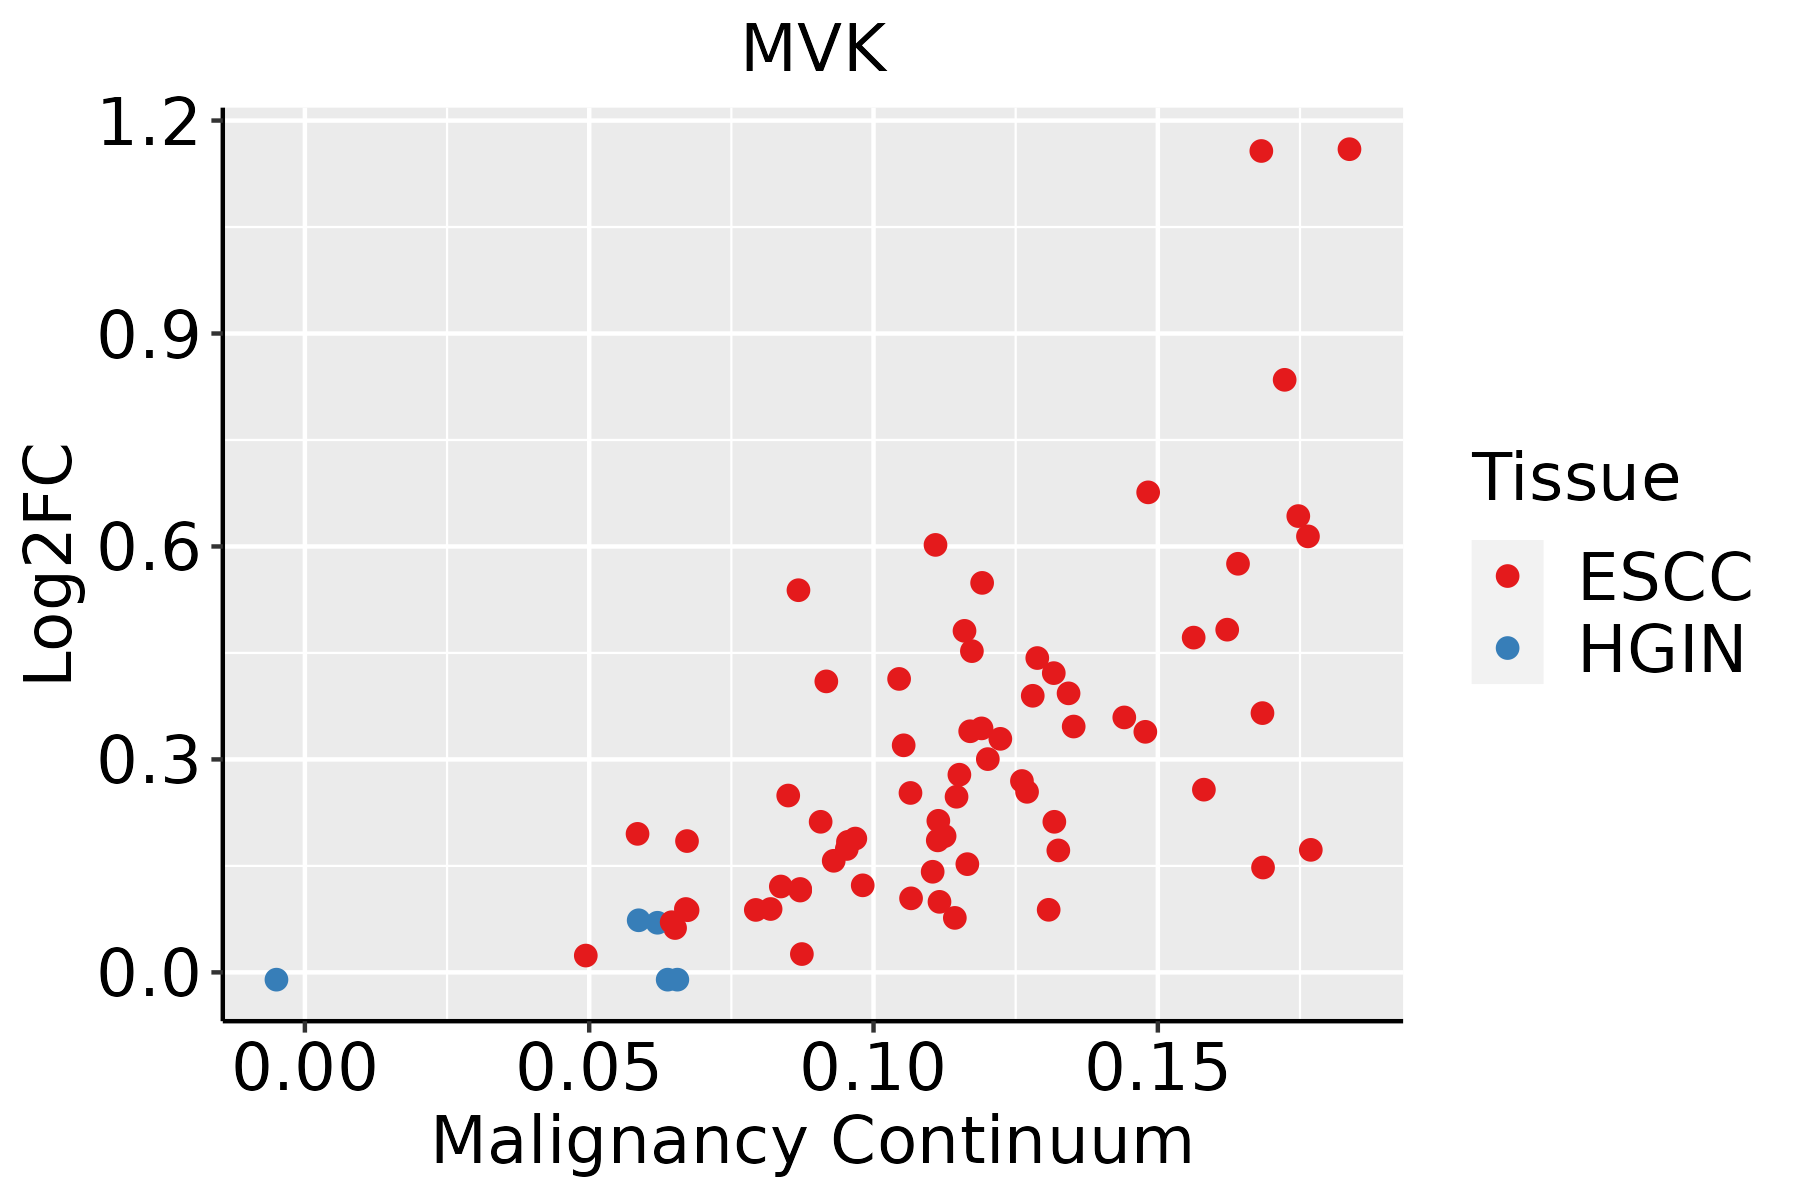 | ESCC: Esophageal squamous cell carcinoma |
| HGIN: High-grade intraepithelial neoplasias | ||
| LGIN: Low-grade intraepithelial neoplasias | ||
| Oral Cavity |  | EOLP: Erosive Oral lichen planus |
| LP: leukoplakia | ||
| NEOLP: Non-erosive oral lichen planus | ||
| OSCC: Oral squamous cell carcinoma |
| ∗log2FC in expression of this searched gene in stem-like cells from each diseased tissue sample relative to stem-like cells in normal samples in each tissue plotted against the malignancy continuum. Samples are colored based on if they are from different disease stage. |
Top |
Malignant transformation related pathway analysis |
| Find out the enriched GO biological processes and KEGG pathways involved in transition from healthy to precancer to cancer |
| Tissue | Disease Stage | Enriched GO biological Processes |
| Colorectum | AD |  |
| Colorectum | SER |  |
| Colorectum | MSS |  |
| Colorectum | MSI-H |  |
| Colorectum | FAP |  |
| ∗Top 15 enriched GO BP terms are showed in the bar plot of each disease state in each tissue. Each row represents a significant GO biological process which is colored according to the -log10(p.adjust). |
| Page: 1 2 3 4 5 6 7 8 9 |
| GO ID | Tissue | Disease Stage | Description | Gene Ratio | Bg Ratio | pvalue | p.adjust | Count |
| GO:000616320 | Oral cavity | OSCC | purine nucleotide metabolic process | 188/7305 | 396/18723 | 3.31e-04 | 2.04e-03 | 188 |
| GO:0008299 | Oral cavity | OSCC | isoprenoid biosynthetic process | 20/7305 | 28/18723 | 5.13e-04 | 2.99e-03 | 20 |
| GO:00066945 | Oral cavity | OSCC | steroid biosynthetic process | 89/7305 | 173/18723 | 5.77e-04 | 3.30e-03 | 89 |
| GO:00082033 | Oral cavity | OSCC | cholesterol metabolic process | 72/7305 | 137/18723 | 8.63e-04 | 4.55e-03 | 72 |
| GO:19016173 | Oral cavity | OSCC | organic hydroxy compound biosynthetic process | 115/7305 | 237/18723 | 1.73e-03 | 8.18e-03 | 115 |
| GO:00161253 | Oral cavity | OSCC | sterol metabolic process | 77/7305 | 152/18723 | 2.26e-03 | 1.00e-02 | 77 |
| GO:00338654 | Oral cavity | OSCC | nucleoside bisphosphate metabolic process | 66/7305 | 128/18723 | 2.58e-03 | 1.13e-02 | 66 |
| GO:00338754 | Oral cavity | OSCC | ribonucleoside bisphosphate metabolic process | 66/7305 | 128/18723 | 2.58e-03 | 1.13e-02 | 66 |
| GO:00340324 | Oral cavity | OSCC | purine nucleoside bisphosphate metabolic process | 66/7305 | 128/18723 | 2.58e-03 | 1.13e-02 | 66 |
| GO:00060842 | Oral cavity | OSCC | acetyl-CoA metabolic process | 22/7305 | 35/18723 | 3.65e-03 | 1.51e-02 | 22 |
| GO:00066445 | Oral cavity | OSCC | phospholipid metabolic process | 175/7305 | 383/18723 | 4.21e-03 | 1.71e-02 | 175 |
| GO:00067203 | Oral cavity | OSCC | isoprenoid metabolic process | 59/7305 | 116/18723 | 6.18e-03 | 2.33e-02 | 59 |
| GO:00066373 | Oral cavity | OSCC | acyl-CoA metabolic process | 50/7305 | 96/18723 | 6.24e-03 | 2.35e-02 | 50 |
| GO:00353833 | Oral cavity | OSCC | thioester metabolic process | 50/7305 | 96/18723 | 6.24e-03 | 2.35e-02 | 50 |
| GO:00082024 | Oral cavity | OSCC | steroid metabolic process | 146/7305 | 319/18723 | 7.78e-03 | 2.85e-02 | 146 |
| GO:000675319 | Oral cavity | LP | nucleoside phosphate metabolic process | 161/4623 | 497/18723 | 5.31e-05 | 7.39e-04 | 161 |
| GO:0009117110 | Oral cavity | LP | nucleotide metabolic process | 158/4623 | 489/18723 | 7.17e-05 | 9.49e-04 | 158 |
| GO:0019693110 | Oral cavity | LP | ribose phosphate metabolic process | 128/4623 | 396/18723 | 3.26e-04 | 3.28e-03 | 128 |
| GO:0072521110 | Oral cavity | LP | purine-containing compound metabolic process | 130/4623 | 416/18723 | 1.30e-03 | 1.05e-02 | 130 |
| GO:190265211 | Oral cavity | LP | secondary alcohol metabolic process | 53/4623 | 147/18723 | 1.35e-03 | 1.08e-02 | 53 |
| Page: 1 2 3 4 5 6 7 8 9 10 |
| Pathway ID | Tissue | Disease Stage | Description | Gene Ratio | Bg Ratio | pvalue | p.adjust | qvalue | Count |
| hsa009005 | Esophagus | ESCC | Terpenoid backbone biosynthesis | 20/4205 | 23/8465 | 2.14e-04 | 7.87e-04 | 4.03e-04 | 20 |
| hsa041467 | Esophagus | ESCC | Peroxisome | 55/4205 | 82/8465 | 1.04e-03 | 3.27e-03 | 1.68e-03 | 55 |
| hsa0090012 | Esophagus | ESCC | Terpenoid backbone biosynthesis | 20/4205 | 23/8465 | 2.14e-04 | 7.87e-04 | 4.03e-04 | 20 |
| hsa0414612 | Esophagus | ESCC | Peroxisome | 55/4205 | 82/8465 | 1.04e-03 | 3.27e-03 | 1.68e-03 | 55 |
| hsa009004 | Oral cavity | OSCC | Terpenoid backbone biosynthesis | 19/3704 | 23/8465 | 1.55e-04 | 5.34e-04 | 2.72e-04 | 19 |
| hsa041466 | Oral cavity | OSCC | Peroxisome | 47/3704 | 82/8465 | 9.01e-03 | 2.01e-02 | 1.03e-02 | 47 |
| hsa0090011 | Oral cavity | OSCC | Terpenoid backbone biosynthesis | 19/3704 | 23/8465 | 1.55e-04 | 5.34e-04 | 2.72e-04 | 19 |
| hsa0414611 | Oral cavity | OSCC | Peroxisome | 47/3704 | 82/8465 | 9.01e-03 | 2.01e-02 | 1.03e-02 | 47 |
| Page: 1 |
Top |
Cell-cell communication analysis |
| Identification of potential cell-cell interactions between two cell types and their ligand-receptor pairs for different disease states |
| Ligand | Receptor | LRpair | Pathway | Tissue | Disease Stage |
| Page: 1 |
Top |
Single-cell gene regulatory network inference analysis |
| Find out the significant the regulons (TFs) and the target genes of each regulon across cell types for different disease states |
| TF | Cell Type | Tissue | Disease Stage | Target Gene | RSS | Regulon Activity |
| ∗The dot plots of a searched regulon are shown for all cell subpopulations in each disease state of each tissue based on the regulon specific score inferred using pySCENIC and by calculating the average expression. |
| Page: 1 |
Top |
Somatic mutation of malignant transformation related genes |
| Annotation of somatic variants for genes involved in malignant transformation |
| Hugo Symbol | Variant Class | Variant Classification | dbSNP RS | HGVSc | HGVSp | HGVSp Short | SWISSPROT | BIOTYPE | SIFT | PolyPhen | Tumor Sample Barcode | Tissue | Histology | Sex | Age | Stage | Therapy Types | Drugs | Outcome |
| MVK | SNV | Missense_Mutation | c.557A>G | p.Asn186Ser | p.N186S | Q03426 | protein_coding | deleterious(0) | probably_damaging(0.955) | TCGA-AN-A0AK-01 | Breast | breast invasive carcinoma | Female | >=65 | I/II | Unknown | Unknown | SD | |
| MVK | insertion | Frame_Shift_Ins | novel | c.585_586insTTCGAGACCAGCCTGTCCAATATGGTGA | p.Ile196PhefsTer90 | p.I196Ffs*90 | Q03426 | protein_coding | TCGA-A8-A07R-01 | Breast | breast invasive carcinoma | Female | >=65 | III/IV | Ancillary | zoledronic | SD | ||
| MVK | SNV | Missense_Mutation | c.118N>T | p.Arg40Trp | p.R40W | Q03426 | protein_coding | deleterious(0.03) | possibly_damaging(0.795) | TCGA-AA-3818-01 | Colorectum | colon adenocarcinoma | Female | >=65 | I/II | Unknown | Unknown | PD | |
| MVK | SNV | Missense_Mutation | c.293N>T | p.Pro98Leu | p.P98L | Q03426 | protein_coding | deleterious(0.03) | benign(0.021) | TCGA-AA-A022-01 | Colorectum | colon adenocarcinoma | Female | >=65 | I/II | Unknown | Unknown | SD | |
| MVK | SNV | Missense_Mutation | rs747116992 | c.449N>T | p.Ser150Leu | p.S150L | Q03426 | protein_coding | deleterious(0) | probably_damaging(0.991) | TCGA-CA-6717-01 | Colorectum | colon adenocarcinoma | Male | <65 | I/II | Chemotherapy | oxaliplatin | CR |
| MVK | SNV | Missense_Mutation | rs371789705 | c.937N>A | p.Ala313Thr | p.A313T | Q03426 | protein_coding | tolerated(0.3) | benign(0) | TCGA-CK-6746-01 | Colorectum | colon adenocarcinoma | Female | >=65 | I/II | Unknown | Unknown | SD |
| MVK | SNV | Missense_Mutation | rs104895358 | c.1006G>A | p.Gly336Ser | p.G336S | Q03426 | protein_coding | deleterious(0) | probably_damaging(1) | TCGA-CM-4746-01 | Colorectum | colon adenocarcinoma | Male | <65 | I/II | Unknown | Unknown | SD |
| MVK | SNV | Missense_Mutation | rs778337320 | c.317N>A | p.Arg106His | p.R106H | Q03426 | protein_coding | tolerated(0.25) | benign(0) | TCGA-EI-6513-01 | Colorectum | rectum adenocarcinoma | Male | <65 | III/IV | Unknown | Unknown | SD |
| MVK | deletion | Frame_Shift_Del | c.412delN | p.Ala141ArgfsTer18 | p.A141Rfs*18 | Q03426 | protein_coding | TCGA-A6-2686-01 | Colorectum | colon adenocarcinoma | Female | >=65 | I/II | Unknown | Unknown | SD | |||
| MVK | deletion | Frame_Shift_Del | c.417delC | p.Ala141ArgfsTer18 | p.A141Rfs*18 | Q03426 | protein_coding | TCGA-AA-3710-01 | Colorectum | colon adenocarcinoma | Female | >=65 | I/II | Unknown | Unknown | SD |
| Page: 1 2 3 4 5 6 7 |
Top |
Related drugs of malignant transformation related genes |
| Identification of chemicals and drugs interact with genes involved in malignant transfromation |
| (DGIdb 4.0) |
| Entrez ID | Symbol | Category | Interaction Types | Drug Claim Name | Drug Name | PMIDs |
| 4598 | MVK | KINASE, ENZYME | inhibitor | 135651475 | ||
| 4598 | MVK | KINASE, ENZYME | inhibitor | 135651486 | FARNESOL | |
| 4598 | MVK | KINASE, ENZYME | alendronate | ALENDRONIC ACID | 25223561 | |
| 4598 | MVK | KINASE, ENZYME | inhibitor | 135651580 | ||
| 4598 | MVK | KINASE, ENZYME | inhibitor | 135650252 | ||
| 4598 | MVK | KINASE, ENZYME | inhibitor | 135651490 | ||
| 4598 | MVK | KINASE, ENZYME | inhibitor | 135651491 | ||
| 4598 | MVK | KINASE, ENZYME | inhibitor | 135651495 | ||
| 4598 | MVK | KINASE, ENZYME | inhibitor | 135650204 |
| Page: 1 |

Copyright 2023-Present -The University of Texas Health Science Center at Houston |