
|
|||||
|
 | |
| |
| |
| |
| |
| |
|
Gene: MTA3 |
Gene summary for MTA3 |
| Gene information | Species | Human | Gene symbol | MTA3 | Gene ID | 57504 |
| Gene name | metastasis associated 1 family member 3 | |
| Gene Alias | MTA3 | |
| Cytomap | 2p21 | |
| Gene Type | protein-coding | GO ID | GO:0000086 | UniProtAcc | D6W5A2 |
Top |
Malignant transformation analysis |
| Identification of the aberrant gene expression in precancerous and cancerous lesions by comparing the gene expression of stem-like cells in diseased tissues with normal stem cells |
| Entrez ID | Symbol | Replicates | Species | Organ | Tissue | Adj P-value | Log2FC | Malignancy |
| 57504 | MTA3 | CCI_1 | Human | Cervix | CC | 1.04e-04 | 8.21e-01 | 0.528 |
| 57504 | MTA3 | CCI_2 | Human | Cervix | CC | 4.25e-02 | 4.53e-01 | 0.5249 |
| 57504 | MTA3 | CCI_3 | Human | Cervix | CC | 4.59e-07 | 5.47e-01 | 0.516 |
| 57504 | MTA3 | HTA11_3410_2000001011 | Human | Colorectum | AD | 4.13e-06 | -4.08e-01 | 0.0155 |
| 57504 | MTA3 | HTA11_347_2000001011 | Human | Colorectum | AD | 4.66e-04 | 3.63e-01 | -0.1954 |
| 57504 | MTA3 | HTA11_10711_2000001011 | Human | Colorectum | AD | 1.50e-03 | -4.65e-01 | 0.0338 |
| 57504 | MTA3 | HTA11_99999974143_84620 | Human | Colorectum | MSS | 6.91e-06 | -3.14e-01 | 0.3005 |
| 57504 | MTA3 | F007 | Human | Colorectum | FAP | 5.75e-03 | -4.24e-01 | 0.1176 |
| 57504 | MTA3 | A001-C-207 | Human | Colorectum | FAP | 2.58e-07 | -4.70e-01 | 0.1278 |
| 57504 | MTA3 | A015-C-203 | Human | Colorectum | FAP | 2.68e-35 | -4.67e-01 | -0.1294 |
| 57504 | MTA3 | A015-C-204 | Human | Colorectum | FAP | 1.69e-07 | -4.22e-01 | -0.0228 |
| 57504 | MTA3 | A014-C-040 | Human | Colorectum | FAP | 1.62e-05 | -5.17e-01 | -0.1184 |
| 57504 | MTA3 | A002-C-201 | Human | Colorectum | FAP | 4.64e-13 | -3.82e-01 | 0.0324 |
| 57504 | MTA3 | A002-C-203 | Human | Colorectum | FAP | 5.69e-07 | -2.56e-01 | 0.2786 |
| 57504 | MTA3 | A001-C-119 | Human | Colorectum | FAP | 7.82e-07 | -4.81e-01 | -0.1557 |
| 57504 | MTA3 | A001-C-108 | Human | Colorectum | FAP | 8.93e-30 | -4.77e-01 | -0.0272 |
| 57504 | MTA3 | A002-C-205 | Human | Colorectum | FAP | 2.41e-24 | -5.57e-01 | -0.1236 |
| 57504 | MTA3 | A001-C-104 | Human | Colorectum | FAP | 7.25e-08 | -3.29e-01 | 0.0184 |
| 57504 | MTA3 | A015-C-005 | Human | Colorectum | FAP | 6.52e-05 | -3.49e-01 | -0.0336 |
| 57504 | MTA3 | A015-C-006 | Human | Colorectum | FAP | 6.28e-17 | -5.74e-01 | -0.0994 |
| Page: 1 2 3 4 5 6 7 |
| Tissue | Expression Dynamics | Abbreviation |
| Cervix | 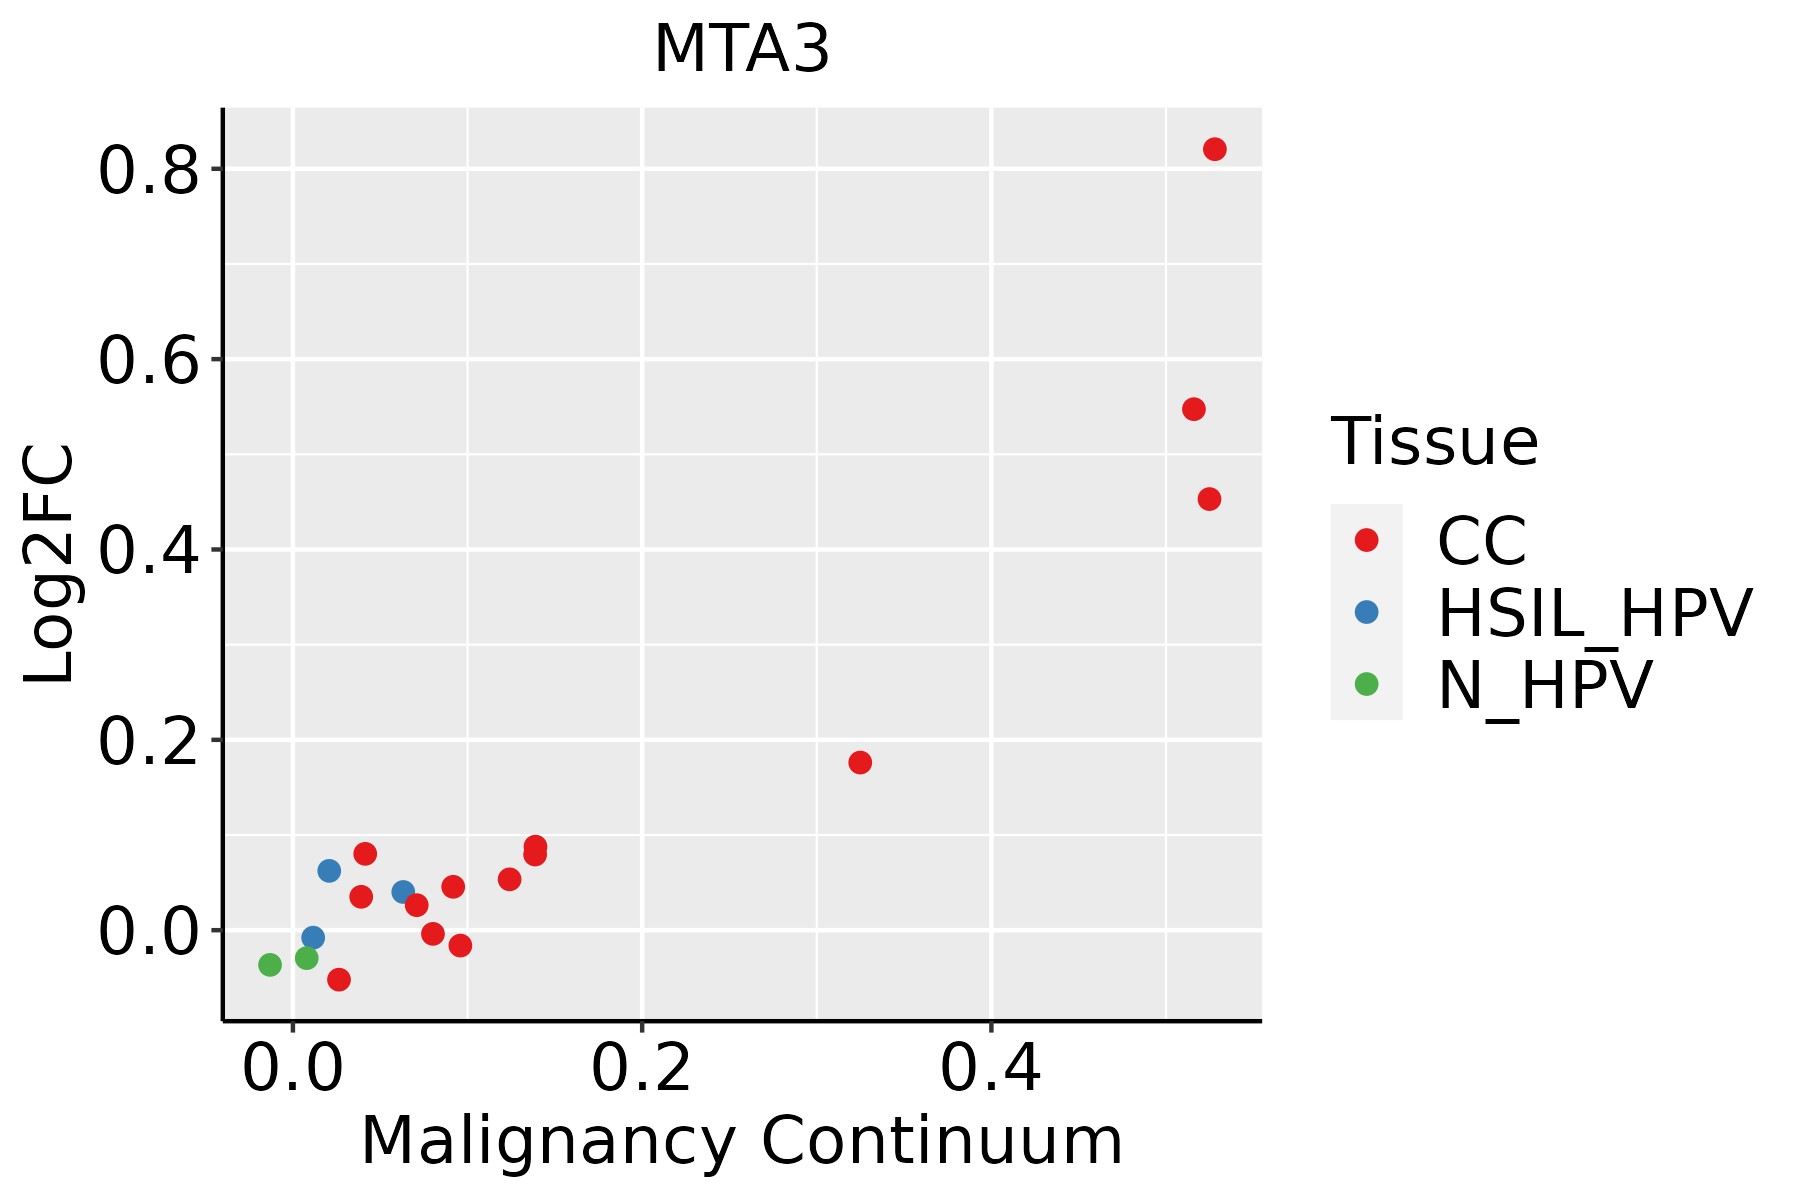 | CC: Cervix cancer |
| HSIL_HPV: HPV-infected high-grade squamous intraepithelial lesions | ||
| N_HPV: HPV-infected normal cervix | ||
| Colorectum (GSE201348) |  | FAP: Familial adenomatous polyposis |
| CRC: Colorectal cancer | ||
| Colorectum (HTA11) | 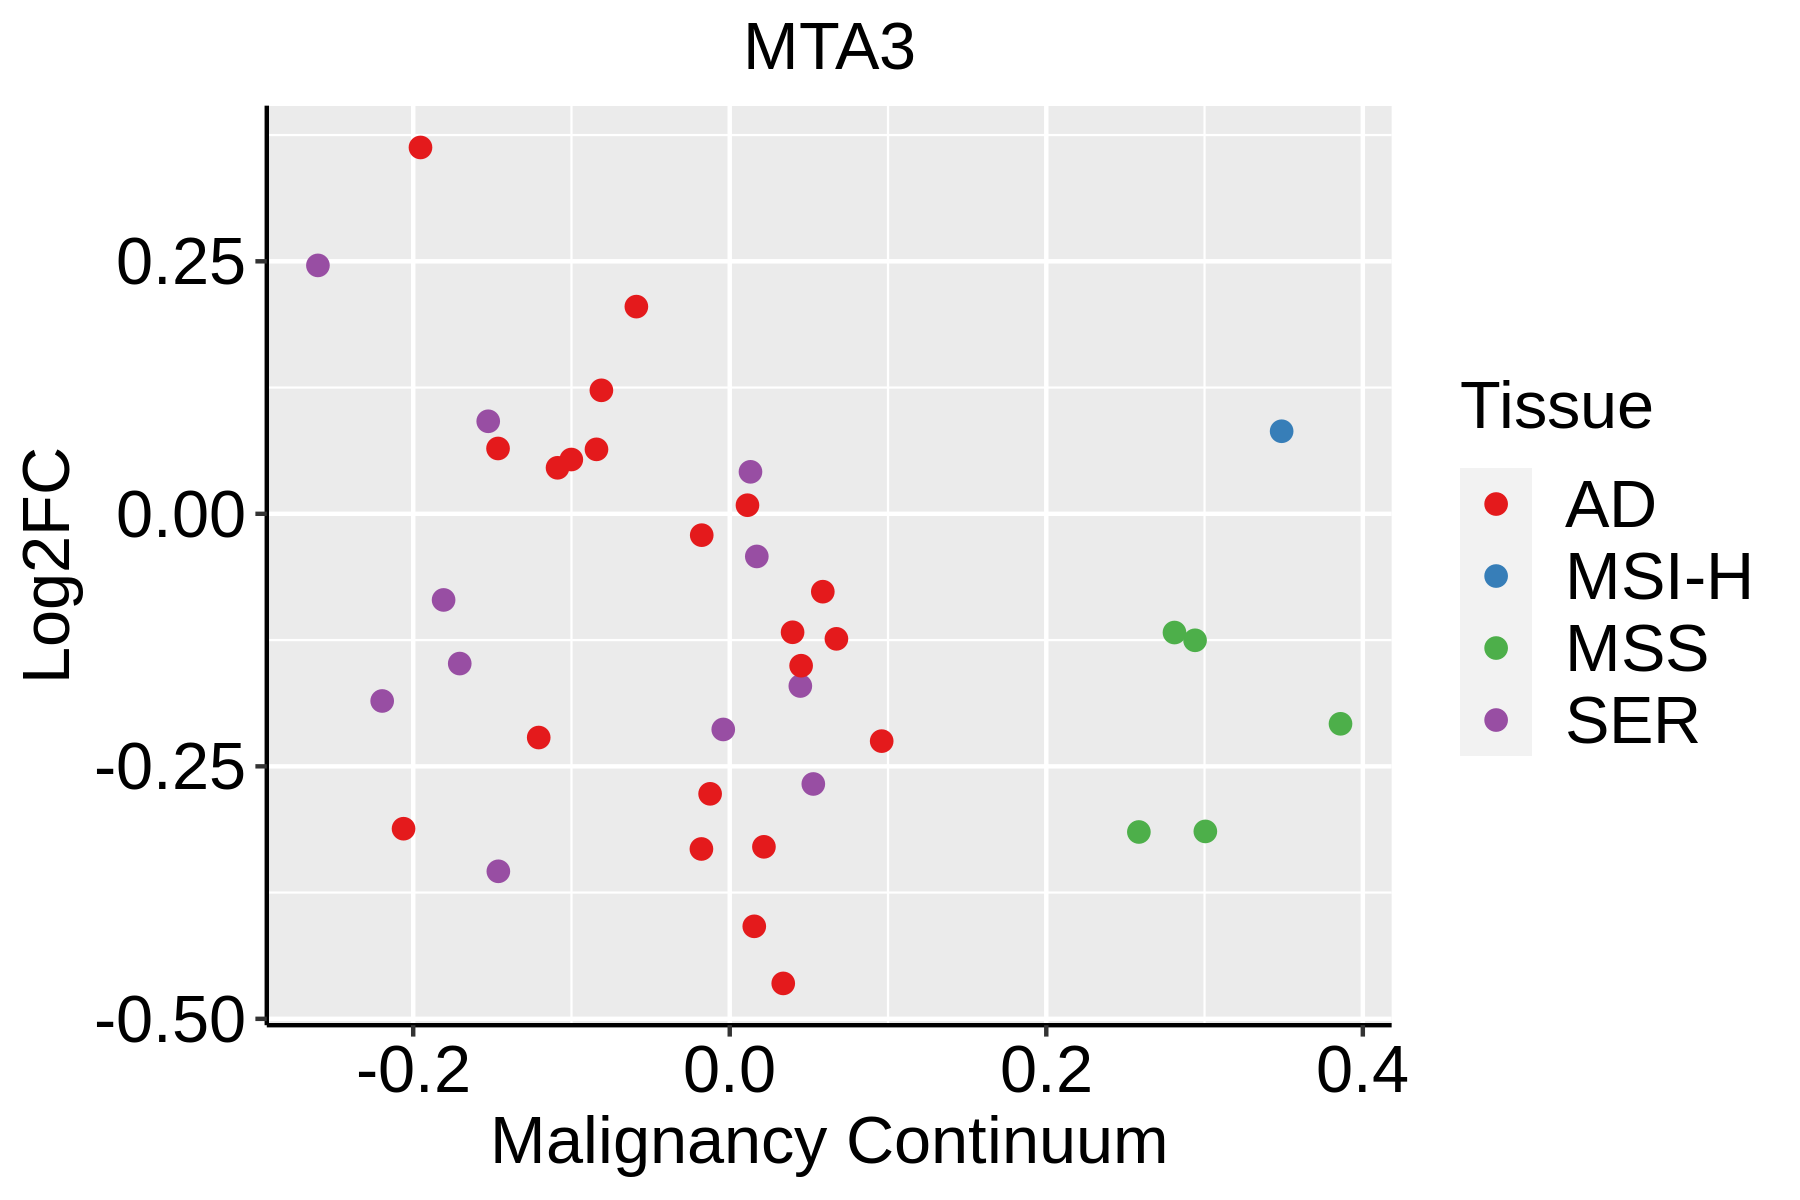 | AD: Adenomas |
| SER: Sessile serrated lesions | ||
| MSI-H: Microsatellite-high colorectal cancer | ||
| MSS: Microsatellite stable colorectal cancer | ||
| Endometrium | 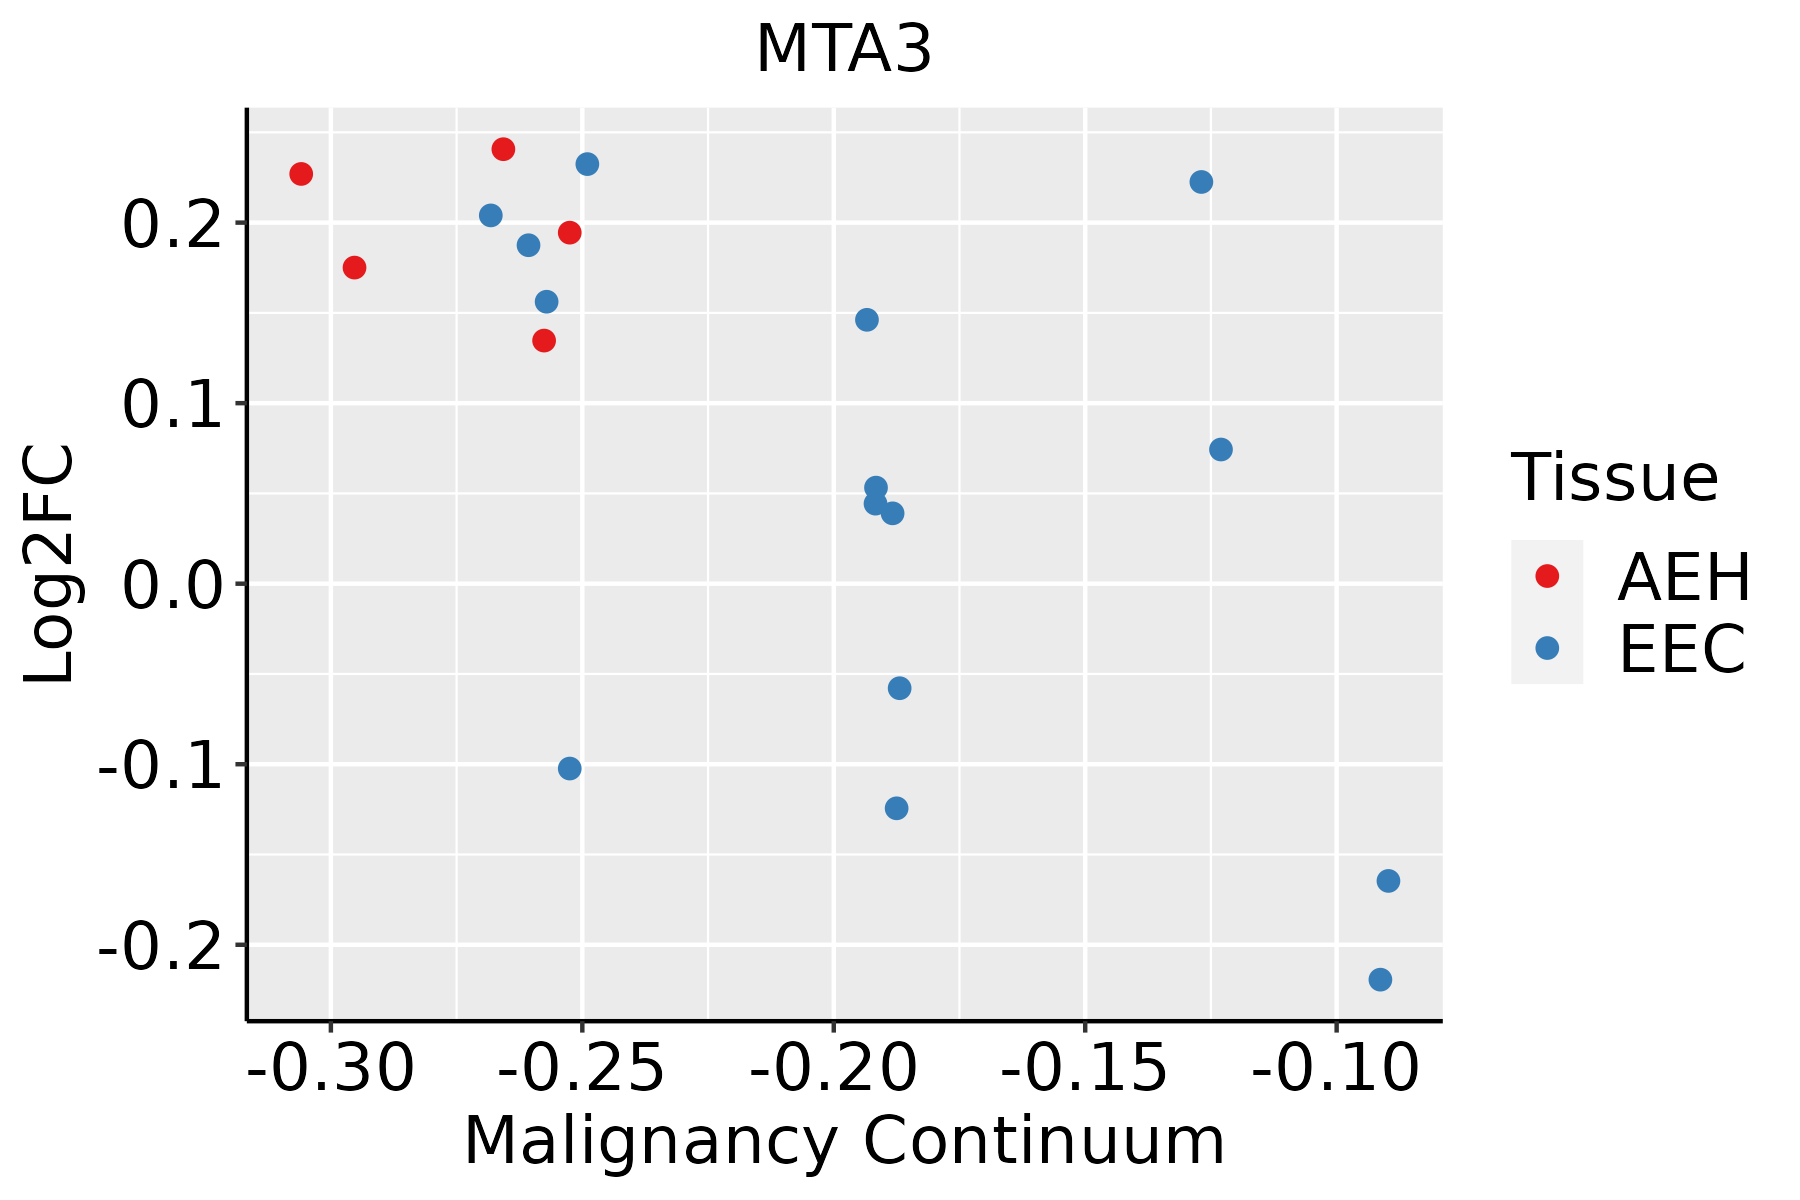 | AEH: Atypical endometrial hyperplasia |
| EEC: Endometrioid Cancer | ||
| Esophagus | 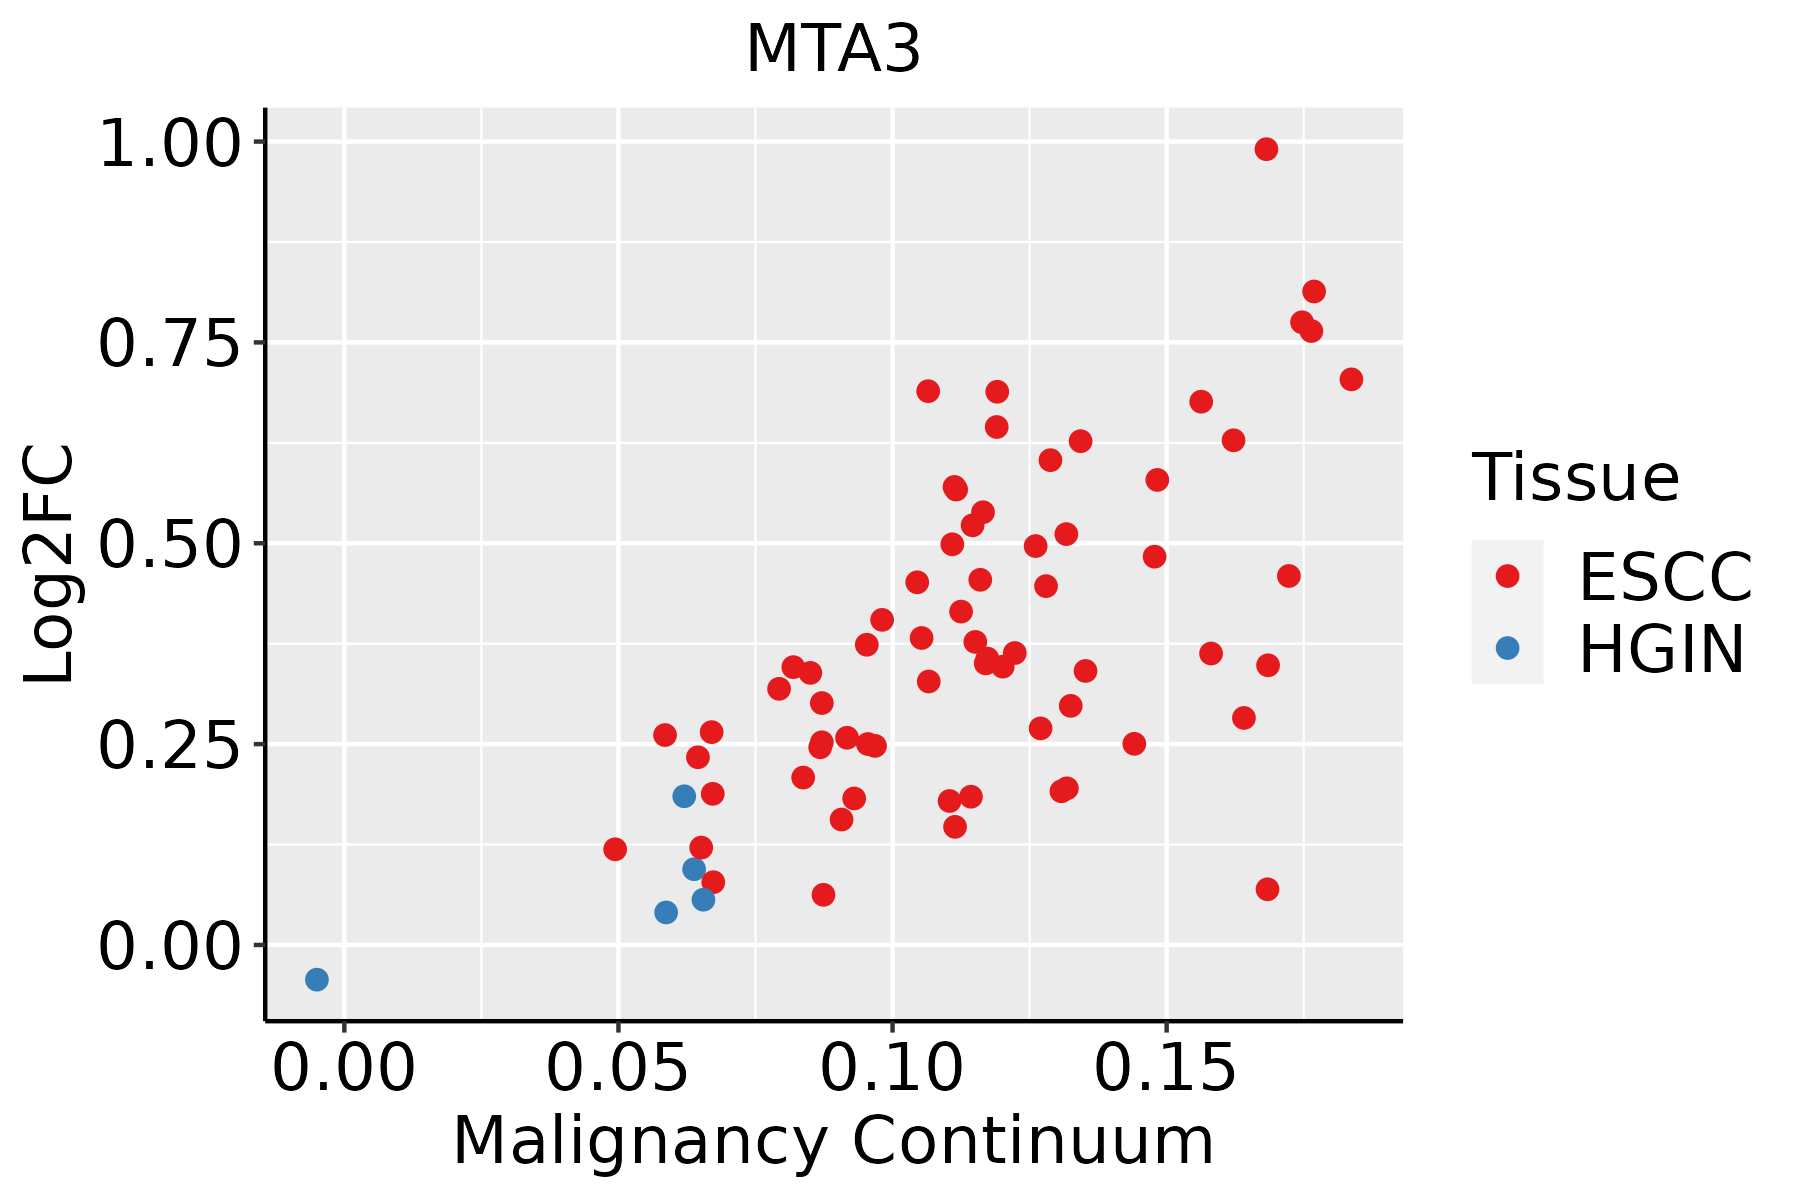 | ESCC: Esophageal squamous cell carcinoma |
| HGIN: High-grade intraepithelial neoplasias | ||
| LGIN: Low-grade intraepithelial neoplasias | ||
| Lung |  | AAH: Atypical adenomatous hyperplasia |
| AIS: Adenocarcinoma in situ | ||
| IAC: Invasive lung adenocarcinoma | ||
| MIA: Minimally invasive adenocarcinoma | ||
| Oral Cavity | 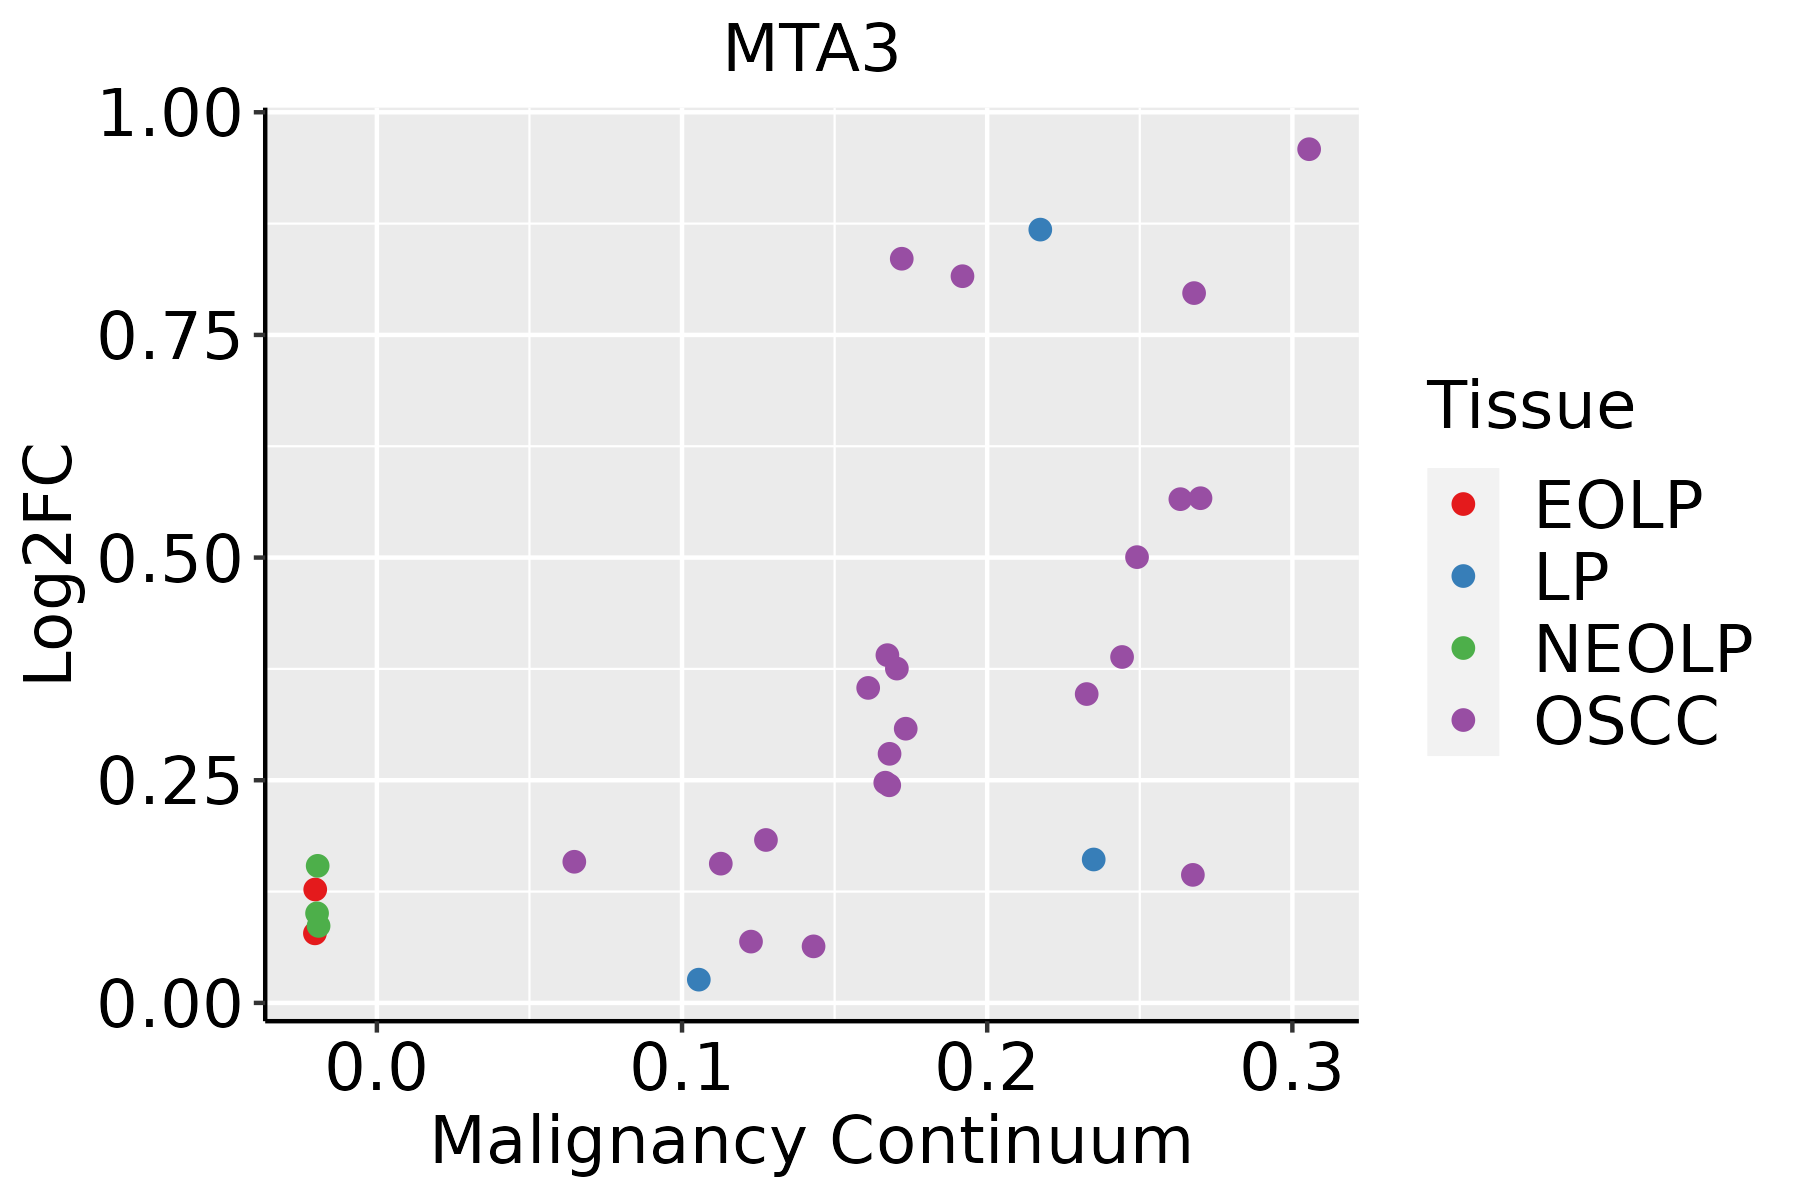 | EOLP: Erosive Oral lichen planus |
| LP: leukoplakia | ||
| NEOLP: Non-erosive oral lichen planus | ||
| OSCC: Oral squamous cell carcinoma |
| ∗log2FC in expression of this searched gene in stem-like cells from each diseased tissue sample relative to stem-like cells in normal samples in each tissue plotted against the malignancy continuum. Samples are colored based on if they are from different disease stage. |
Top |
Malignant transformation related pathway analysis |
| Find out the enriched GO biological processes and KEGG pathways involved in transition from healthy to precancer to cancer |
| Tissue | Disease Stage | Enriched GO biological Processes |
| Colorectum | AD |  |
| Colorectum | SER |  |
| Colorectum | MSS |  |
| Colorectum | MSI-H |  |
| Colorectum | FAP |  |
| ∗Top 15 enriched GO BP terms are showed in the bar plot of each disease state in each tissue. Each row represents a significant GO biological process which is colored according to the -log10(p.adjust). |
| Page: 1 2 3 4 5 6 7 8 9 |
| GO ID | Tissue | Disease Stage | Description | Gene Ratio | Bg Ratio | pvalue | p.adjust | Count |
| GO:003560121 | Oral cavity | EOLP | protein deacylation | 23/2218 | 112/18723 | 5.70e-03 | 2.92e-02 | 23 |
| GO:009873221 | Oral cavity | EOLP | macromolecule deacylation | 23/2218 | 116/18723 | 8.80e-03 | 4.08e-02 | 23 |
| Page: 1 2 3 4 5 6 7 |
| Pathway ID | Tissue | Disease Stage | Description | Gene Ratio | Bg Ratio | pvalue | p.adjust | qvalue | Count |
| Page: 1 |
Top |
Cell-cell communication analysis |
| Identification of potential cell-cell interactions between two cell types and their ligand-receptor pairs for different disease states |
| Ligand | Receptor | LRpair | Pathway | Tissue | Disease Stage |
| Page: 1 |
Top |
Single-cell gene regulatory network inference analysis |
| Find out the significant the regulons (TFs) and the target genes of each regulon across cell types for different disease states |
| TF | Cell Type | Tissue | Disease Stage | Target Gene | RSS | Regulon Activity |
| MTA3 | TUF | Colorectum | FAP | IGSF3,BMX,NAV2, etc. | 1.21e-01 |  |
| MTA3 | GC | Colorectum | ADJ | S100Z,CUX1,RAPGEF5, etc. | 2.84e-01 |  |
| MTA3 | GC | Colorectum | CRC | S100Z,CUX1,RAPGEF5, etc. | 6.82e-02 |  |
| MTA3 | GC | Colorectum | FAP | S100Z,CUX1,RAPGEF5, etc. | 2.11e-01 | |
| MTA3 | INMON | Esophagus | ESCC | C9orf47,IPO8,IFI27, etc. | 9.90e-02 |  |
| MTA3 | CHO | Liver | Healthy | KREMEN1,C12orf10,PRRC1, etc. | 2.35e-01 |  |
| MTA3 | MAST | Lung | IAC | AC018362.1,PLEK2,FCER1A, etc. | 3.96e-02 |  |
| MTA3 | CD8TEXP | Oral cavity | ADJ | NFIC,TTC21A,SGO1-AS1, etc. | 1.18e-02 |  |
| MTA3 | CD8TEXINT | Oral cavity | Healthy | NFIC,TTC21A,SGO1-AS1, etc. | 9.54e-03 |  |
| MTA3 | CD4TN | Oral cavity | Healthy | NFIC,TTC21A,SGO1-AS1, etc. | 1.58e-02 | |
| ∗The dot plots of a searched regulon are shown for all cell subpopulations in each disease state of each tissue based on the regulon specific score inferred using pySCENIC and by calculating the average expression. |
| Page: 1 2 3 |
Top |
Somatic mutation of malignant transformation related genes |
| Annotation of somatic variants for genes involved in malignant transformation |
| Hugo Symbol | Variant Class | Variant Classification | dbSNP RS | HGVSc | HGVSp | HGVSp Short | SWISSPROT | BIOTYPE | SIFT | PolyPhen | Tumor Sample Barcode | Tissue | Histology | Sex | Age | Stage | Therapy Types | Drugs | Outcome |
| MTA3 | SNV | Missense_Mutation | novel | c.452G>C | p.Arg151Thr | p.R151T | Q9BTC8 | protein_coding | deleterious(0) | probably_damaging(0.994) | TCGA-5L-AAT1-01 | Breast | breast invasive carcinoma | Female | <65 | III/IV | Hormone Therapy | letrozol | SD |
| MTA3 | SNV | Missense_Mutation | novel | c.1248G>C | p.Leu416Phe | p.L416F | Q9BTC8 | protein_coding | deleterious(0.03) | probably_damaging(0.998) | TCGA-5L-AAT1-01 | Breast | breast invasive carcinoma | Female | <65 | III/IV | Hormone Therapy | letrozol | SD |
| MTA3 | SNV | Missense_Mutation | rs190465226 | c.1309N>T | p.Arg437Cys | p.R437C | Q9BTC8 | protein_coding | deleterious(0.03) | benign(0) | TCGA-A2-A0EY-01 | Breast | breast invasive carcinoma | Female | <65 | I/II | Chemotherapy | adriamycin | SD |
| MTA3 | SNV | Missense_Mutation | c.1052N>T | p.Ser351Phe | p.S351F | Q9BTC8 | protein_coding | tolerated(0.16) | probably_damaging(0.915) | TCGA-AN-A0AK-01 | Breast | breast invasive carcinoma | Female | >=65 | I/II | Unknown | Unknown | SD | |
| MTA3 | SNV | Missense_Mutation | c.1130N>A | p.Arg377Lys | p.R377K | Q9BTC8 | protein_coding | tolerated(0.39) | probably_damaging(0.952) | TCGA-BH-A0AV-01 | Breast | breast invasive carcinoma | Female | <65 | I/II | Chemotherapy | taxotere | CR | |
| MTA3 | SNV | Missense_Mutation | c.729N>C | p.Arg243Ser | p.R243S | Q9BTC8 | protein_coding | tolerated(0.17) | benign(0.033) | TCGA-BH-A0DT-01 | Breast | breast invasive carcinoma | Female | <65 | I/II | Chemotherapy | taxotere | CR | |
| MTA3 | SNV | Missense_Mutation | novel | c.304G>A | p.Ala102Thr | p.A102T | Q9BTC8 | protein_coding | deleterious(0.02) | probably_damaging(0.985) | TCGA-2W-A8YY-01 | Cervix | cervical & endocervical cancer | Female | <65 | I/II | Chemotherapy | cisplatin | CR |
| MTA3 | SNV | Missense_Mutation | c.709N>A | p.Ala237Thr | p.A237T | Q9BTC8 | protein_coding | deleterious(0.03) | probably_damaging(0.99) | TCGA-A6-6653-01 | Colorectum | colon adenocarcinoma | Male | >=65 | I/II | Unknown | Unknown | SD | |
| MTA3 | SNV | Missense_Mutation | c.709N>A | p.Ala237Thr | p.A237T | Q9BTC8 | protein_coding | deleterious(0.03) | probably_damaging(0.99) | TCGA-A6-A56B-01 | Colorectum | colon adenocarcinoma | Male | <65 | III/IV | Chemotherapy | fluorouracil | PD | |
| MTA3 | SNV | Missense_Mutation | rs766940790 | c.143N>A | p.Arg48Gln | p.R48Q | Q9BTC8 | protein_coding | deleterious(0) | probably_damaging(0.992) | TCGA-AA-A010-01 | Colorectum | colon adenocarcinoma | Female | <65 | I/II | Chemotherapy | folinic | CR |
| Page: 1 2 3 4 5 |
Top |
Related drugs of malignant transformation related genes |
| Identification of chemicals and drugs interact with genes involved in malignant transfromation |
| (DGIdb 4.0) |
| Entrez ID | Symbol | Category | Interaction Types | Drug Claim Name | Drug Name | PMIDs |
| Page: 1 |

Copyright 2023-Present -The University of Texas Health Science Center at Houston |