
|
|||||
|
 | |
| |
| |
| |
| |
| |
|
Gene: MAD1L1 |
Gene summary for MAD1L1 |
| Gene information | Species | Human | Gene symbol | MAD1L1 | Gene ID | 8379 |
| Gene name | mitotic arrest deficient 1 like 1 | |
| Gene Alias | MAD1 | |
| Cytomap | 7p22.3 | |
| Gene Type | protein-coding | GO ID | GO:0000070 | UniProtAcc | Q9Y6D9 |
Top |
Malignant transformation analysis |
| Identification of the aberrant gene expression in precancerous and cancerous lesions by comparing the gene expression of stem-like cells in diseased tissues with normal stem cells |
| Entrez ID | Symbol | Replicates | Species | Organ | Tissue | Adj P-value | Log2FC | Malignancy |
| 8379 | MAD1L1 | Tumor | Human | Cervix | CC | 3.91e-23 | 4.82e-01 | 0.1241 |
| 8379 | MAD1L1 | sample3 | Human | Cervix | CC | 1.91e-35 | 5.60e-01 | 0.1387 |
| 8379 | MAD1L1 | T3 | Human | Cervix | CC | 3.98e-30 | 5.62e-01 | 0.1389 |
| 8379 | MAD1L1 | LZE4T | Human | Esophagus | ESCC | 3.18e-05 | 1.54e-01 | 0.0811 |
| 8379 | MAD1L1 | LZE7T | Human | Esophagus | ESCC | 2.07e-15 | 5.45e-01 | 0.0667 |
| 8379 | MAD1L1 | LZE8T | Human | Esophagus | ESCC | 2.72e-03 | 1.14e-01 | 0.067 |
| 8379 | MAD1L1 | LZE21D1 | Human | Esophagus | HGIN | 4.41e-04 | 2.78e-01 | 0.0632 |
| 8379 | MAD1L1 | LZE22T | Human | Esophagus | ESCC | 1.40e-06 | 2.90e-01 | 0.068 |
| 8379 | MAD1L1 | LZE24T | Human | Esophagus | ESCC | 1.28e-07 | 2.01e-01 | 0.0596 |
| 8379 | MAD1L1 | LZE21T | Human | Esophagus | ESCC | 9.73e-05 | 2.12e-01 | 0.0655 |
| 8379 | MAD1L1 | LZE6T | Human | Esophagus | ESCC | 1.55e-08 | 2.48e-01 | 0.0845 |
| 8379 | MAD1L1 | P1T-E | Human | Esophagus | ESCC | 7.43e-09 | 3.12e-01 | 0.0875 |
| 8379 | MAD1L1 | P2T-E | Human | Esophagus | ESCC | 3.34e-20 | 3.27e-01 | 0.1177 |
| 8379 | MAD1L1 | P4T-E | Human | Esophagus | ESCC | 2.45e-12 | 2.48e-01 | 0.1323 |
| 8379 | MAD1L1 | P5T-E | Human | Esophagus | ESCC | 3.74e-18 | 2.87e-01 | 0.1327 |
| 8379 | MAD1L1 | P8T-E | Human | Esophagus | ESCC | 7.27e-21 | 1.67e-01 | 0.0889 |
| 8379 | MAD1L1 | P9T-E | Human | Esophagus | ESCC | 2.79e-12 | 2.90e-01 | 0.1131 |
| 8379 | MAD1L1 | P10T-E | Human | Esophagus | ESCC | 2.38e-14 | 2.28e-01 | 0.116 |
| 8379 | MAD1L1 | P11T-E | Human | Esophagus | ESCC | 2.05e-22 | 5.78e-01 | 0.1426 |
| 8379 | MAD1L1 | P12T-E | Human | Esophagus | ESCC | 4.40e-24 | 4.98e-01 | 0.1122 |
| Page: 1 2 3 4 5 6 |
| Tissue | Expression Dynamics | Abbreviation |
| Cervix | 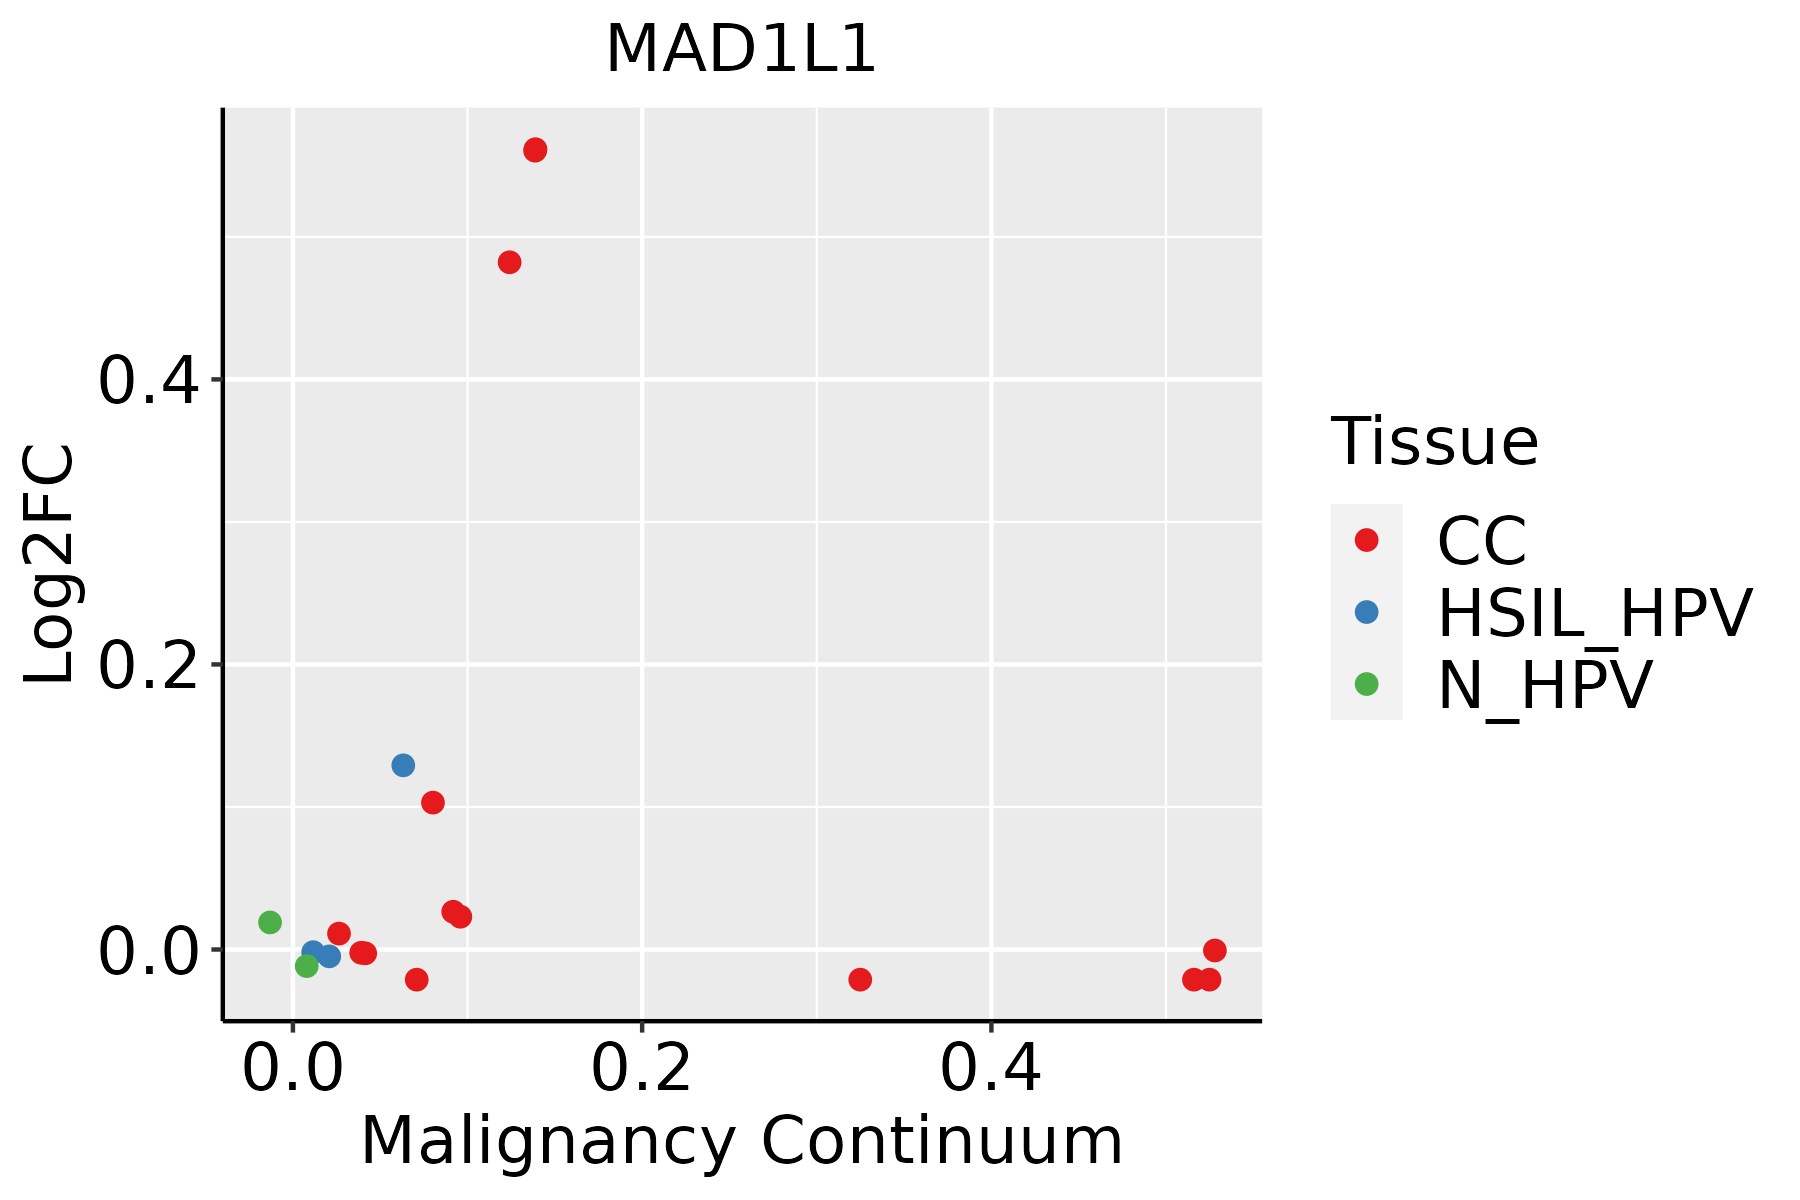 | CC: Cervix cancer |
| HSIL_HPV: HPV-infected high-grade squamous intraepithelial lesions | ||
| N_HPV: HPV-infected normal cervix | ||
| Esophagus | 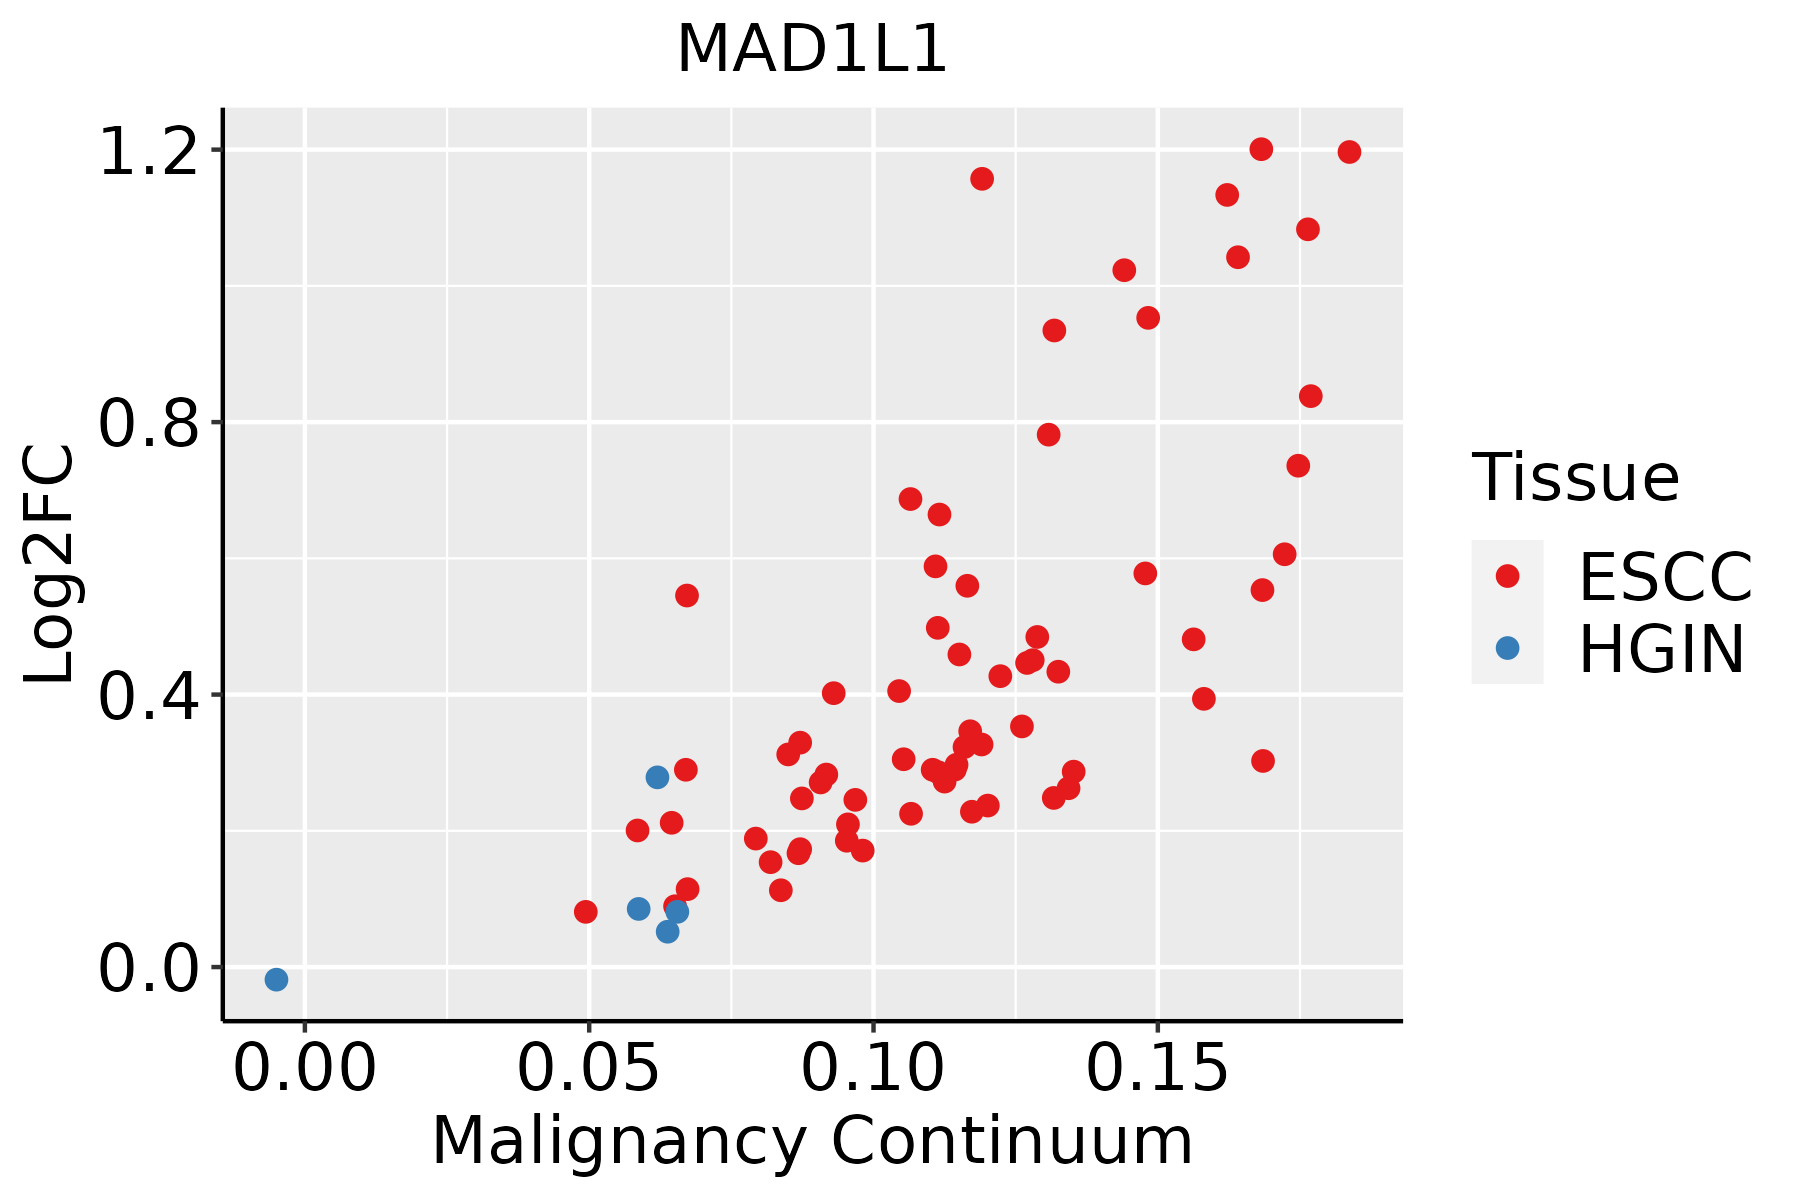 | ESCC: Esophageal squamous cell carcinoma |
| HGIN: High-grade intraepithelial neoplasias | ||
| LGIN: Low-grade intraepithelial neoplasias | ||
| Liver | 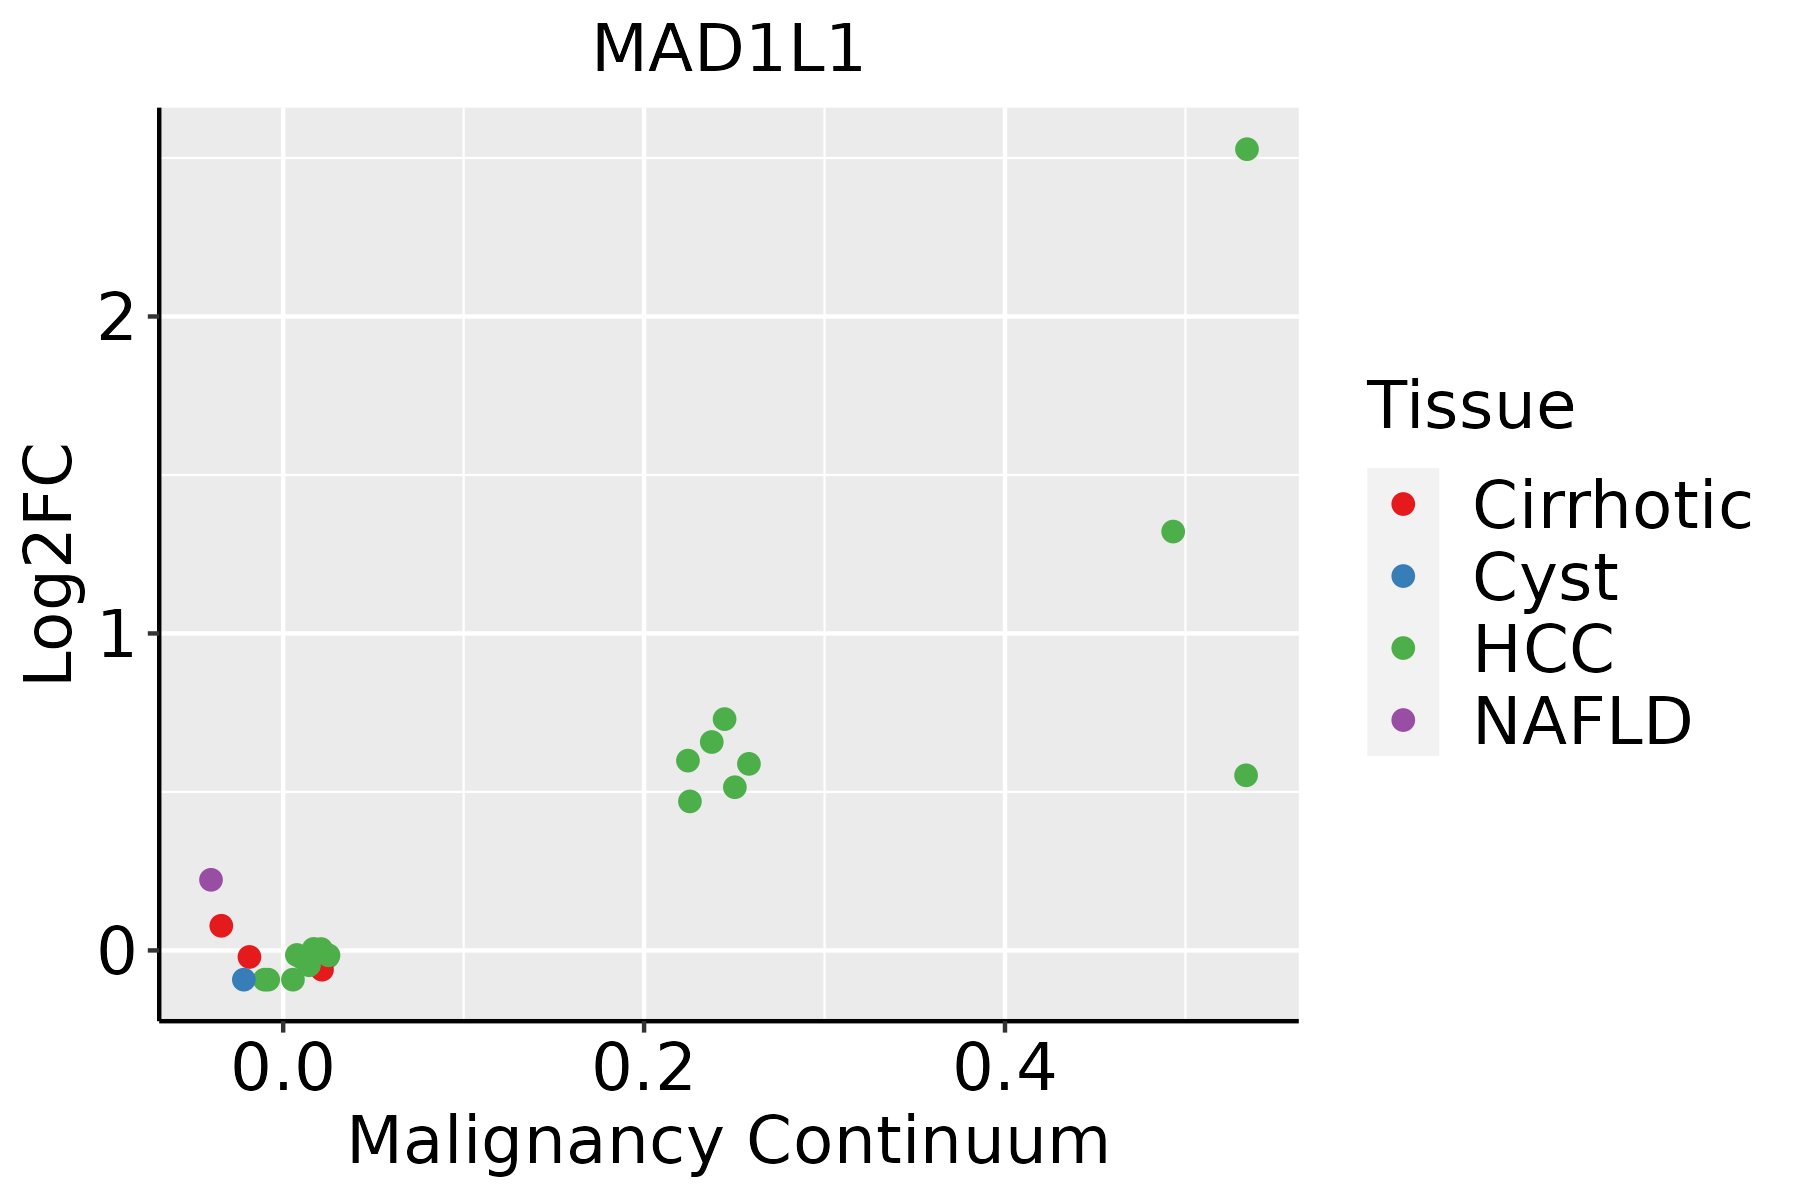 | HCC: Hepatocellular carcinoma |
| NAFLD: Non-alcoholic fatty liver disease | ||
| Oral Cavity | 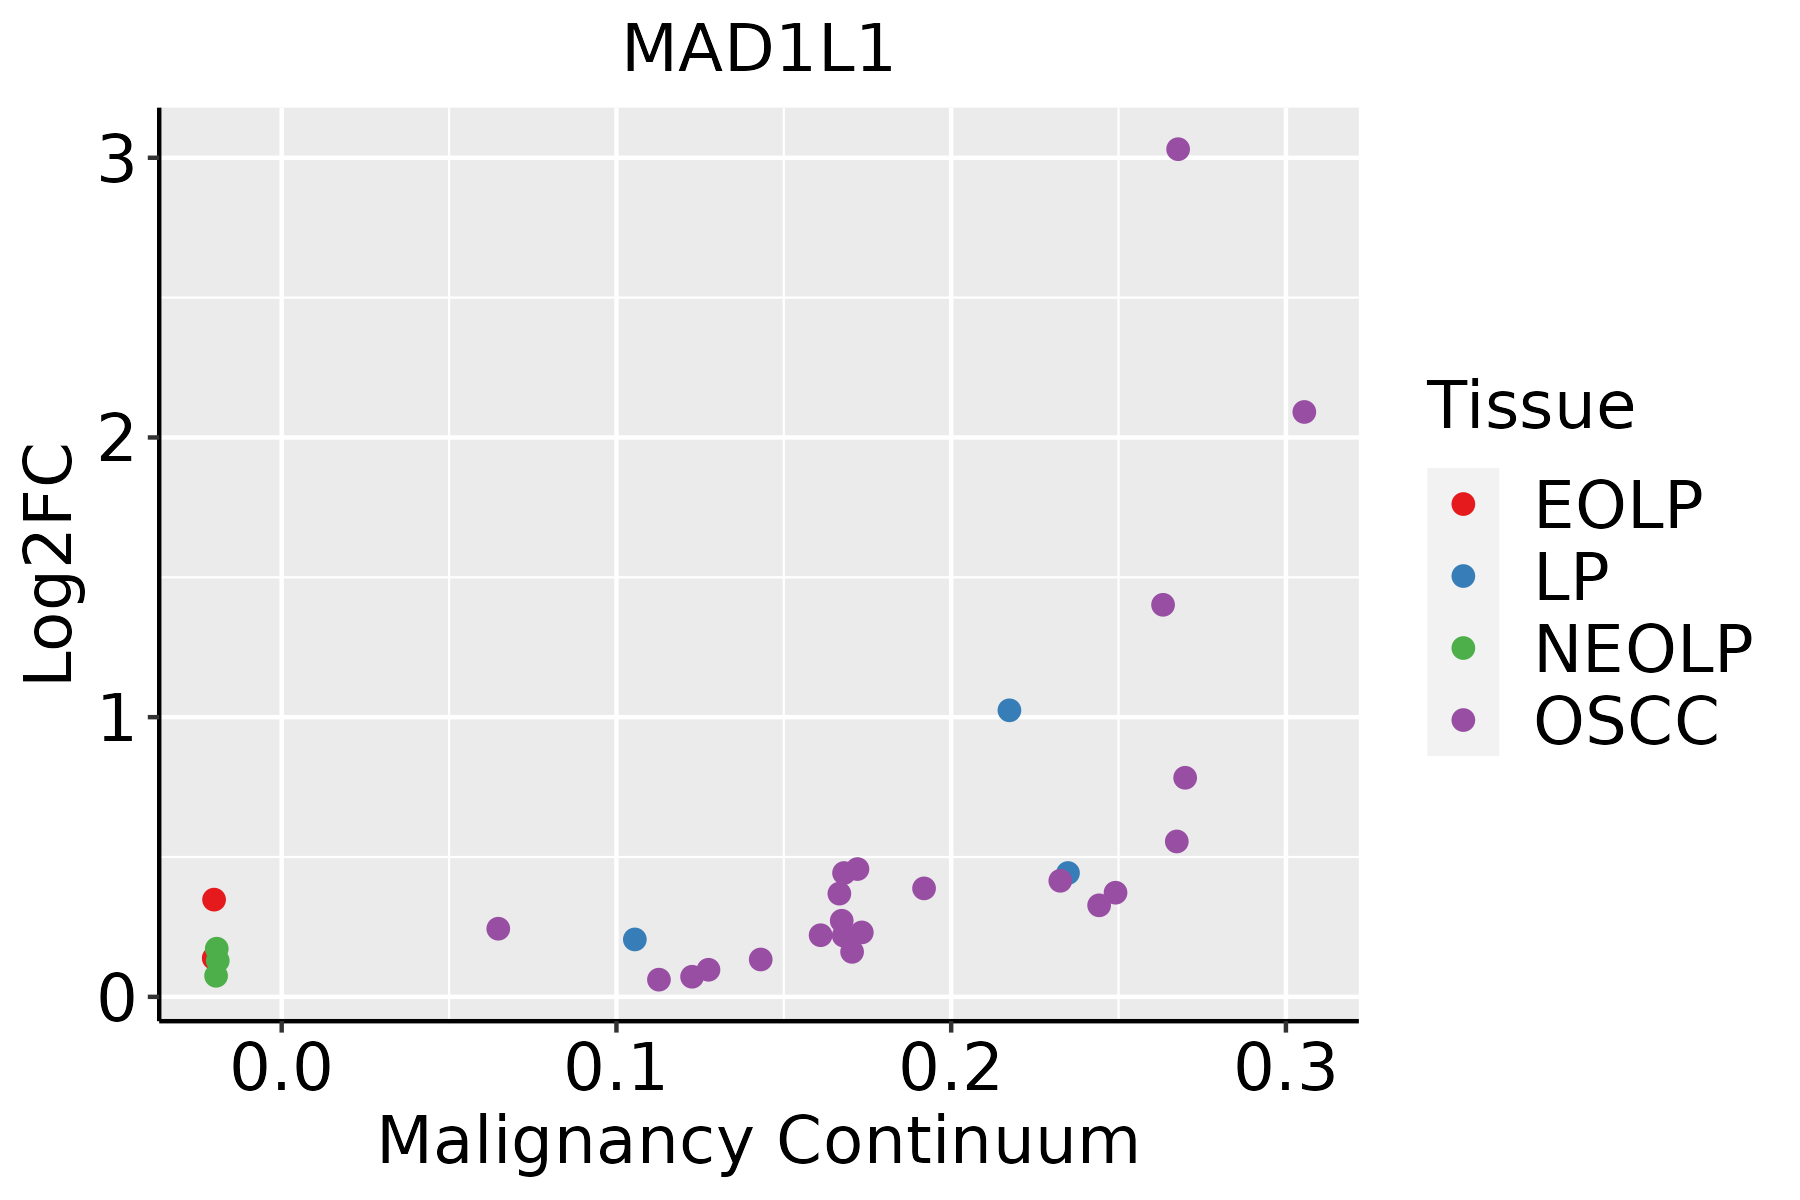 | EOLP: Erosive Oral lichen planus |
| LP: leukoplakia | ||
| NEOLP: Non-erosive oral lichen planus | ||
| OSCC: Oral squamous cell carcinoma | ||
| Thyroid | 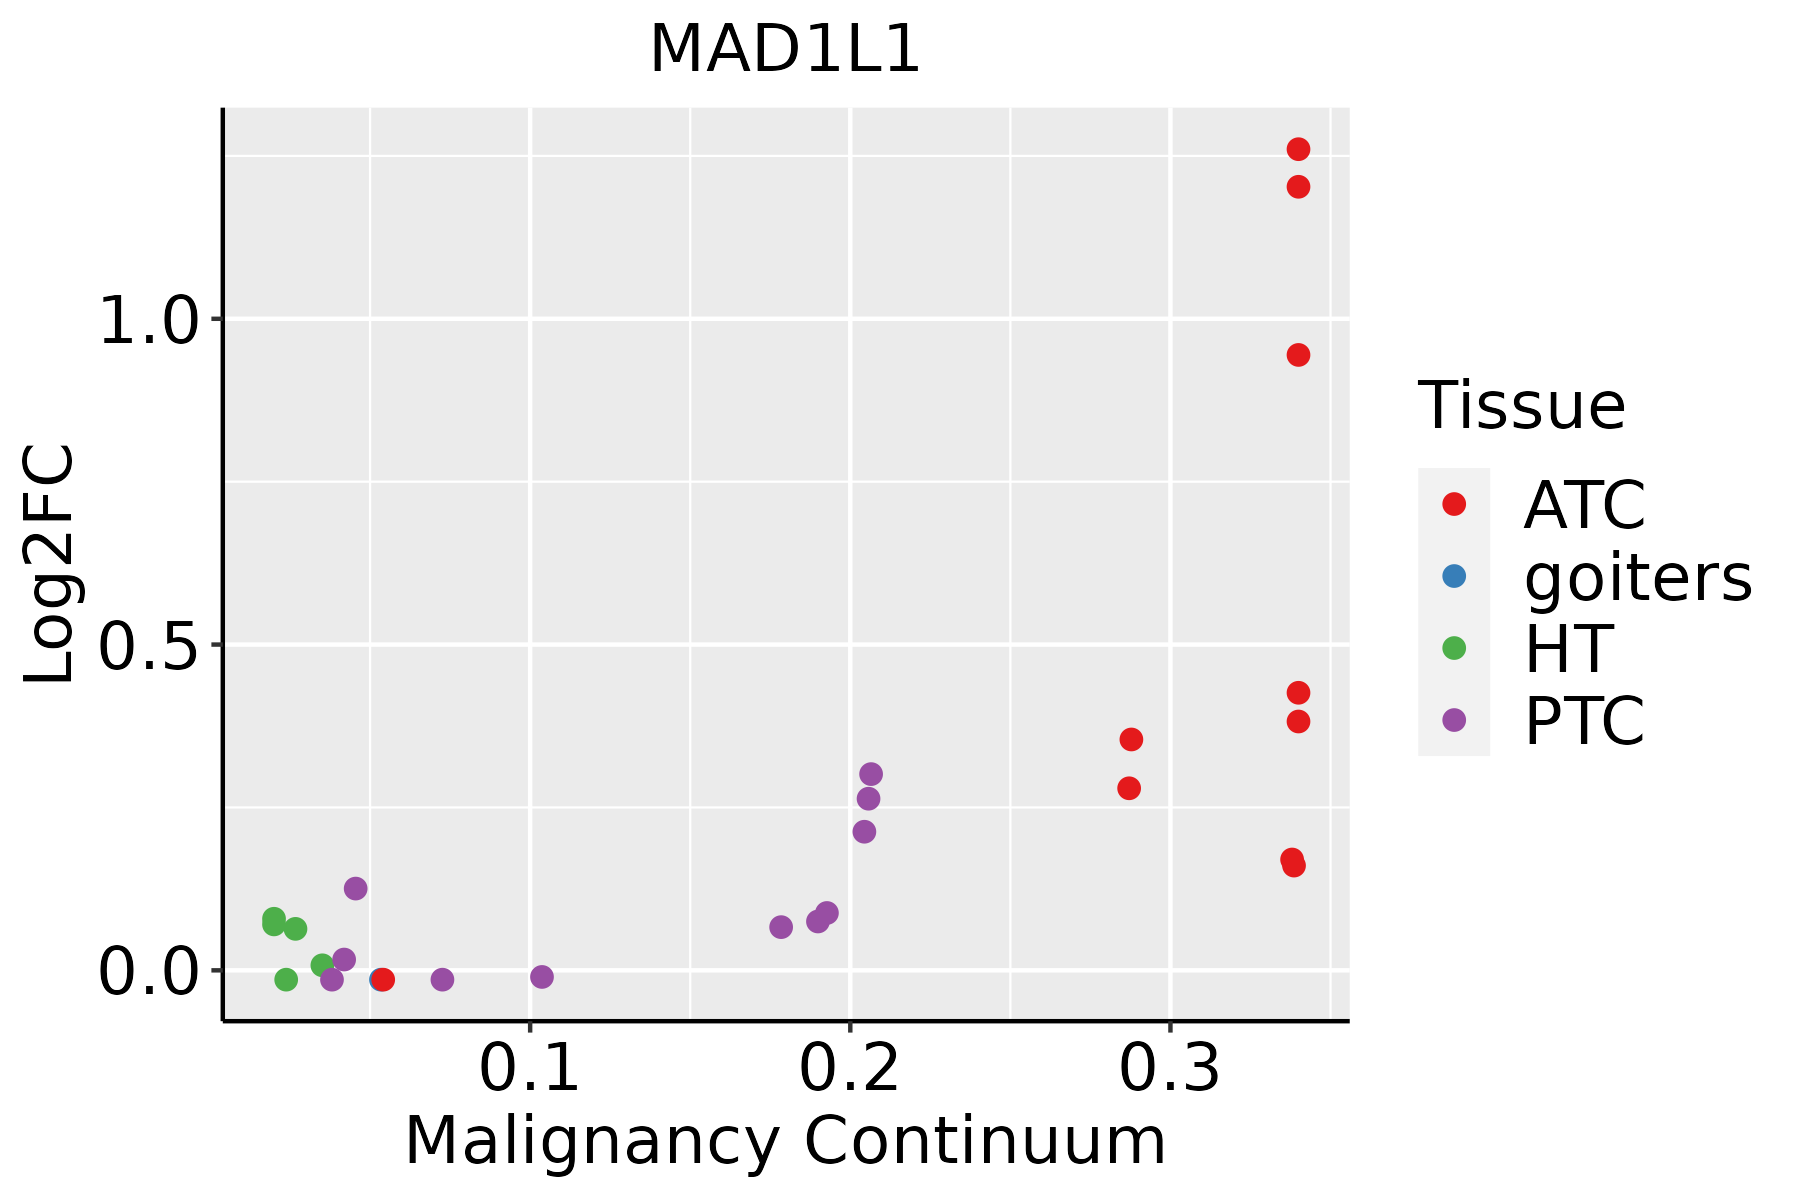 | ATC: Anaplastic thyroid cancer |
| HT: Hashimoto's thyroiditis | ||
| PTC: Papillary thyroid cancer |
| ∗log2FC in expression of this searched gene in stem-like cells from each diseased tissue sample relative to stem-like cells in normal samples in each tissue plotted against the malignancy continuum. Samples are colored based on if they are from different disease stage. |
Top |
Malignant transformation related pathway analysis |
| Find out the enriched GO biological processes and KEGG pathways involved in transition from healthy to precancer to cancer |
| Tissue | Disease Stage | Enriched GO biological Processes |
| Colorectum | AD |  |
| Colorectum | SER |  |
| Colorectum | MSS |  |
| Colorectum | MSI-H |  |
| Colorectum | FAP |  |
| ∗Top 15 enriched GO BP terms are showed in the bar plot of each disease state in each tissue. Each row represents a significant GO biological process which is colored according to the -log10(p.adjust). |
| Page: 1 2 3 4 5 6 7 8 9 |
| GO ID | Tissue | Disease Stage | Description | Gene Ratio | Bg Ratio | pvalue | p.adjust | Count |
| GO:001063912 | Liver | HCC | negative regulation of organelle organization | 204/7958 | 348/18723 | 7.67e-10 | 2.37e-08 | 204 |
| GO:0000070 | Liver | HCC | mitotic sister chromatid segregation | 110/7958 | 168/18723 | 1.42e-09 | 4.25e-08 | 110 |
| GO:00008191 | Liver | HCC | sister chromatid segregation | 128/7958 | 202/18723 | 1.59e-09 | 4.73e-08 | 128 |
| GO:00447722 | Liver | HCC | mitotic cell cycle phase transition | 240/7958 | 424/18723 | 2.47e-09 | 6.84e-08 | 240 |
| GO:000734611 | Liver | HCC | regulation of mitotic cell cycle | 255/7958 | 457/18723 | 4.96e-09 | 1.30e-07 | 255 |
| GO:004873222 | Liver | HCC | gland development | 242/7958 | 436/18723 | 2.26e-08 | 5.28e-07 | 242 |
| GO:0007059 | Liver | HCC | chromosome segregation | 197/7958 | 346/18723 | 3.57e-08 | 7.87e-07 | 197 |
| GO:19019901 | Liver | HCC | regulation of mitotic cell cycle phase transition | 167/7958 | 299/18723 | 1.96e-06 | 2.71e-05 | 167 |
| GO:19019871 | Liver | HCC | regulation of cell cycle phase transition | 211/7958 | 390/18723 | 2.11e-06 | 2.89e-05 | 211 |
| GO:0098813 | Liver | HCC | nuclear chromosome segregation | 157/7958 | 281/18723 | 3.82e-06 | 4.95e-05 | 157 |
| GO:00000751 | Liver | HCC | cell cycle checkpoint | 100/7958 | 169/18723 | 8.75e-06 | 1.02e-04 | 100 |
| GO:0048285 | Liver | HCC | organelle fission | 254/7958 | 488/18723 | 1.07e-05 | 1.23e-04 | 254 |
| GO:0045786 | Liver | HCC | negative regulation of cell cycle | 204/7958 | 385/18723 | 1.84e-05 | 1.99e-04 | 204 |
| GO:0007080 | Liver | HCC | mitotic metaphase plate congression | 36/7958 | 50/18723 | 2.28e-05 | 2.41e-04 | 36 |
| GO:0045930 | Liver | HCC | negative regulation of mitotic cell cycle | 130/7958 | 235/18723 | 4.69e-05 | 4.50e-04 | 130 |
| GO:2001251 | Liver | HCC | negative regulation of chromosome organization | 55/7958 | 86/18723 | 4.80e-05 | 4.60e-04 | 55 |
| GO:0007091 | Liver | HCC | metaphase/anaphase transition of mitotic cell cycle | 42/7958 | 62/18723 | 5.18e-05 | 4.93e-04 | 42 |
| GO:0007093 | Liver | HCC | mitotic cell cycle checkpoint | 77/7958 | 129/18723 | 6.00e-05 | 5.50e-04 | 77 |
| GO:1905818 | Liver | HCC | regulation of chromosome separation | 47/7958 | 72/18723 | 7.95e-05 | 7.07e-04 | 47 |
| GO:0051983 | Liver | HCC | regulation of chromosome segregation | 57/7958 | 91/18723 | 8.35e-05 | 7.36e-04 | 57 |
| Page: 1 2 3 4 5 6 7 8 9 10 11 12 13 14 15 16 17 18 19 20 |
| Pathway ID | Tissue | Disease Stage | Description | Gene Ratio | Bg Ratio | pvalue | p.adjust | qvalue | Count |
| hsa0516620 | Cervix | CC | Human T-cell leukemia virus 1 infection | 61/1267 | 222/8465 | 8.13e-07 | 7.98e-06 | 4.72e-06 | 61 |
| hsa05166110 | Cervix | CC | Human T-cell leukemia virus 1 infection | 61/1267 | 222/8465 | 8.13e-07 | 7.98e-06 | 4.72e-06 | 61 |
| hsa052039 | Esophagus | HGIN | Viral carcinogenesis | 53/1383 | 204/8465 | 2.58e-04 | 2.71e-03 | 2.15e-03 | 53 |
| hsa0516639 | Esophagus | HGIN | Human T-cell leukemia virus 1 infection | 51/1383 | 222/8465 | 5.84e-03 | 4.05e-02 | 3.22e-02 | 51 |
| hsa041109 | Esophagus | HGIN | Cell cycle | 38/1383 | 157/8465 | 6.70e-03 | 4.37e-02 | 3.47e-02 | 38 |
| hsa0520315 | Esophagus | HGIN | Viral carcinogenesis | 53/1383 | 204/8465 | 2.58e-04 | 2.71e-03 | 2.15e-03 | 53 |
| hsa05166114 | Esophagus | HGIN | Human T-cell leukemia virus 1 infection | 51/1383 | 222/8465 | 5.84e-03 | 4.05e-02 | 3.22e-02 | 51 |
| hsa0411016 | Esophagus | HGIN | Cell cycle | 38/1383 | 157/8465 | 6.70e-03 | 4.37e-02 | 3.47e-02 | 38 |
| hsa0411023 | Esophagus | ESCC | Cell cycle | 126/4205 | 157/8465 | 1.34e-15 | 5.60e-14 | 2.87e-14 | 126 |
| hsa05166211 | Esophagus | ESCC | Human T-cell leukemia virus 1 infection | 164/4205 | 222/8465 | 8.13e-14 | 2.09e-12 | 1.07e-12 | 164 |
| hsa0520325 | Esophagus | ESCC | Viral carcinogenesis | 137/4205 | 204/8465 | 2.47e-07 | 1.88e-06 | 9.62e-07 | 137 |
| hsa041146 | Esophagus | ESCC | Oocyte meiosis | 77/4205 | 131/8465 | 2.19e-02 | 4.80e-02 | 2.46e-02 | 77 |
| hsa0411033 | Esophagus | ESCC | Cell cycle | 126/4205 | 157/8465 | 1.34e-15 | 5.60e-14 | 2.87e-14 | 126 |
| hsa05166310 | Esophagus | ESCC | Human T-cell leukemia virus 1 infection | 164/4205 | 222/8465 | 8.13e-14 | 2.09e-12 | 1.07e-12 | 164 |
| hsa0520335 | Esophagus | ESCC | Viral carcinogenesis | 137/4205 | 204/8465 | 2.47e-07 | 1.88e-06 | 9.62e-07 | 137 |
| hsa0411411 | Esophagus | ESCC | Oocyte meiosis | 77/4205 | 131/8465 | 2.19e-02 | 4.80e-02 | 2.46e-02 | 77 |
| hsa041102 | Liver | HCC | Cell cycle | 106/4020 | 157/8465 | 2.54e-07 | 3.04e-06 | 1.69e-06 | 106 |
| hsa0516622 | Liver | HCC | Human T-cell leukemia virus 1 infection | 139/4020 | 222/8465 | 3.17e-06 | 2.79e-05 | 1.55e-05 | 139 |
| hsa052032 | Liver | HCC | Viral carcinogenesis | 117/4020 | 204/8465 | 2.68e-03 | 8.98e-03 | 5.00e-03 | 117 |
| hsa041103 | Liver | HCC | Cell cycle | 106/4020 | 157/8465 | 2.54e-07 | 3.04e-06 | 1.69e-06 | 106 |
| Page: 1 2 3 |
Top |
Cell-cell communication analysis |
| Identification of potential cell-cell interactions between two cell types and their ligand-receptor pairs for different disease states |
| Ligand | Receptor | LRpair | Pathway | Tissue | Disease Stage |
| Page: 1 |
Top |
Single-cell gene regulatory network inference analysis |
| Find out the significant the regulons (TFs) and the target genes of each regulon across cell types for different disease states |
| TF | Cell Type | Tissue | Disease Stage | Target Gene | RSS | Regulon Activity |
| ∗The dot plots of a searched regulon are shown for all cell subpopulations in each disease state of each tissue based on the regulon specific score inferred using pySCENIC and by calculating the average expression. |
| Page: 1 |
Top |
Somatic mutation of malignant transformation related genes |
| Annotation of somatic variants for genes involved in malignant transformation |
| Hugo Symbol | Variant Class | Variant Classification | dbSNP RS | HGVSc | HGVSp | HGVSp Short | SWISSPROT | BIOTYPE | SIFT | PolyPhen | Tumor Sample Barcode | Tissue | Histology | Sex | Age | Stage | Therapy Types | Drugs | Outcome |
| MAD1L1 | SNV | Missense_Mutation | rs747276194 | c.1582N>T | p.Arg528Trp | p.R528W | Q9Y6D9 | protein_coding | deleterious(0) | probably_damaging(0.919) | TCGA-A2-A0YJ-01 | Breast | breast invasive carcinoma | Female | <65 | III/IV | Chemotherapy | cytoxan | PD |
| MAD1L1 | SNV | Missense_Mutation | novel | c.550N>A | p.Glu184Lys | p.E184K | Q9Y6D9 | protein_coding | deleterious(0.03) | benign(0.339) | TCGA-AC-A62V-01 | Breast | breast invasive carcinoma | Male | <65 | III/IV | Targeted Molecular therapy | denosumab | PD |
| MAD1L1 | SNV | Missense_Mutation | rs765227766 | c.754N>T | p.Leu252Phe | p.L252F | Q9Y6D9 | protein_coding | tolerated(0.3) | benign(0.011) | TCGA-AO-A128-01 | Breast | breast invasive carcinoma | Female | <65 | I/II | Chemotherapy | doxorubicin | SD |
| MAD1L1 | SNV | Missense_Mutation | c.1842N>C | p.Lys614Asn | p.K614N | Q9Y6D9 | protein_coding | deleterious(0) | probably_damaging(0.993) | TCGA-D8-A1JC-01 | Breast | breast invasive carcinoma | Female | <65 | III/IV | Chemotherapy | adriamycin | SD | |
| MAD1L1 | SNV | Missense_Mutation | rs775755086 | c.2084N>A | p.Arg695Gln | p.R695Q | Q9Y6D9 | protein_coding | tolerated(0.41) | benign(0.001) | TCGA-GM-A2D9-01 | Breast | breast invasive carcinoma | Female | >=65 | I/II | Hormone Therapy | arimidex | SD |
| MAD1L1 | SNV | Missense_Mutation | novel | c.839N>T | p.Gln280Leu | p.Q280L | Q9Y6D9 | protein_coding | deleterious(0.01) | benign(0.007) | TCGA-UU-A93S-01 | Breast | breast invasive carcinoma | Female | <65 | III/IV | Unknown | Unknown | PD |
| MAD1L1 | deletion | Frame_Shift_Del | novel | c.1563delN | p.Met521IlefsTer25 | p.M521Ifs*25 | Q9Y6D9 | protein_coding | TCGA-EW-A2FV-01 | Breast | breast invasive carcinoma | Female | <65 | III/IV | Chemotherapy | docetaxel | SD | ||
| MAD1L1 | deletion | Frame_Shift_Del | novel | c.1163delN | p.Glu388GlyfsTer35 | p.E388Gfs*35 | Q9Y6D9 | protein_coding | TCGA-EW-A2FV-01 | Breast | breast invasive carcinoma | Female | <65 | III/IV | Chemotherapy | docetaxel | SD | ||
| MAD1L1 | SNV | Missense_Mutation | rs371561369 | c.1666C>T | p.Arg556Cys | p.R556C | Q9Y6D9 | protein_coding | deleterious(0.02) | possibly_damaging(0.622) | TCGA-EA-A3HS-01 | Cervix | cervical & endocervical cancer | Female | <65 | I/II | Unknown | Unknown | SD |
| MAD1L1 | SNV | Missense_Mutation | rs377555260 | c.1531N>A | p.Glu511Lys | p.E511K | Q9Y6D9 | protein_coding | tolerated(0.09) | possibly_damaging(0.816) | TCGA-EA-A410-01 | Cervix | cervical & endocervical cancer | Female | <65 | I/II | Unknown | Unknown | SD |
| Page: 1 2 3 4 5 6 7 8 9 10 |
Top |
Related drugs of malignant transformation related genes |
| Identification of chemicals and drugs interact with genes involved in malignant transfromation |
| (DGIdb 4.0) |
| Entrez ID | Symbol | Category | Interaction Types | Drug Claim Name | Drug Name | PMIDs |
| 8379 | MAD1L1 | NA | carboplatin | CARBOPLATIN | 23407047 | |
| 8379 | MAD1L1 | NA | paclitaxel | PACLITAXEL | 23407047 |
| Page: 1 |

Copyright 2023-Present -The University of Texas Health Science Center at Houston |