
|
|||||
|
 | |
| |
| |
| |
| |
| |
|
Gene: LPIN1 |
Gene summary for LPIN1 |
| Gene information | Species | Human | Gene symbol | LPIN1 | Gene ID | 23175 |
| Gene name | lipin 1 | |
| Gene Alias | PAP1 | |
| Cytomap | 2p25.1 | |
| Gene Type | protein-coding | GO ID | GO:0000278 | UniProtAcc | Q14693 |
Top |
Malignant transformation analysis |
| Identification of the aberrant gene expression in precancerous and cancerous lesions by comparing the gene expression of stem-like cells in diseased tissues with normal stem cells |
| Entrez ID | Symbol | Replicates | Species | Organ | Tissue | Adj P-value | Log2FC | Malignancy |
| 23175 | LPIN1 | LZE4T | Human | Esophagus | ESCC | 1.24e-06 | 1.22e-01 | 0.0811 |
| 23175 | LPIN1 | LZE7T | Human | Esophagus | ESCC | 3.50e-03 | 5.21e-01 | 0.0667 |
| 23175 | LPIN1 | LZE8T | Human | Esophagus | ESCC | 4.28e-02 | -6.22e-02 | 0.067 |
| 23175 | LPIN1 | LZE24T | Human | Esophagus | ESCC | 1.84e-07 | 1.86e-02 | 0.0596 |
| 23175 | LPIN1 | LZE21T | Human | Esophagus | ESCC | 2.62e-02 | 1.32e-02 | 0.0655 |
| 23175 | LPIN1 | LZE6T | Human | Esophagus | ESCC | 9.65e-03 | 2.55e-02 | 0.0845 |
| 23175 | LPIN1 | P2T-E | Human | Esophagus | ESCC | 2.80e-17 | 2.80e-01 | 0.1177 |
| 23175 | LPIN1 | P4T-E | Human | Esophagus | ESCC | 5.46e-11 | 5.10e-02 | 0.1323 |
| 23175 | LPIN1 | P5T-E | Human | Esophagus | ESCC | 1.37e-02 | -1.64e-01 | 0.1327 |
| 23175 | LPIN1 | P8T-E | Human | Esophagus | ESCC | 1.99e-06 | -8.97e-02 | 0.0889 |
| 23175 | LPIN1 | P9T-E | Human | Esophagus | ESCC | 4.57e-11 | 2.50e-02 | 0.1131 |
| 23175 | LPIN1 | P10T-E | Human | Esophagus | ESCC | 1.63e-28 | 5.13e-01 | 0.116 |
| 23175 | LPIN1 | P11T-E | Human | Esophagus | ESCC | 4.33e-04 | -6.30e-02 | 0.1426 |
| 23175 | LPIN1 | P12T-E | Human | Esophagus | ESCC | 1.22e-15 | 9.28e-02 | 0.1122 |
| 23175 | LPIN1 | P15T-E | Human | Esophagus | ESCC | 4.39e-15 | 1.01e-01 | 0.1149 |
| 23175 | LPIN1 | P16T-E | Human | Esophagus | ESCC | 2.06e-10 | 9.11e-02 | 0.1153 |
| 23175 | LPIN1 | P20T-E | Human | Esophagus | ESCC | 1.02e-06 | -6.90e-02 | 0.1124 |
| 23175 | LPIN1 | P21T-E | Human | Esophagus | ESCC | 1.11e-15 | 1.03e-01 | 0.1617 |
| 23175 | LPIN1 | P22T-E | Human | Esophagus | ESCC | 2.55e-19 | 2.99e-01 | 0.1236 |
| 23175 | LPIN1 | P23T-E | Human | Esophagus | ESCC | 3.05e-11 | 1.60e-01 | 0.108 |
| Page: 1 2 3 4 5 |
| Tissue | Expression Dynamics | Abbreviation |
| Esophagus |  | ESCC: Esophageal squamous cell carcinoma |
| HGIN: High-grade intraepithelial neoplasias | ||
| LGIN: Low-grade intraepithelial neoplasias | ||
| Liver |  | HCC: Hepatocellular carcinoma |
| NAFLD: Non-alcoholic fatty liver disease | ||
| Oral Cavity | 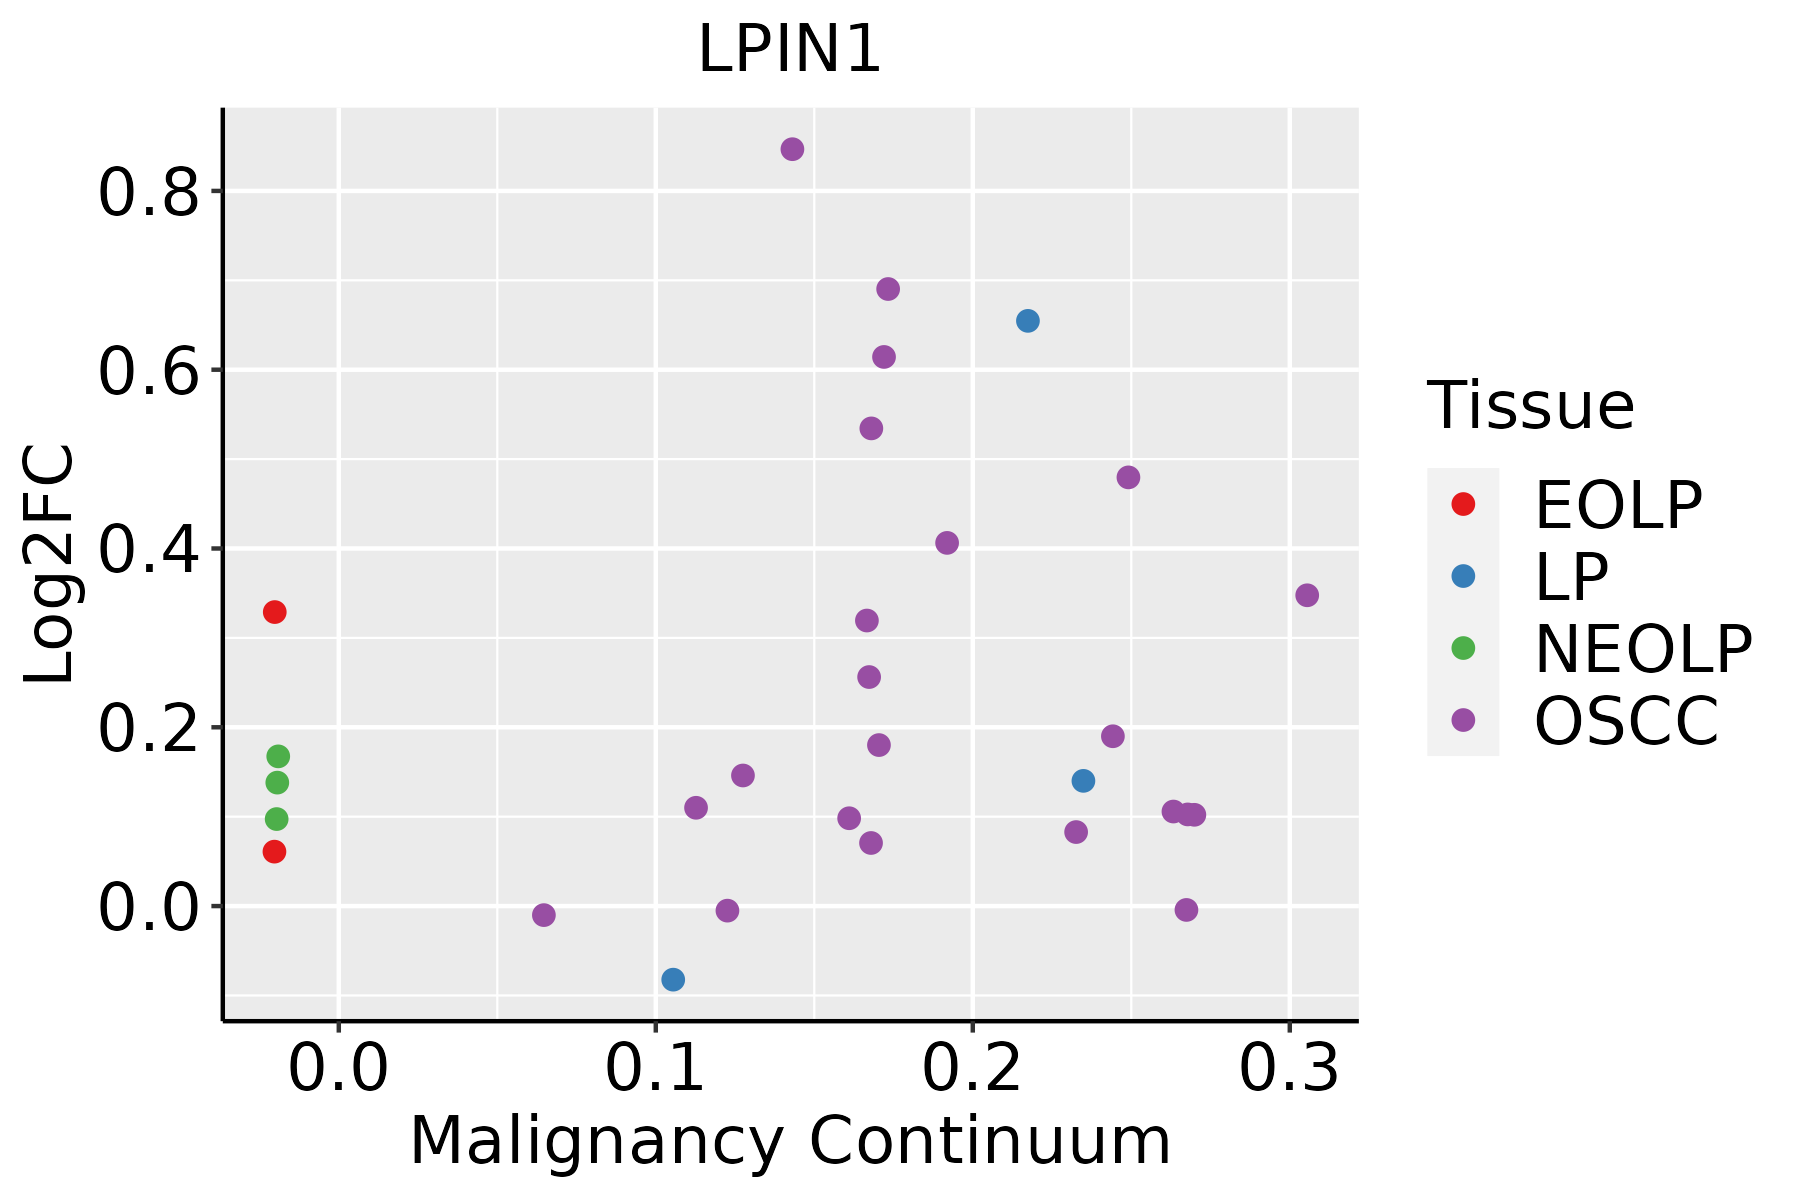 | EOLP: Erosive Oral lichen planus |
| LP: leukoplakia | ||
| NEOLP: Non-erosive oral lichen planus | ||
| OSCC: Oral squamous cell carcinoma | ||
| Thyroid | 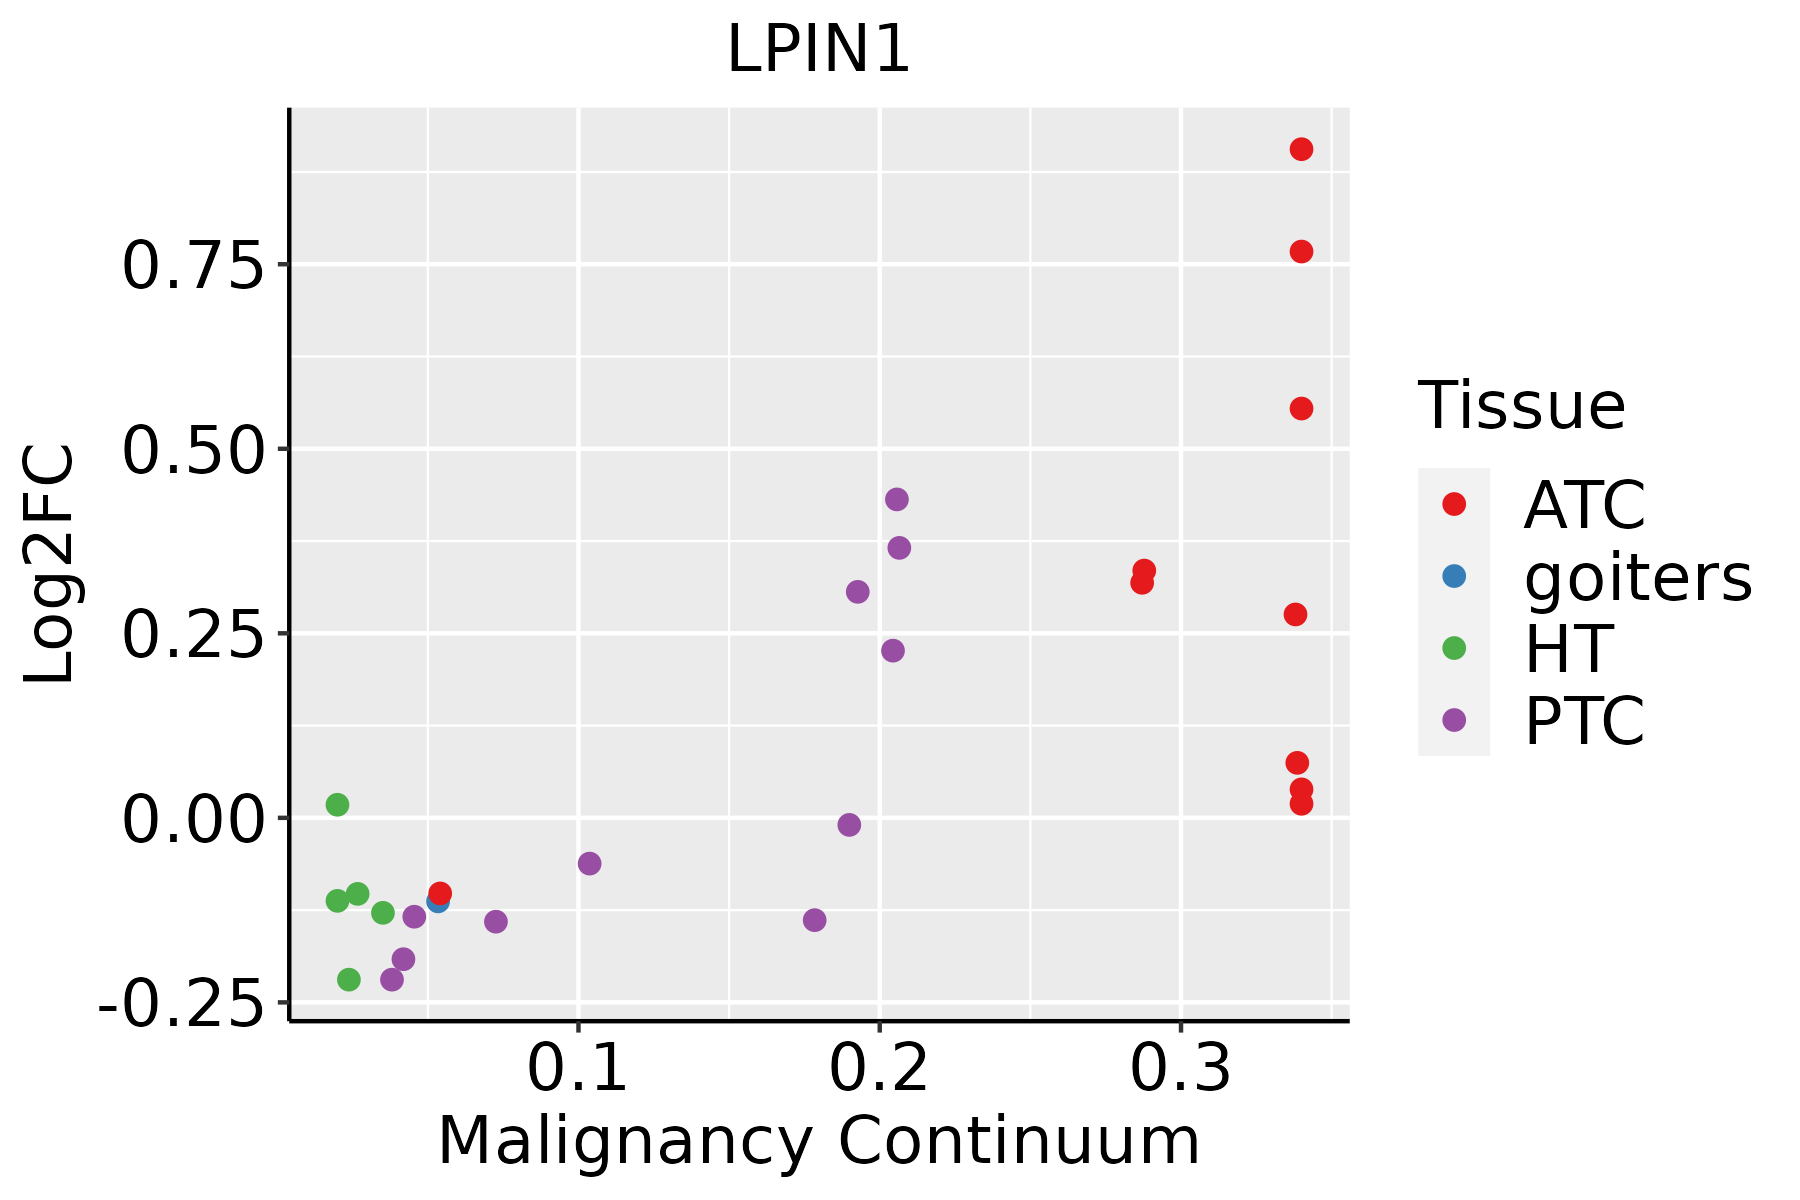 | ATC: Anaplastic thyroid cancer |
| HT: Hashimoto's thyroiditis | ||
| PTC: Papillary thyroid cancer |
| ∗log2FC in expression of this searched gene in stem-like cells from each diseased tissue sample relative to stem-like cells in normal samples in each tissue plotted against the malignancy continuum. Samples are colored based on if they are from different disease stage. |
Top |
Malignant transformation related pathway analysis |
| Find out the enriched GO biological processes and KEGG pathways involved in transition from healthy to precancer to cancer |
| Tissue | Disease Stage | Enriched GO biological Processes |
| Colorectum | AD |  |
| Colorectum | SER |  |
| Colorectum | MSS |  |
| Colorectum | MSI-H |  |
| Colorectum | FAP |  |
| ∗Top 15 enriched GO BP terms are showed in the bar plot of each disease state in each tissue. Each row represents a significant GO biological process which is colored according to the -log10(p.adjust). |
| Page: 1 2 3 4 5 6 7 8 9 |
| GO ID | Tissue | Disease Stage | Description | Gene Ratio | Bg Ratio | pvalue | p.adjust | Count |
| GO:00310999 | Oral cavity | OSCC | regeneration | 114/7305 | 198/18723 | 8.54e-08 | 1.50e-06 | 114 |
| GO:003286916 | Oral cavity | OSCC | cellular response to insulin stimulus | 114/7305 | 203/18723 | 5.07e-07 | 7.41e-06 | 114 |
| GO:007137510 | Oral cavity | OSCC | cellular response to peptide hormone stimulus | 153/7305 | 290/18723 | 1.23e-06 | 1.63e-05 | 153 |
| GO:004343419 | Oral cavity | OSCC | response to peptide hormone | 208/7305 | 414/18723 | 1.83e-06 | 2.35e-05 | 208 |
| GO:003286816 | Oral cavity | OSCC | response to insulin | 138/7305 | 264/18723 | 7.54e-06 | 8.15e-05 | 138 |
| GO:00086543 | Oral cavity | OSCC | phospholipid biosynthetic process | 130/7305 | 253/18723 | 3.96e-05 | 3.46e-04 | 130 |
| GO:00090627 | Oral cavity | OSCC | fatty acid catabolic process | 59/7305 | 100/18723 | 3.99e-05 | 3.48e-04 | 59 |
| GO:00066317 | Oral cavity | OSCC | fatty acid metabolic process | 186/7305 | 390/18723 | 2.65e-04 | 1.69e-03 | 186 |
| GO:00311008 | Oral cavity | OSCC | animal organ regeneration | 45/7305 | 76/18723 | 2.83e-04 | 1.79e-03 | 45 |
| GO:00723296 | Oral cavity | OSCC | monocarboxylic acid catabolic process | 66/7305 | 122/18723 | 5.02e-04 | 2.95e-03 | 66 |
| GO:00510813 | Oral cavity | OSCC | nuclear envelope disassembly | 10/7305 | 11/18723 | 5.78e-04 | 3.30e-03 | 10 |
| GO:00072723 | Oral cavity | OSCC | ensheathment of neurons | 72/7305 | 136/18723 | 6.59e-04 | 3.70e-03 | 72 |
| GO:00083663 | Oral cavity | OSCC | axon ensheathment | 72/7305 | 136/18723 | 6.59e-04 | 3.70e-03 | 72 |
| GO:00425523 | Oral cavity | OSCC | myelination | 71/7305 | 134/18723 | 6.93e-04 | 3.86e-03 | 71 |
| GO:00519605 | Oral cavity | OSCC | regulation of nervous system development | 205/7305 | 443/18723 | 9.80e-04 | 5.11e-03 | 205 |
| GO:00303973 | Oral cavity | OSCC | membrane disassembly | 10/7305 | 12/18723 | 2.25e-03 | 1.00e-02 | 10 |
| GO:00442826 | Oral cavity | OSCC | small molecule catabolic process | 174/7305 | 376/18723 | 2.25e-03 | 1.00e-02 | 174 |
| GO:001092110 | Oral cavity | OSCC | regulation of phosphatase activity | 46/7305 | 84/18723 | 2.43e-03 | 1.07e-02 | 46 |
| GO:00442426 | Oral cavity | OSCC | cellular lipid catabolic process | 104/7305 | 214/18723 | 2.61e-03 | 1.15e-02 | 104 |
| GO:00468906 | Oral cavity | OSCC | regulation of lipid biosynthetic process | 85/7305 | 171/18723 | 2.79e-03 | 1.21e-02 | 85 |
| Page: 1 2 3 4 5 6 7 8 9 10 11 12 |
| Pathway ID | Tissue | Disease Stage | Description | Gene Ratio | Bg Ratio | pvalue | p.adjust | qvalue | Count |
| hsa041505 | Esophagus | ESCC | mTOR signaling pathway | 98/4205 | 156/8465 | 5.81e-04 | 1.95e-03 | 9.97e-04 | 98 |
| hsa0415013 | Esophagus | ESCC | mTOR signaling pathway | 98/4205 | 156/8465 | 5.81e-04 | 1.95e-03 | 9.97e-04 | 98 |
| hsa049362 | Liver | HCC | Alcoholic liver disease | 89/4020 | 142/8465 | 1.73e-04 | 8.53e-04 | 4.75e-04 | 89 |
| hsa041502 | Liver | HCC | mTOR signaling pathway | 95/4020 | 156/8465 | 4.70e-04 | 1.99e-03 | 1.11e-03 | 95 |
| hsa005615 | Liver | HCC | Glycerolipid metabolism | 41/4020 | 63/8465 | 3.59e-03 | 1.12e-02 | 6.22e-03 | 41 |
| hsa049363 | Liver | HCC | Alcoholic liver disease | 89/4020 | 142/8465 | 1.73e-04 | 8.53e-04 | 4.75e-04 | 89 |
| hsa0415011 | Liver | HCC | mTOR signaling pathway | 95/4020 | 156/8465 | 4.70e-04 | 1.99e-03 | 1.11e-03 | 95 |
| hsa0056112 | Liver | HCC | Glycerolipid metabolism | 41/4020 | 63/8465 | 3.59e-03 | 1.12e-02 | 6.22e-03 | 41 |
| hsa041504 | Oral cavity | OSCC | mTOR signaling pathway | 90/3704 | 156/8465 | 2.87e-04 | 9.15e-04 | 4.66e-04 | 90 |
| hsa049365 | Oral cavity | OSCC | Alcoholic liver disease | 78/3704 | 142/8465 | 4.53e-03 | 1.12e-02 | 5.68e-03 | 78 |
| hsa0415012 | Oral cavity | OSCC | mTOR signaling pathway | 90/3704 | 156/8465 | 2.87e-04 | 9.15e-04 | 4.66e-04 | 90 |
| hsa0493612 | Oral cavity | OSCC | Alcoholic liver disease | 78/3704 | 142/8465 | 4.53e-03 | 1.12e-02 | 5.68e-03 | 78 |
| hsa0415021 | Oral cavity | EOLP | mTOR signaling pathway | 34/1218 | 156/8465 | 7.59e-03 | 2.17e-02 | 1.28e-02 | 34 |
| hsa041503 | Oral cavity | EOLP | mTOR signaling pathway | 34/1218 | 156/8465 | 7.59e-03 | 2.17e-02 | 1.28e-02 | 34 |
| Page: 1 |
Top |
Cell-cell communication analysis |
| Identification of potential cell-cell interactions between two cell types and their ligand-receptor pairs for different disease states |
| Ligand | Receptor | LRpair | Pathway | Tissue | Disease Stage |
| Page: 1 |
Top |
Single-cell gene regulatory network inference analysis |
| Find out the significant the regulons (TFs) and the target genes of each regulon across cell types for different disease states |
| TF | Cell Type | Tissue | Disease Stage | Target Gene | RSS | Regulon Activity |
| ∗The dot plots of a searched regulon are shown for all cell subpopulations in each disease state of each tissue based on the regulon specific score inferred using pySCENIC and by calculating the average expression. |
| Page: 1 |
Top |
Somatic mutation of malignant transformation related genes |
| Annotation of somatic variants for genes involved in malignant transformation |
| Hugo Symbol | Variant Class | Variant Classification | dbSNP RS | HGVSc | HGVSp | HGVSp Short | SWISSPROT | BIOTYPE | SIFT | PolyPhen | Tumor Sample Barcode | Tissue | Histology | Sex | Age | Stage | Therapy Types | Drugs | Outcome |
| LPIN1 | SNV | Missense_Mutation | c.195N>T | p.Lys65Asn | p.K65N | Q14693 | protein_coding | deleterious(0) | probably_damaging(0.999) | TCGA-A8-A09Z-01 | Breast | breast invasive carcinoma | Female | >=65 | I/II | Unknown | Unknown | SD | |
| LPIN1 | SNV | Missense_Mutation | c.485N>T | p.Ala162Val | p.A162V | Q14693 | protein_coding | tolerated(0.2) | benign(0.007) | TCGA-BH-A0BZ-01 | Breast | breast invasive carcinoma | Female | <65 | III/IV | Chemotherapy | doxorubicin | CR | |
| LPIN1 | SNV | Missense_Mutation | rs371419134 | c.584N>T | p.Pro195Leu | p.P195L | Q14693 | protein_coding | tolerated(0.36) | benign(0) | TCGA-BH-A208-01 | Breast | breast invasive carcinoma | Female | <65 | I/II | Unknown | Unknown | SD |
| LPIN1 | SNV | Missense_Mutation | rs776351541 | c.2605N>G | p.Lys869Glu | p.K869E | Q14693 | protein_coding | deleterious(0.02) | possibly_damaging(0.846) | TCGA-E9-A22A-01 | Breast | breast invasive carcinoma | Female | >=65 | I/II | Hormone Therapy | tamoxiphen | SD |
| LPIN1 | SNV | Missense_Mutation | rs754012602 | c.1388C>T | p.Thr463Met | p.T463M | Q14693 | protein_coding | tolerated(0.12) | benign(0.21) | TCGA-GM-A5PV-01 | Breast | breast invasive carcinoma | Female | <65 | I/II | Chemotherapy | taxotere | CR |
| LPIN1 | SNV | Missense_Mutation | c.195G>T | p.Lys65Asn | p.K65N | Q14693 | protein_coding | deleterious(0) | probably_damaging(0.999) | TCGA-2W-A8YY-01 | Cervix | cervical & endocervical cancer | Female | <65 | I/II | Chemotherapy | cisplatin | CR | |
| LPIN1 | SNV | Missense_Mutation | rs746840869 | c.1525G>A | p.Ala509Thr | p.A509T | Q14693 | protein_coding | tolerated(0.51) | benign(0.003) | TCGA-2W-A8YY-01 | Cervix | cervical & endocervical cancer | Female | <65 | I/II | Chemotherapy | cisplatin | CR |
| LPIN1 | SNV | Missense_Mutation | novel | c.2525G>A | p.Ser842Asn | p.S842N | Q14693 | protein_coding | deleterious(0.02) | probably_damaging(0.999) | TCGA-2W-A8YY-01 | Cervix | cervical & endocervical cancer | Female | <65 | I/II | Chemotherapy | cisplatin | CR |
| LPIN1 | SNV | Missense_Mutation | c.1068N>A | p.Met356Ile | p.M356I | Q14693 | protein_coding | deleterious(0.04) | probably_damaging(0.977) | TCGA-C5-A7CO-01 | Cervix | cervical & endocervical cancer | Female | >=65 | I/II | Chemotherapy | cisplatin | SD | |
| LPIN1 | SNV | Missense_Mutation | c.824N>T | p.Ser275Leu | p.S275L | Q14693 | protein_coding | tolerated(0.13) | benign(0.025) | TCGA-EK-A2RJ-01 | Cervix | cervical & endocervical cancer | Female | <65 | I/II | Unknown | Unknown | SD |
| Page: 1 2 3 4 5 6 7 8 9 10 |
Top |
Related drugs of malignant transformation related genes |
| Identification of chemicals and drugs interact with genes involved in malignant transfromation |
| (DGIdb 4.0) |
| Entrez ID | Symbol | Category | Interaction Types | Drug Claim Name | Drug Name | PMIDs |
| 23175 | LPIN1 | ENZYME | rosiglitazone | ROSIGLITAZONE | 18693052 |
| Page: 1 |

Copyright 2023-Present -The University of Texas Health Science Center at Houston |