Schematic overview of the cellular and molecular mechanisms involved in the cancer progression, including the proposed cellular and molecular mechanisms in cancer cells trajectory. AT1: alveolar type 1 cells; AT2: alveolar type 2 cells; AAH: atypical adenomatous hyperplasia; AIS: adenocarcinoma in situ; MIA: minimally invasive adenocarcinoma; IA: invasive adenocarcinoma; EMT: epithelial-mesenchymal transition

Home

Download

Statistics

Help

Contact

Center for Computational Systems Medicine
leaf

Gene summary

leaf

Malignant transformation analysis

leaf

Malignant transformation related pathway analysis

leaf

Cell-cell communication analysis

leaf

Single-cell gene regulatory network inference analysis

leaf

Somatic mutation of malignant transformation related genes

leaf

Related drugs of malignant transformation related genes

Gene: LDLRAD4

Gene summary for LDLRAD4

check button Gene summary.

Gene informationSpeciesHuman
Gene symbol

LDLRAD4

Gene ID

753

Gene namelow density lipoprotein receptor class A domain containing 4
Gene AliasC18orf1
Cytomap18p11.21
Gene Typeprotein-coding
GO ID

GO:0001837

UniProtAcc

O15165


Top

Malignant transformation analysis

check button Identification of the aberrant gene expression in precancerous and cancerous lesions by comparing the gene expression of stem-like cells in diseased tissues with normal stem cells
check button Malignant transformation involving gene list.
Entrez IDSymbolReplicatesSpeciesOrganTissueAdj P-valueLog2FCMalignancy
753LDLRAD4GSM4909286HumanBreastIDC8.53e-051.41e-010.1081
753LDLRAD4GSM4909290HumanBreastIDC1.16e-103.74e-010.2096
753LDLRAD4GSM4909304HumanBreastIDC1.87e-195.27e-010.1636
753LDLRAD4GSM4909305HumanBreastIDC3.42e-104.17e-010.0436
753LDLRAD4GSM4909306HumanBreastIDC2.54e-143.42e-010.1564
753LDLRAD4GSM4909307HumanBreastIDC5.42e-245.97e-010.1569
753LDLRAD4GSM4909308HumanBreastIDC1.31e-316.05e-010.158
753LDLRAD4GSM4909317HumanBreastIDC1.14e-053.01e-010.1355
753LDLRAD4GSM4909320HumanBreastIDC1.76e-055.98e-010.1575
753LDLRAD4P3HumanBreastIDC5.87e-056.35e-010.1542
753LDLRAD4DCIS2HumanBreastDCIS5.14e-562.35e-010.0085
753LDLRAD4HTA11_3410_2000001011HumanColorectumAD5.29e-27-6.95e-010.0155
753LDLRAD4HTA11_2487_2000001011HumanColorectumSER1.57e-18-8.60e-01-0.1808
753LDLRAD4HTA11_78_2000001011HumanColorectumAD8.83e-05-5.43e-01-0.1088
753LDLRAD4HTA11_411_2000001011HumanColorectumSER7.88e-07-9.18e-01-0.2602
753LDLRAD4HTA11_2112_2000001011HumanColorectumSER7.04e-11-9.75e-01-0.2196
753LDLRAD4HTA11_3361_2000001011HumanColorectumAD3.12e-11-6.76e-01-0.1207
753LDLRAD4HTA11_83_2000001011HumanColorectumSER7.95e-08-4.87e-01-0.1526
753LDLRAD4HTA11_696_2000001011HumanColorectumAD1.16e-05-1.74e-01-0.1464
753LDLRAD4HTA11_2992_2000001011HumanColorectumSER1.75e-02-7.07e-01-0.1706
Page: 1 2 3 4 5 6 

check button Transcriptomic changes along malignancy continuum.
TissueExpression DynamicsAbbreviation
BreastThe image shows the transcriptomic changes along malignancy continuum.log2FC in expression of this searched gene in stem-like cells from each diseased tissue sample relative to stem-like cells in normal samples in each tissue plotted against the malignancy continuum. Samples are colored based on if they are from different disease stage.
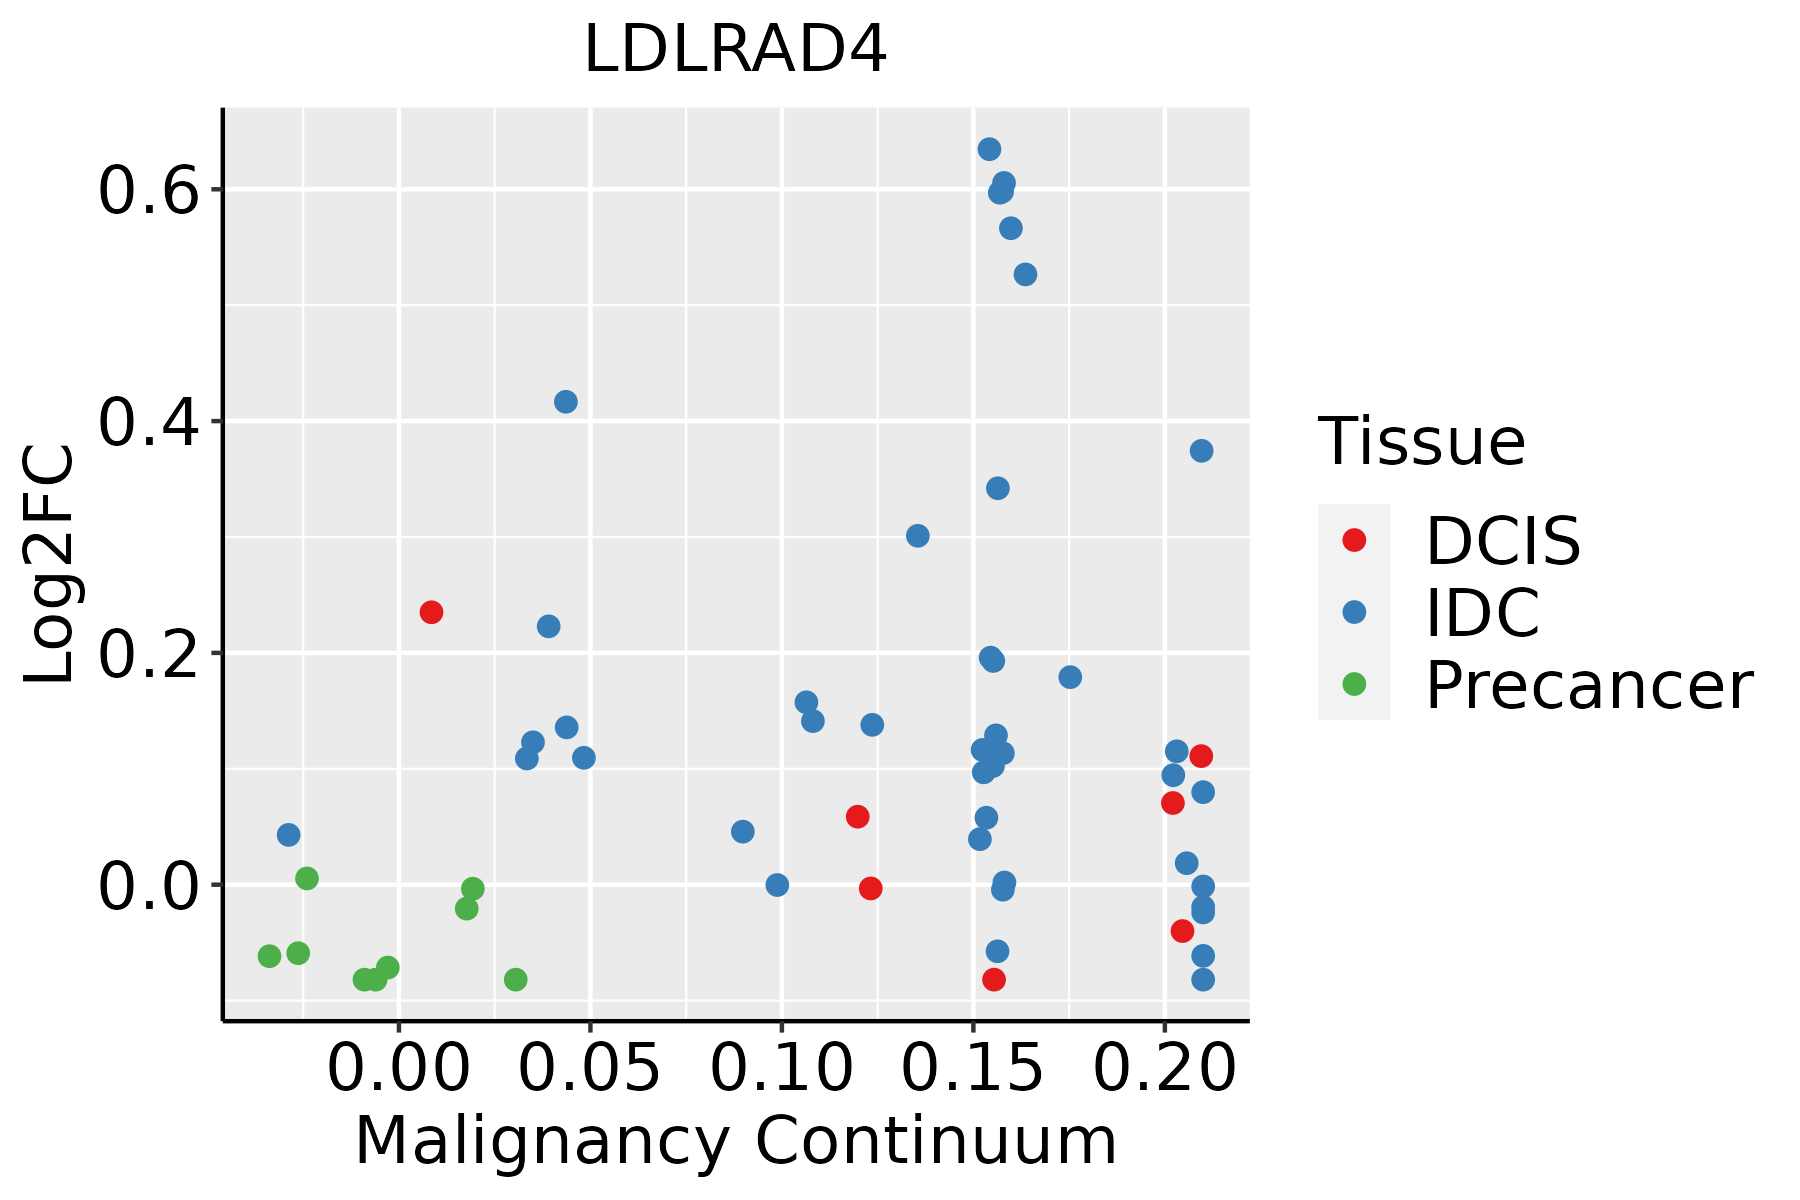
IDC: Invasive ductal carcinoma
DCIS: Ductal carcinoma in situ
Precancer(BRCA1-mut): Precancerous lesion from BRCA1 mutation carriers
Colorectum (GSE201348)The image shows the transcriptomic changes along malignancy continuum.log2FC in expression of this searched gene in stem-like cells from each diseased tissue sample relative to stem-like cells in normal samples in each tissue plotted against the malignancy continuum. Samples are colored based on if they are from different disease stage.FAP: Familial adenomatous polyposis
CRC: Colorectal cancer
Colorectum (HTA11)The image shows the transcriptomic changes along malignancy continuum.log2FC in expression of this searched gene in stem-like cells from each diseased tissue sample relative to stem-like cells in normal samples in each tissue plotted against the malignancy continuum. Samples are colored based on if they are from different disease stage.AD: Adenomas
SER: Sessile serrated lesions
MSI-H: Microsatellite-high colorectal cancer
MSS: Microsatellite stable colorectal cancer
EndometriumThe image shows the transcriptomic changes along malignancy continuum.log2FC in expression of this searched gene in stem-like cells from each diseased tissue sample relative to stem-like cells in normal samples in each tissue plotted against the malignancy continuum. Samples are colored based on if they are from different disease stage.
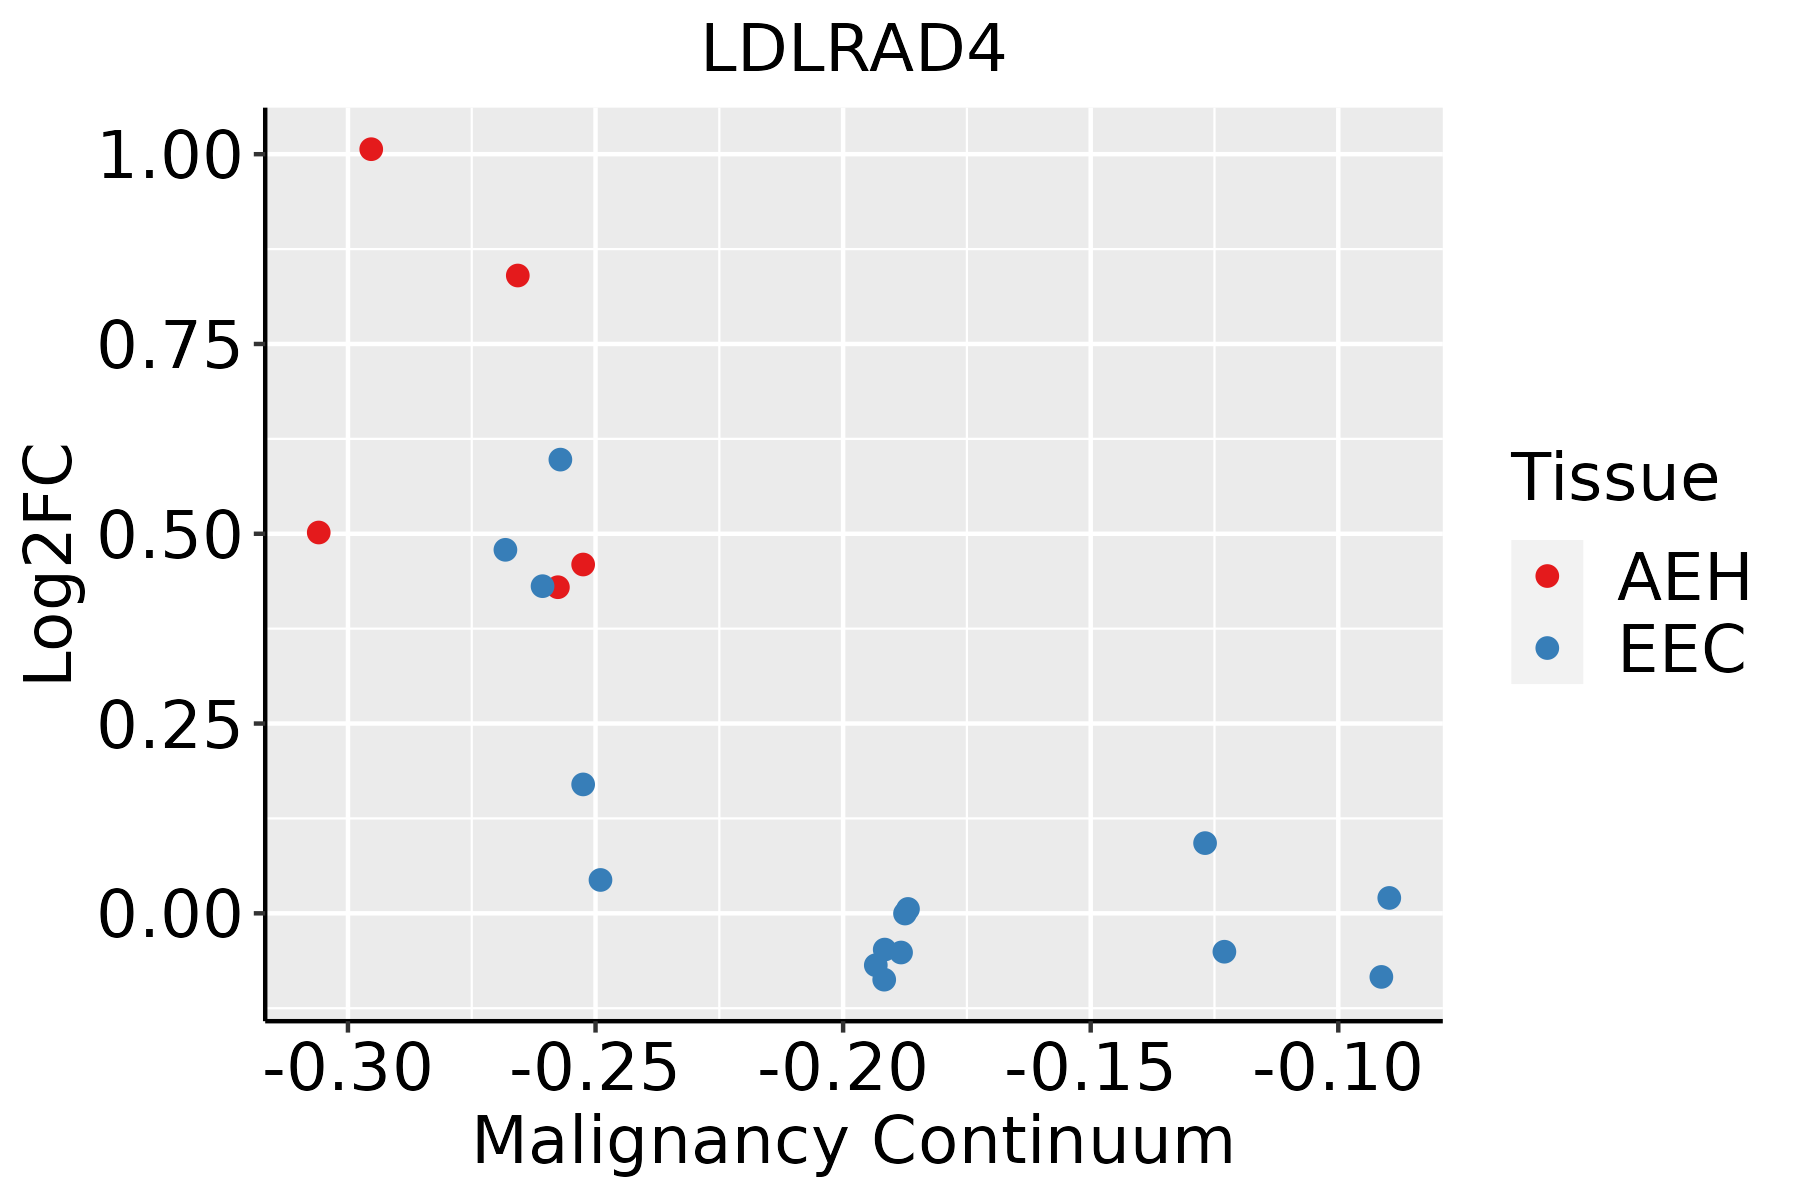
AEH: Atypical endometrial hyperplasia
EEC: Endometrioid Cancer
LiverThe image shows the transcriptomic changes along malignancy continuum.log2FC in expression of this searched gene in stem-like cells from each diseased tissue sample relative to stem-like cells in normal samples in each tissue plotted against the malignancy continuum. Samples are colored based on if they are from different disease stage.
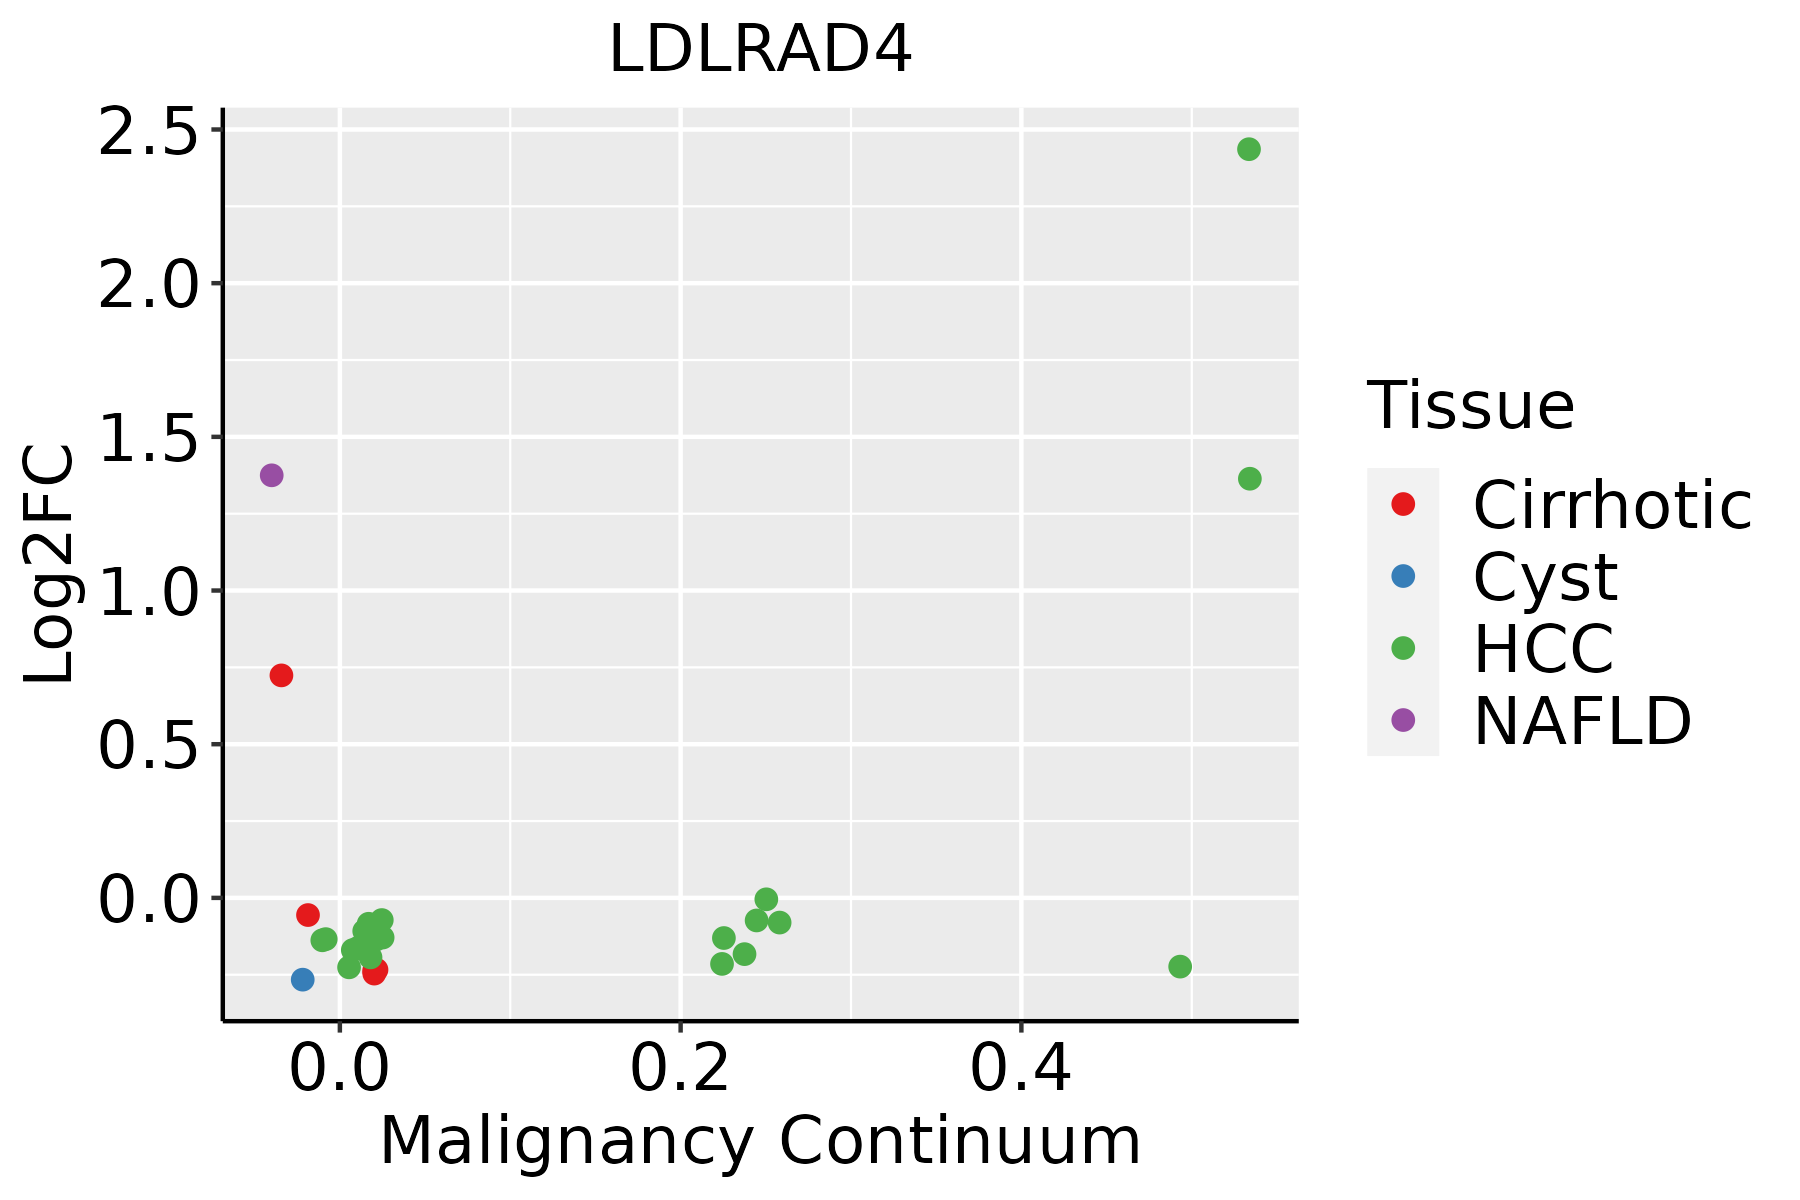
HCC: Hepatocellular carcinoma
NAFLD: Non-alcoholic fatty liver disease
LungThe image shows the transcriptomic changes along malignancy continuum.log2FC in expression of this searched gene in stem-like cells from each diseased tissue sample relative to stem-like cells in normal samples in each tissue plotted against the malignancy continuum. Samples are colored based on if they are from different disease stage.
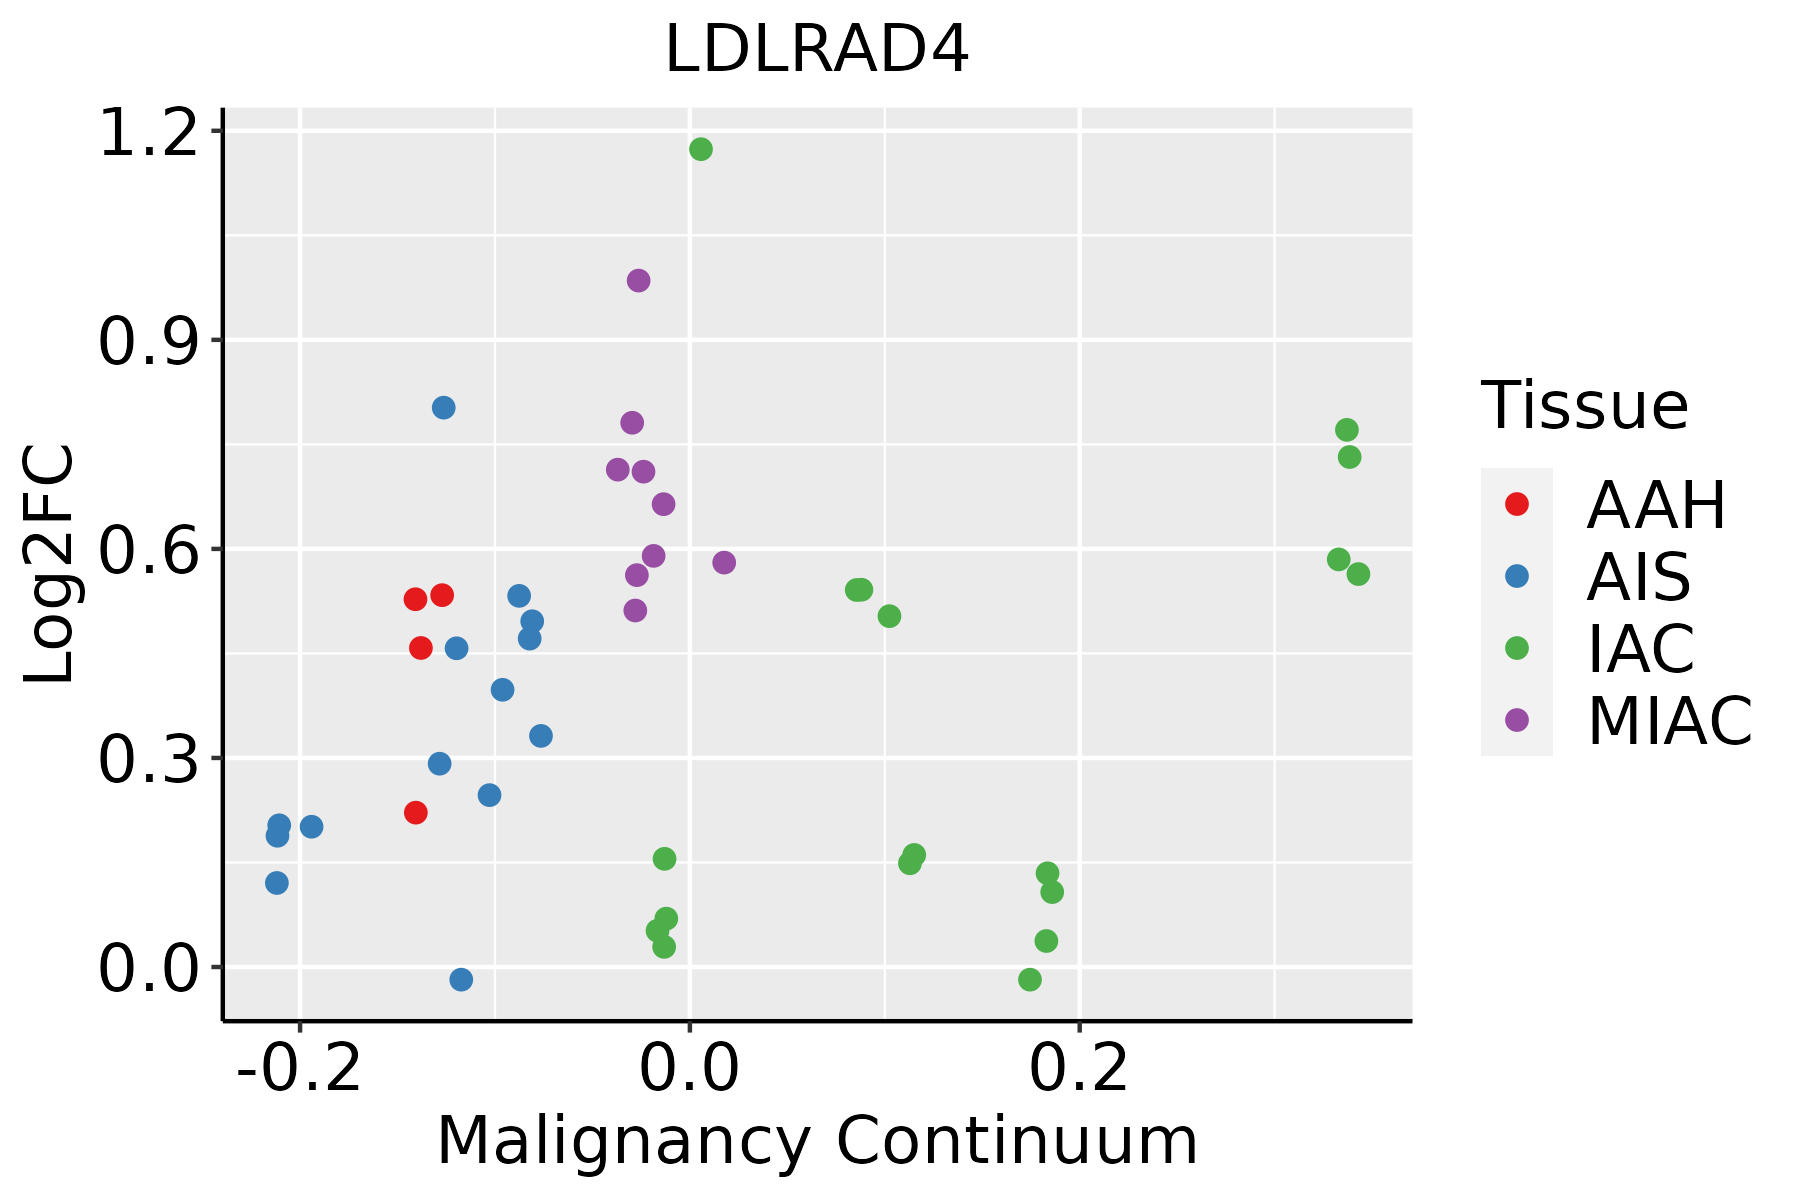
AAH: Atypical adenomatous hyperplasia
AIS: Adenocarcinoma in situ
IAC: Invasive lung adenocarcinoma
MIA: Minimally invasive adenocarcinoma
Oral CavityThe image shows the transcriptomic changes along malignancy continuum.log2FC in expression of this searched gene in stem-like cells from each diseased tissue sample relative to stem-like cells in normal samples in each tissue plotted against the malignancy continuum. Samples are colored based on if they are from different disease stage.
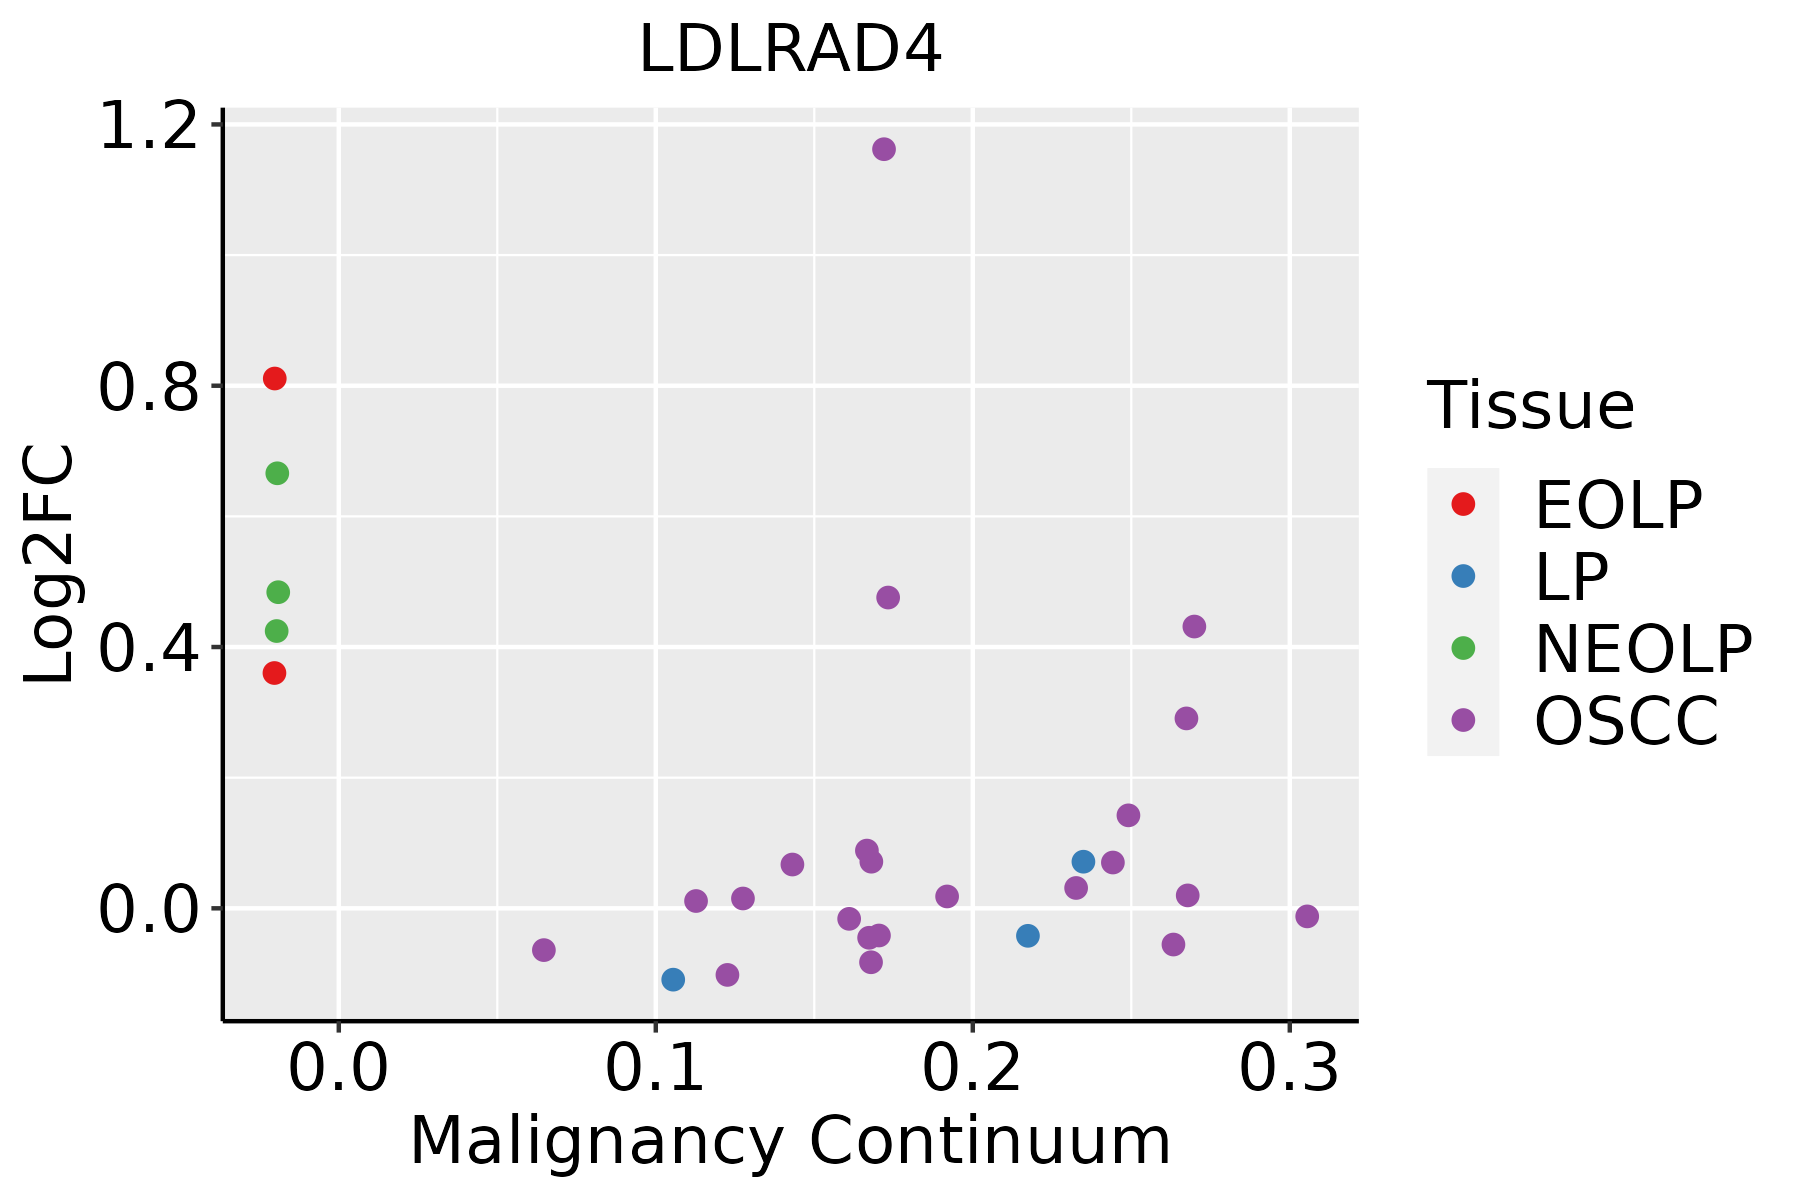
EOLP: Erosive Oral lichen planus
LP: leukoplakia
NEOLP: Non-erosive oral lichen planus
OSCC: Oral squamous cell carcinoma
∗log2FC in expression of this searched gene in stem-like cells from each diseased tissue sample relative to stem-like cells in normal samples in each tissue plotted against the malignancy continuum. Samples are colored based on if they are from different disease stage.

Top

Malignant transformation related pathway analysis

check buttonFind out the enriched GO biological processes and KEGG pathways involved in transition from healthy to precancer to cancer
check button Figure of enriched GO biological processes.
TissueDisease StageEnriched GO biological Processes
ColorectumADGO analysis - Figure of enriched GO biological processes: Top 15 enriched GO BP terms are showed in the bar plot of each disease state in each tissue. Each row represents a significant GO biological process which is colored according to the -log10(p.adjust).
ColorectumSERGO analysis - Figure of enriched GO biological processes: Top 15 enriched GO BP terms are showed in the bar plot of each disease state in each tissue. Each row represents a significant GO biological process which is colored according to the -log10(p.adjust).
ColorectumMSSGO analysis - Figure of enriched GO biological processes: Top 15 enriched GO BP terms are showed in the bar plot of each disease state in each tissue. Each row represents a significant GO biological process which is colored according to the -log10(p.adjust).
ColorectumMSI-HGO analysis - Figure of enriched GO biological processes: Top 15 enriched GO BP terms are showed in the bar plot of each disease state in each tissue. Each row represents a significant GO biological process which is colored according to the -log10(p.adjust).
ColorectumFAPGO analysis - Figure of enriched GO biological processes: Top 15 enriched GO BP terms are showed in the bar plot of each disease state in each tissue. Each row represents a significant GO biological process which is colored according to the -log10(p.adjust).
∗Top 15 enriched GO BP terms are showed in the bar plot of each disease state in each tissue. Each row represents a significant GO biological process which is colored according to the -log10(p.adjust).
Page: 1 2 3 4 5 6 7 8 9 

check button Enriched GO biological processes.
GO IDTissueDisease StageDescriptionGene RatioBg Ratiopvaluep.adjustCount
GO:00071784LiverNAFLDtransmembrane receptor protein serine/threonine kinase signaling pathway56/1882355/187234.50e-046.62e-0356
GO:00019337LiverNAFLDnegative regulation of protein phosphorylation52/1882342/187231.63e-031.74e-0252
GO:19038443LiverNAFLDregulation of cellular response to transforming growth factor beta stimulus23/1882131/187235.62e-034.29e-0223
GO:004325412LiverCirrhoticregulation of protein-containing complex assembly169/4634428/187237.40e-124.99e-10169
GO:00313337LiverCirrhoticnegative regulation of protein-containing complex assembly64/4634141/187237.08e-082.14e-0664
GO:004593612LiverCirrhoticnegative regulation of phosphate metabolic process154/4634441/187238.78e-071.83e-05154
GO:001056312LiverCirrhoticnegative regulation of phosphorus metabolic process154/4634442/187231.02e-062.11e-05154
GO:004232612LiverCirrhoticnegative regulation of phosphorylation135/4634385/187233.17e-065.58e-05135
GO:007155911LiverCirrhoticresponse to transforming growth factor beta96/4634256/187233.55e-066.09e-0596
GO:007156011LiverCirrhoticcellular response to transforming growth factor beta stimulus93/4634250/187237.34e-061.13e-0493
GO:000193312LiverCirrhoticnegative regulation of protein phosphorylation117/4634342/187234.84e-055.59e-04117
GO:000717911LiverCirrhotictransforming growth factor beta receptor signaling pathway71/4634198/187233.02e-042.65e-0371
GO:190384411LiverCirrhoticregulation of cellular response to transforming growth factor beta stimulus47/4634131/187232.87e-031.65e-0247
GO:000717811LiverCirrhotictransmembrane receptor protein serine/threonine kinase signaling pathway111/4634355/187232.98e-031.70e-02111
GO:00170152LiverCirrhoticregulation of transforming growth factor beta receptor signaling pathway46/4634128/187233.04e-031.72e-0246
GO:004325422LiverHCCregulation of protein-containing complex assembly264/7958428/187235.47e-164.39e-14264
GO:001056322LiverHCCnegative regulation of phosphorus metabolic process259/7958442/187234.29e-121.92e-10259
GO:004593622LiverHCCnegative regulation of phosphate metabolic process258/7958441/187236.00e-122.60e-10258
GO:004232622LiverHCCnegative regulation of phosphorylation227/7958385/187233.98e-111.52e-09227
GO:000193322LiverHCCnegative regulation of protein phosphorylation196/7958342/187231.95e-084.63e-07196
Page: 1 2 3 4 5 6 7 8 9 10 11 12 13 

check button Enriched KEGG pathways.
Pathway IDTissueDisease StageDescriptionGene RatioBg Ratiopvaluep.adjustqvalueCount
Page: 1 

Top

Cell-cell communication analysis

check buttonIdentification of potential cell-cell interactions between two cell types and their ligand-receptor pairs for different disease states
LigandReceptorLRpairPathwayTissueDisease Stage
Page: 1 

Top

Single-cell gene regulatory network inference analysis

check buttonFind out the significant the regulons (TFs) and the target genes of each regulon across cell types for different disease states
TFCell TypeTissueDisease StageTarget GeneRSSRegulon Activity
∗The dot plots of a searched regulon are shown for all cell subpopulations in each disease state of each tissue based on the regulon specific score inferred using pySCENIC and by calculating the average expression.
Page: 1 

Top

Somatic mutation of malignant transformation related genes

check buttonAnnotation of somatic variants for genes involved in malignant transformation
Hugo SymbolVariant ClassVariant ClassificationdbSNP RSHGVScHGVSpHGVSp ShortSWISSPROTBIOTYPESIFTPolyPhenTumor Sample BarcodeTissueHistologySexAgeStageTherapy TypesDrugsOutcome
LDLRAD4SNVMissense_Mutationc.99C>Ap.Asn33Lysp.N33KO15165protein_codingdeleterious_low_confidence(0.01)possibly_damaging(0.451)TCGA-D8-A1JS-01Breastbreast invasive carcinomaFemale>=65I/IIHormone TherapytamoxiphenSD
LDLRAD4SNVMissense_Mutationc.643N>Ap.Asp215Asnp.D215NO15165protein_codingdeleterious(0)probably_damaging(0.998)TCGA-C5-A1BQ-01Cervixcervical & endocervical cancerFemale>=65III/IVChemotherapycisplatinCR
LDLRAD4SNVMissense_Mutationnovelc.161N>Tp.Pro54Leup.P54LO15165protein_codingdeleterious(0.03)probably_damaging(0.998)TCGA-5M-AAT6-01Colorectumcolon adenocarcinomaFemale<65III/IVUnknownUnknownPD
LDLRAD4SNVMissense_Mutationc.791N>Ap.Gly264Aspp.G264DO15165protein_codingdeleterious_low_confidence(0)probably_damaging(0.965)TCGA-AA-3672-01Colorectumcolon adenocarcinomaFemale>=65III/IVUnknownUnknownSD
LDLRAD4SNVMissense_Mutationc.665C>Tp.Ala222Valp.A222VO15165protein_codingtolerated_low_confidence(0.06)benign(0.021)TCGA-D5-6930-01Colorectumcolon adenocarcinomaMale>=65I/IIUnknownUnknownSD
LDLRAD4SNVMissense_Mutationc.493N>Ap.Glu165Lysp.E165KO15165protein_codingtolerated(0.05)benign(0.306)TCGA-EI-6917-01Colorectumrectum adenocarcinomaMale<65III/IVChemotherapy5fluorouracil+oxaciplatina+l-folinianSD
LDLRAD4SNVMissense_Mutationnovelc.833G>Ap.Gly278Aspp.G278DO15165protein_codingdeleterious_low_confidence(0)probably_damaging(1)TCGA-A5-A2K5-01Endometriumuterine corpus endometrioid carcinomaFemale>=65I/IIUnknownUnknownSD
LDLRAD4SNVMissense_Mutationnovelc.329N>Cp.Leu110Prop.L110PO15165protein_codingdeleterious(0.04)benign(0.037)TCGA-AJ-A8CT-01Endometriumuterine corpus endometrioid carcinomaFemale<65I/IIUnknownUnknownSD
LDLRAD4SNVMissense_Mutationc.619N>Ap.Ala207Thrp.A207TO15165protein_codingdeleterious(0)probably_damaging(0.998)TCGA-AP-A051-01Endometriumuterine corpus endometrioid carcinomaFemale>=65I/IIUnknownUnknownSD
LDLRAD4SNVMissense_Mutationnovelc.280C>Tp.Arg94Trpp.R94WO15165protein_codingtolerated(0.16)benign(0.006)TCGA-AP-A1DK-01Endometriumuterine corpus endometrioid carcinomaFemale<65I/IIUnknownUnknownSD
Page: 1 2 3 4 5 

Top

Related drugs of malignant transformation related genes

check buttonIdentification of chemicals and drugs interact with genes involved in malignant transfromation
(DGIdb 4.0)
Entrez IDSymbolCategoryInteraction TypesDrug Claim NameDrug NamePMIDs
Page: 1