
|
|||||
|
 | |
| |
| |
| |
| |
| |
|
Gene: LBH |
Gene summary for LBH |
| Gene information | Species | Human | Gene symbol | LBH | Gene ID | 81606 |
| Gene name | LBH regulator of WNT signaling pathway | |
| Gene Alias | LBH | |
| Cytomap | 2p23.1 | |
| Gene Type | protein-coding | GO ID | GO:0000165 | UniProtAcc | Q53QV2 |
Top |
Malignant transformation analysis |
| Identification of the aberrant gene expression in precancerous and cancerous lesions by comparing the gene expression of stem-like cells in diseased tissues with normal stem cells |
| Entrez ID | Symbol | Replicates | Species | Organ | Tissue | Adj P-value | Log2FC | Malignancy |
| 81606 | LBH | LZE4T | Human | Esophagus | ESCC | 8.09e-20 | 1.03e+00 | 0.0811 |
| 81606 | LBH | LZE7T | Human | Esophagus | ESCC | 7.76e-14 | 8.89e-01 | 0.0667 |
| 81606 | LBH | LZE8T | Human | Esophagus | ESCC | 2.08e-10 | 6.19e-01 | 0.067 |
| 81606 | LBH | LZE20T | Human | Esophagus | ESCC | 6.84e-08 | 3.48e-01 | 0.0662 |
| 81606 | LBH | LZE21D1 | Human | Esophagus | HGIN | 1.64e-03 | 6.98e-01 | 0.0632 |
| 81606 | LBH | LZE22D1 | Human | Esophagus | HGIN | 1.39e-03 | 6.10e-01 | 0.0595 |
| 81606 | LBH | LZE22T | Human | Esophagus | ESCC | 6.34e-07 | 8.32e-01 | 0.068 |
| 81606 | LBH | LZE24T | Human | Esophagus | ESCC | 9.08e-31 | 1.34e+00 | 0.0596 |
| 81606 | LBH | LZE21T | Human | Esophagus | ESCC | 1.32e-09 | 1.10e+00 | 0.0655 |
| 81606 | LBH | LZE6T | Human | Esophagus | ESCC | 1.70e-12 | 6.28e-01 | 0.0845 |
| 81606 | LBH | P1T-E | Human | Esophagus | ESCC | 1.71e-14 | 8.88e-01 | 0.0875 |
| 81606 | LBH | P2T-E | Human | Esophagus | ESCC | 4.39e-74 | 1.25e+00 | 0.1177 |
| 81606 | LBH | P4T-E | Human | Esophagus | ESCC | 3.09e-23 | 6.89e-01 | 0.1323 |
| 81606 | LBH | P5T-E | Human | Esophagus | ESCC | 7.99e-14 | 4.29e-01 | 0.1327 |
| 81606 | LBH | P8T-E | Human | Esophagus | ESCC | 2.00e-62 | 1.25e+00 | 0.0889 |
| 81606 | LBH | P9T-E | Human | Esophagus | ESCC | 2.96e-29 | 8.87e-01 | 0.1131 |
| 81606 | LBH | P10T-E | Human | Esophagus | ESCC | 1.27e-70 | 1.51e+00 | 0.116 |
| 81606 | LBH | P11T-E | Human | Esophagus | ESCC | 2.35e-21 | 1.21e+00 | 0.1426 |
| 81606 | LBH | P12T-E | Human | Esophagus | ESCC | 3.72e-80 | 1.61e+00 | 0.1122 |
| 81606 | LBH | P15T-E | Human | Esophagus | ESCC | 4.93e-39 | 1.17e+00 | 0.1149 |
| Page: 1 2 3 4 5 |
| Tissue | Expression Dynamics | Abbreviation |
| Esophagus | 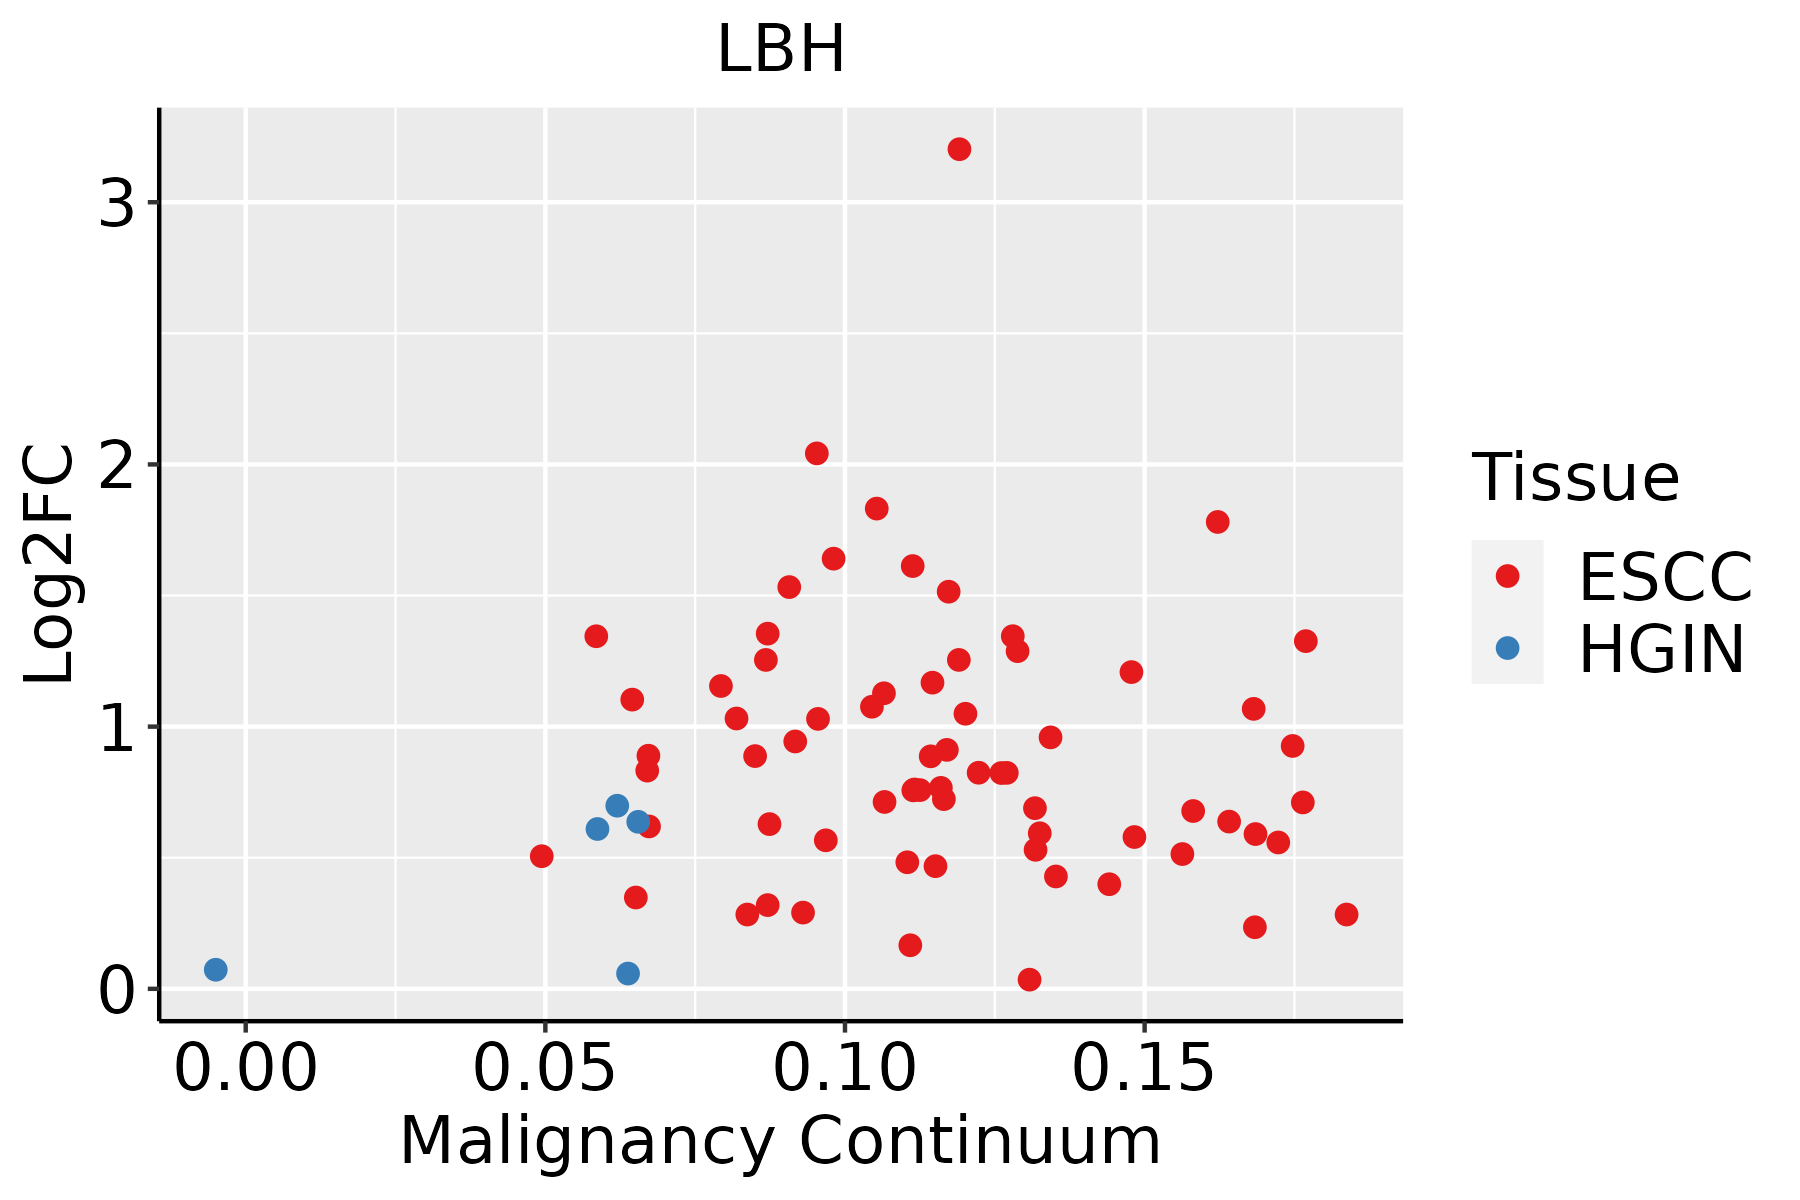 | ESCC: Esophageal squamous cell carcinoma |
| HGIN: High-grade intraepithelial neoplasias | ||
| LGIN: Low-grade intraepithelial neoplasias | ||
| Oral Cavity | 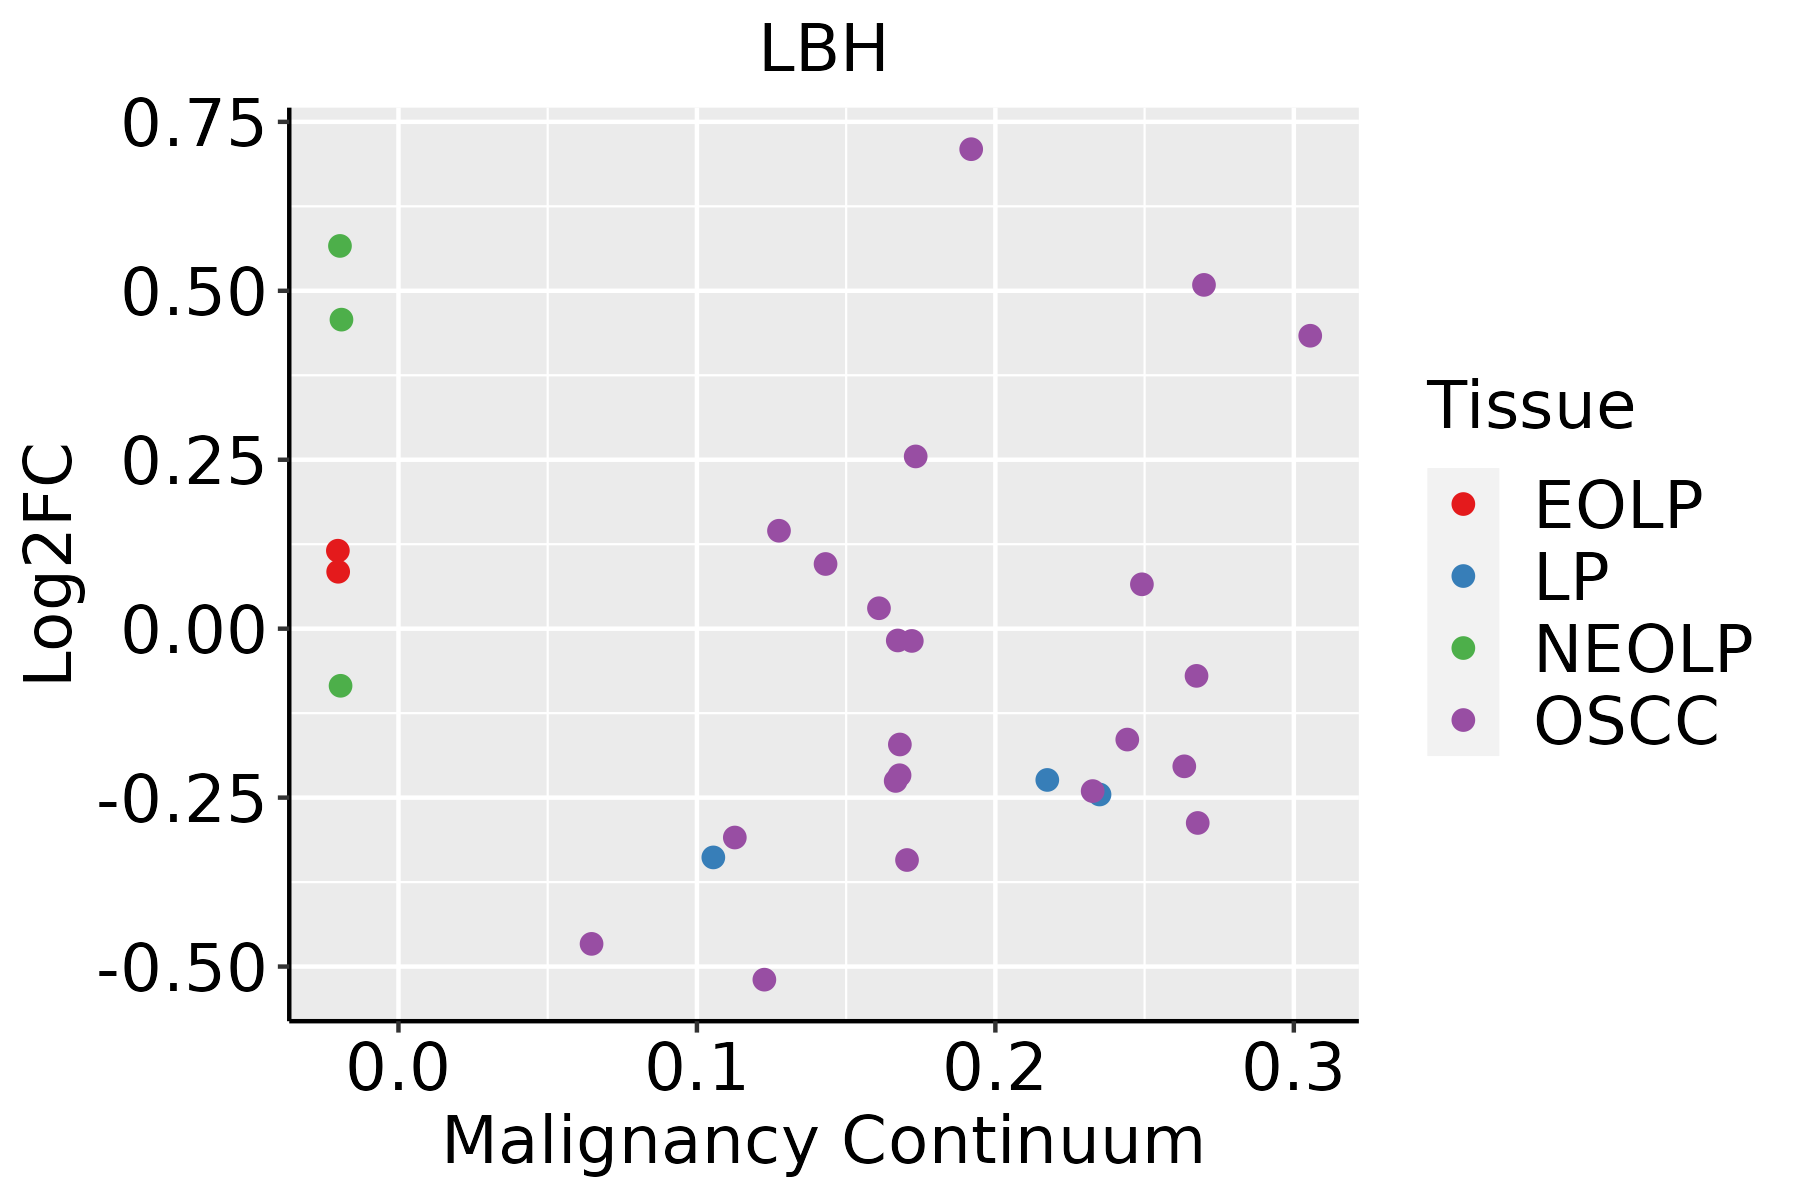 | EOLP: Erosive Oral lichen planus |
| LP: leukoplakia | ||
| NEOLP: Non-erosive oral lichen planus | ||
| OSCC: Oral squamous cell carcinoma | ||
| Skin | 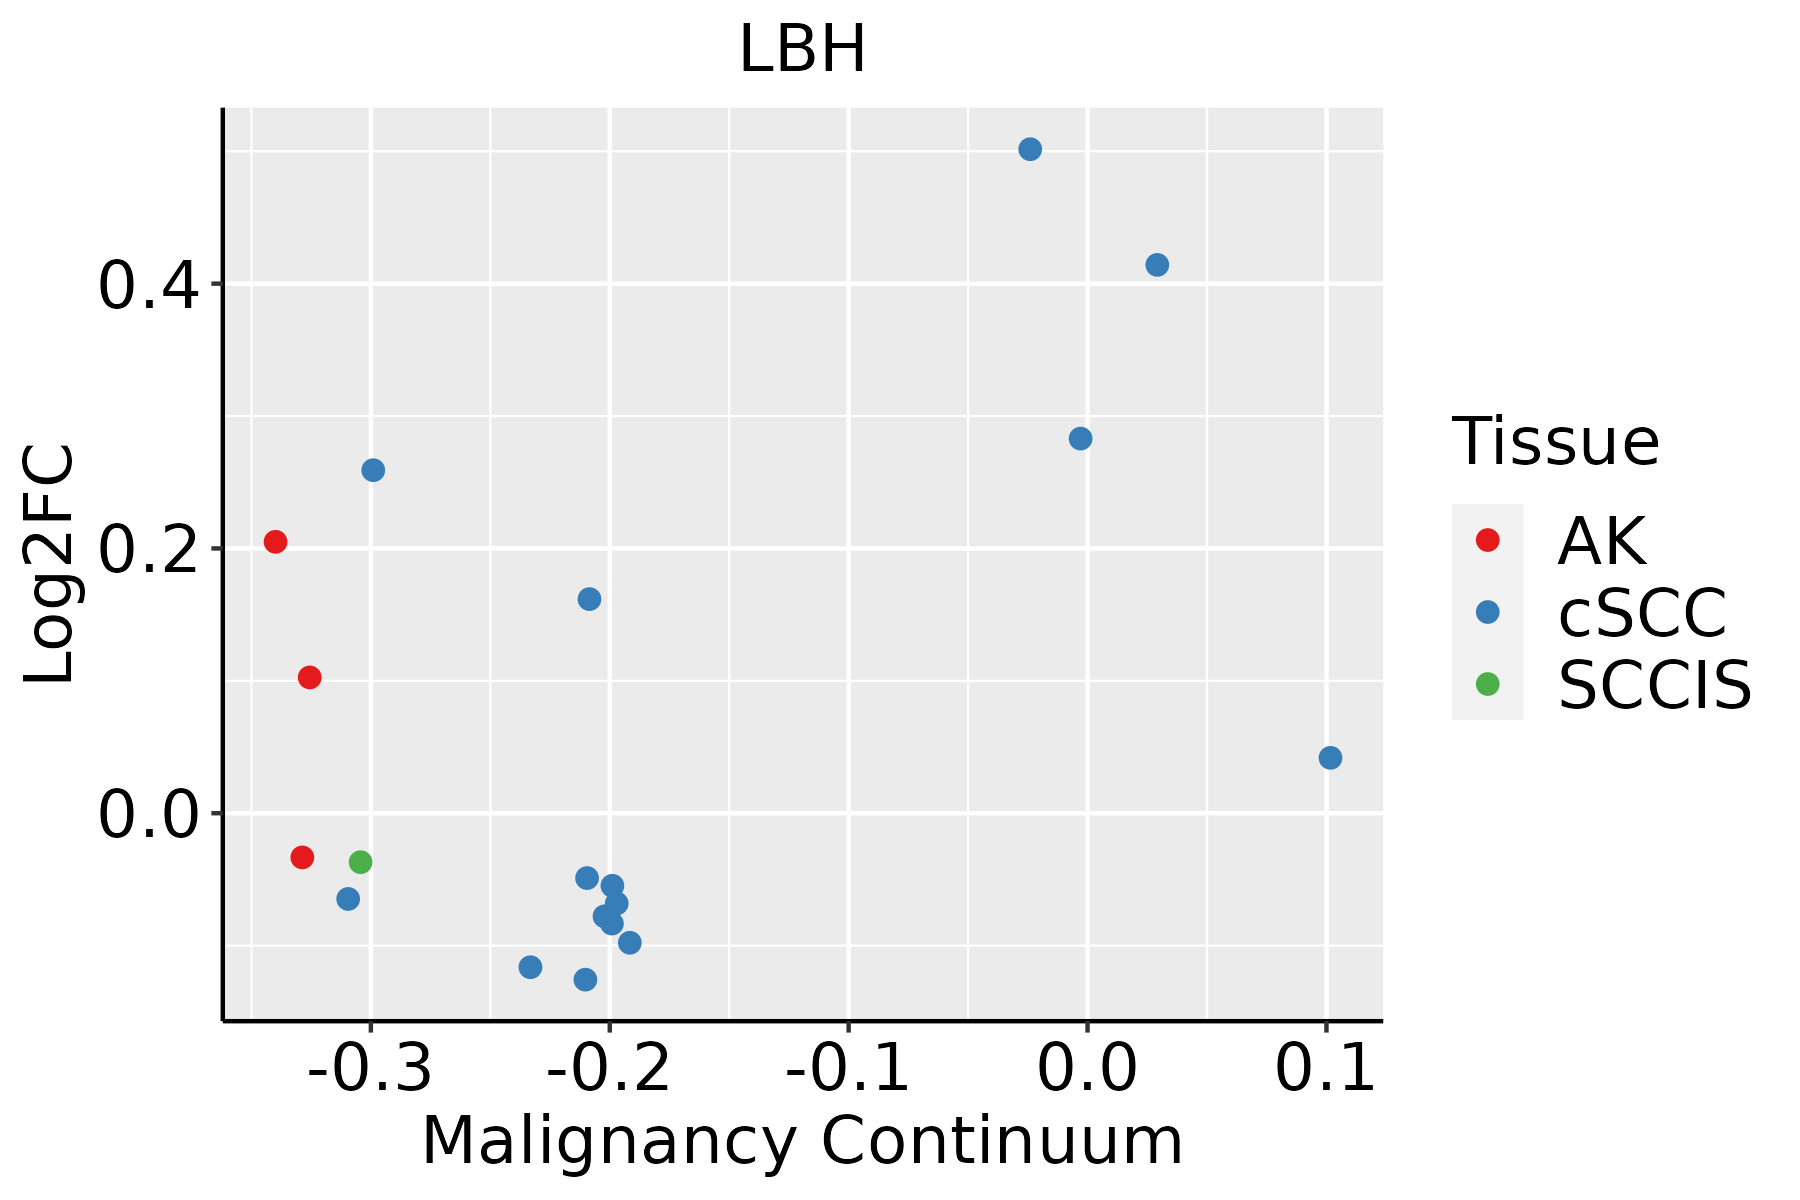 | AK: Actinic keratosis |
| cSCC: Cutaneous squamous cell carcinoma | ||
| SCCIS:squamous cell carcinoma in situ | ||
| Thyroid | 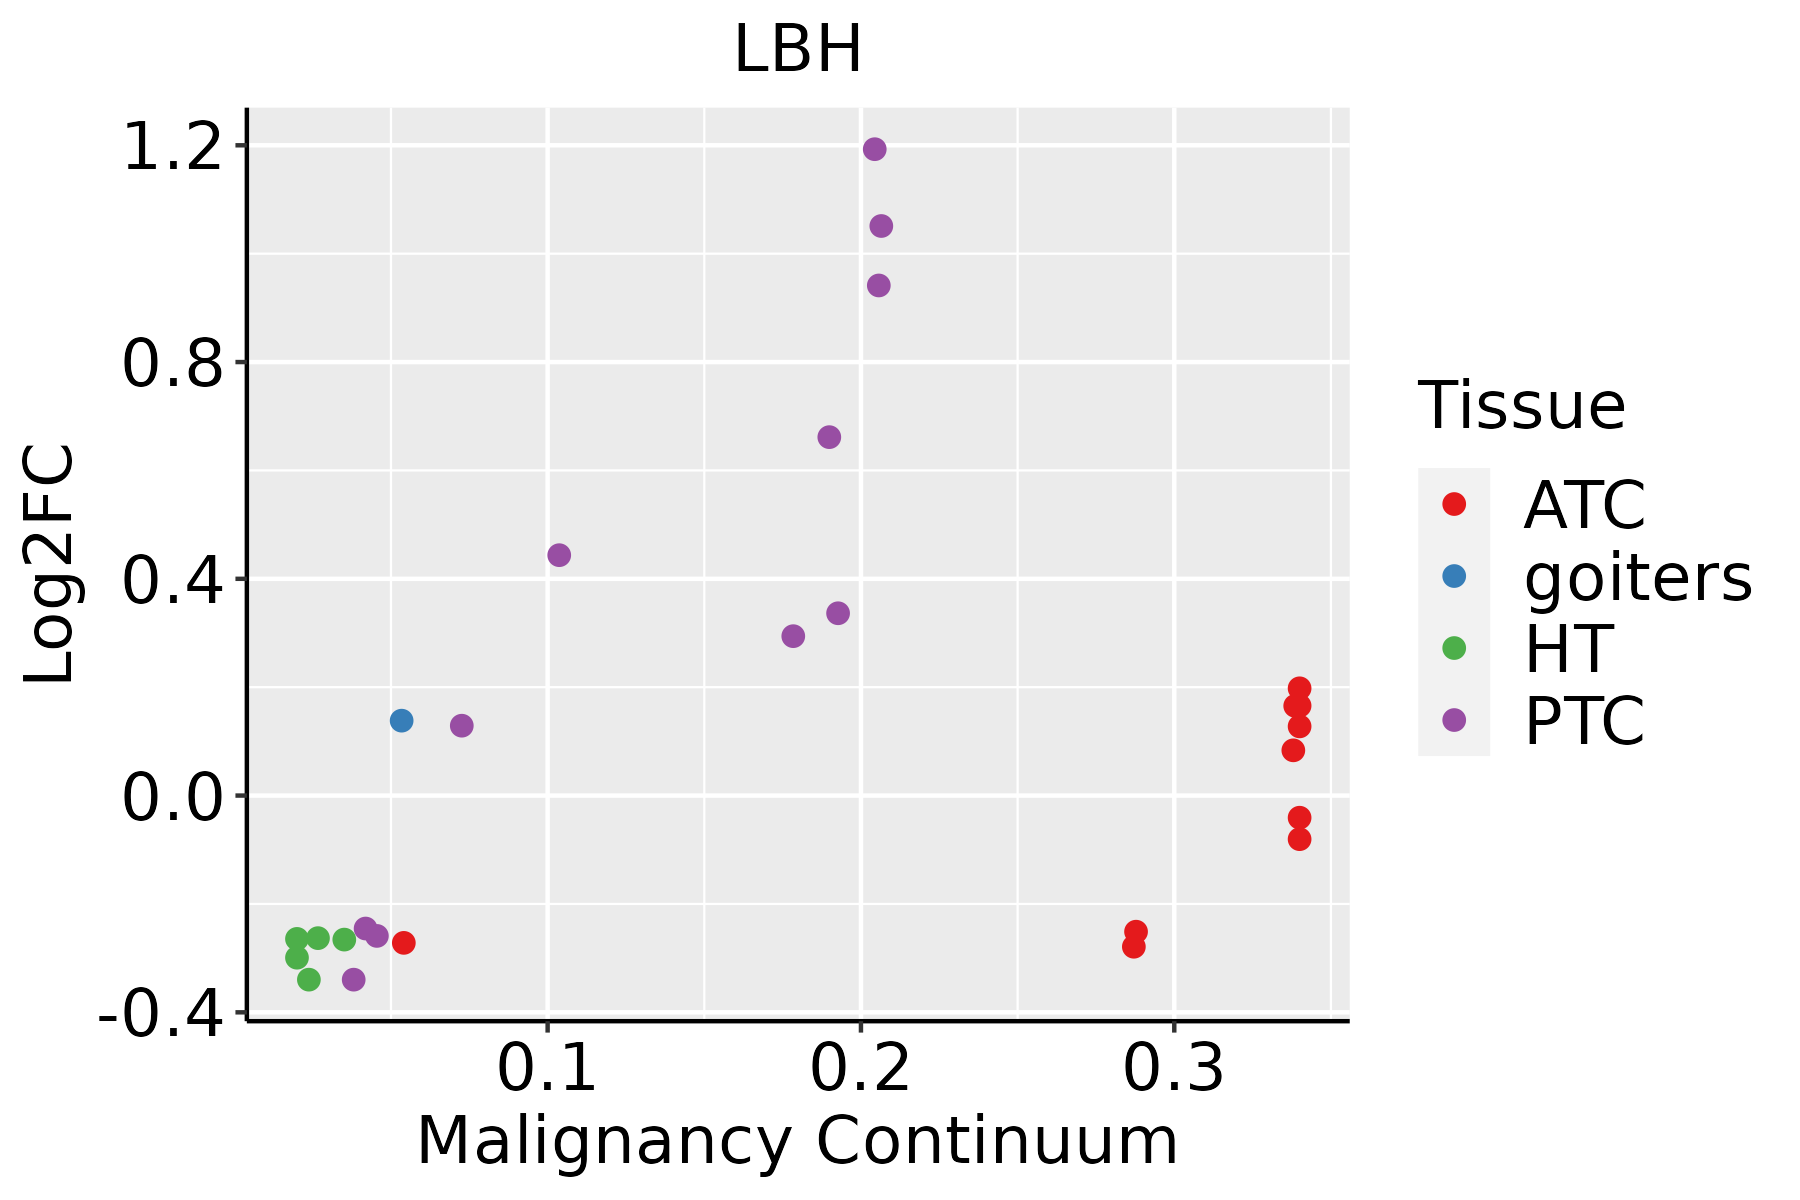 | ATC: Anaplastic thyroid cancer |
| HT: Hashimoto's thyroiditis | ||
| PTC: Papillary thyroid cancer |
| ∗log2FC in expression of this searched gene in stem-like cells from each diseased tissue sample relative to stem-like cells in normal samples in each tissue plotted against the malignancy continuum. Samples are colored based on if they are from different disease stage. |
Top |
Malignant transformation related pathway analysis |
| Find out the enriched GO biological processes and KEGG pathways involved in transition from healthy to precancer to cancer |
| Tissue | Disease Stage | Enriched GO biological Processes |
| Colorectum | AD |  |
| Colorectum | SER |  |
| Colorectum | MSS |  |
| Colorectum | MSI-H |  |
| Colorectum | FAP |  |
| ∗Top 15 enriched GO BP terms are showed in the bar plot of each disease state in each tissue. Each row represents a significant GO biological process which is colored according to the -log10(p.adjust). |
| Page: 1 2 3 4 5 6 7 8 9 |
| GO ID | Tissue | Disease Stage | Description | Gene Ratio | Bg Ratio | pvalue | p.adjust | Count |
| GO:003314611 | Thyroid | ATC | regulation of intracellular estrogen receptor signaling pathway | 19/6293 | 35/18723 | 9.36e-03 | 3.44e-02 | 19 |
| GO:0051781 | Thyroid | ATC | positive regulation of cell division | 41/6293 | 89/18723 | 9.71e-03 | 3.56e-02 | 41 |
| GO:20000363 | Thyroid | ATC | regulation of stem cell population maintenance | 18/6293 | 33/18723 | 1.06e-02 | 3.84e-02 | 18 |
| GO:00611809 | Thyroid | ATC | mammary gland epithelium development | 32/6293 | 67/18723 | 1.13e-02 | 4.04e-02 | 32 |
| Page: 1 2 3 4 5 6 7 |
| Pathway ID | Tissue | Disease Stage | Description | Gene Ratio | Bg Ratio | pvalue | p.adjust | qvalue | Count |
| Page: 1 |
Top |
Cell-cell communication analysis |
| Identification of potential cell-cell interactions between two cell types and their ligand-receptor pairs for different disease states |
| Ligand | Receptor | LRpair | Pathway | Tissue | Disease Stage |
| Page: 1 |
Top |
Single-cell gene regulatory network inference analysis |
| Find out the significant the regulons (TFs) and the target genes of each regulon across cell types for different disease states |
| TF | Cell Type | Tissue | Disease Stage | Target Gene | RSS | Regulon Activity |
| ∗The dot plots of a searched regulon are shown for all cell subpopulations in each disease state of each tissue based on the regulon specific score inferred using pySCENIC and by calculating the average expression. |
| Page: 1 |
Top |
Somatic mutation of malignant transformation related genes |
| Annotation of somatic variants for genes involved in malignant transformation |
| Hugo Symbol | Variant Class | Variant Classification | dbSNP RS | HGVSc | HGVSp | HGVSp Short | SWISSPROT | BIOTYPE | SIFT | PolyPhen | Tumor Sample Barcode | Tissue | Histology | Sex | Age | Stage | Therapy Types | Drugs | Outcome |
| LBH | SNV | Missense_Mutation | rs201301340 | c.179G>A | p.Arg60His | p.R60H | Q53QV2 | protein_coding | deleterious(0) | probably_damaging(0.996) | TCGA-AA-3947-01 | Colorectum | colon adenocarcinoma | Female | <65 | I/II | Unknown | Unknown | SD |
| LBH | SNV | Missense_Mutation | c.184C>T | p.Pro62Ser | p.P62S | Q53QV2 | protein_coding | deleterious(0) | probably_damaging(0.998) | TCGA-AM-5821-01 | Colorectum | colon adenocarcinoma | Female | >=65 | I/II | Unknown | Unknown | SD | |
| LBH | SNV | Missense_Mutation | rs754393032 | c.286N>A | p.Glu96Lys | p.E96K | Q53QV2 | protein_coding | tolerated_low_confidence(0.13) | benign(0.006) | TCGA-CA-6717-01 | Colorectum | colon adenocarcinoma | Male | <65 | I/II | Chemotherapy | oxaliplatin | CR |
| LBH | SNV | Missense_Mutation | rs750086364 | c.157N>T | p.Arg53Cys | p.R53C | Q53QV2 | protein_coding | tolerated(0.07) | benign(0.015) | TCGA-D5-6536-01 | Colorectum | colon adenocarcinoma | Male | >=65 | I/II | Chemotherapy | 5-fu | SD |
| LBH | SNV | Missense_Mutation | c.214N>A | p.Glu72Lys | p.E72K | Q53QV2 | protein_coding | deleterious(0.01) | benign(0.443) | TCGA-B5-A11E-01 | Endometrium | uterine corpus endometrioid carcinoma | Female | <65 | I/II | Unknown | Unknown | SD | |
| LBH | SNV | Missense_Mutation | c.187N>C | p.Ser63Pro | p.S63P | Q53QV2 | protein_coding | deleterious(0) | probably_damaging(0.994) | TCGA-D1-A177-01 | Endometrium | uterine corpus endometrioid carcinoma | Female | >=65 | I/II | Unknown | Unknown | PD | |
| LBH | SNV | Missense_Mutation | novel | c.139G>T | p.Asp47Tyr | p.D47Y | Q53QV2 | protein_coding | deleterious(0) | probably_damaging(0.98) | TCGA-73-4658-01 | Lung | lung adenocarcinoma | Female | >=65 | I/II | Unknown | Unknown | SD |
| LBH | SNV | Missense_Mutation | novel | c.222G>T | p.Glu74Asp | p.E74D | Q53QV2 | protein_coding | deleterious(0) | probably_damaging(0.987) | TCGA-NK-A5CT-01 | Lung | lung squamous cell carcinoma | Male | >=65 | I/II | Unknown | Unknown | PD |
| LBH | SNV | Missense_Mutation | novel | c.218N>A | p.Val73Glu | p.V73E | Q53QV2 | protein_coding | deleterious(0) | probably_damaging(0.996) | TCGA-CV-A45Z-01 | Oral cavity | head & neck squamous cell carcinoma | Male | >=65 | I/II | Unknown | Unknown | PD |
| LBH | SNV | Missense_Mutation | novel | c.220N>A | p.Glu74Lys | p.E74K | Q53QV2 | protein_coding | deleterious(0) | probably_damaging(0.991) | TCGA-CV-A45Z-01 | Oral cavity | head & neck squamous cell carcinoma | Male | >=65 | I/II | Unknown | Unknown | PD |
| Page: 1 2 |
Top |
Related drugs of malignant transformation related genes |
| Identification of chemicals and drugs interact with genes involved in malignant transfromation |
| (DGIdb 4.0) |
| Entrez ID | Symbol | Category | Interaction Types | Drug Claim Name | Drug Name | PMIDs |
| Page: 1 |

Copyright 2023-Present -The University of Texas Health Science Center at Houston |