| Tissue | Expression Dynamics | Abbreviation |
| Cervix | 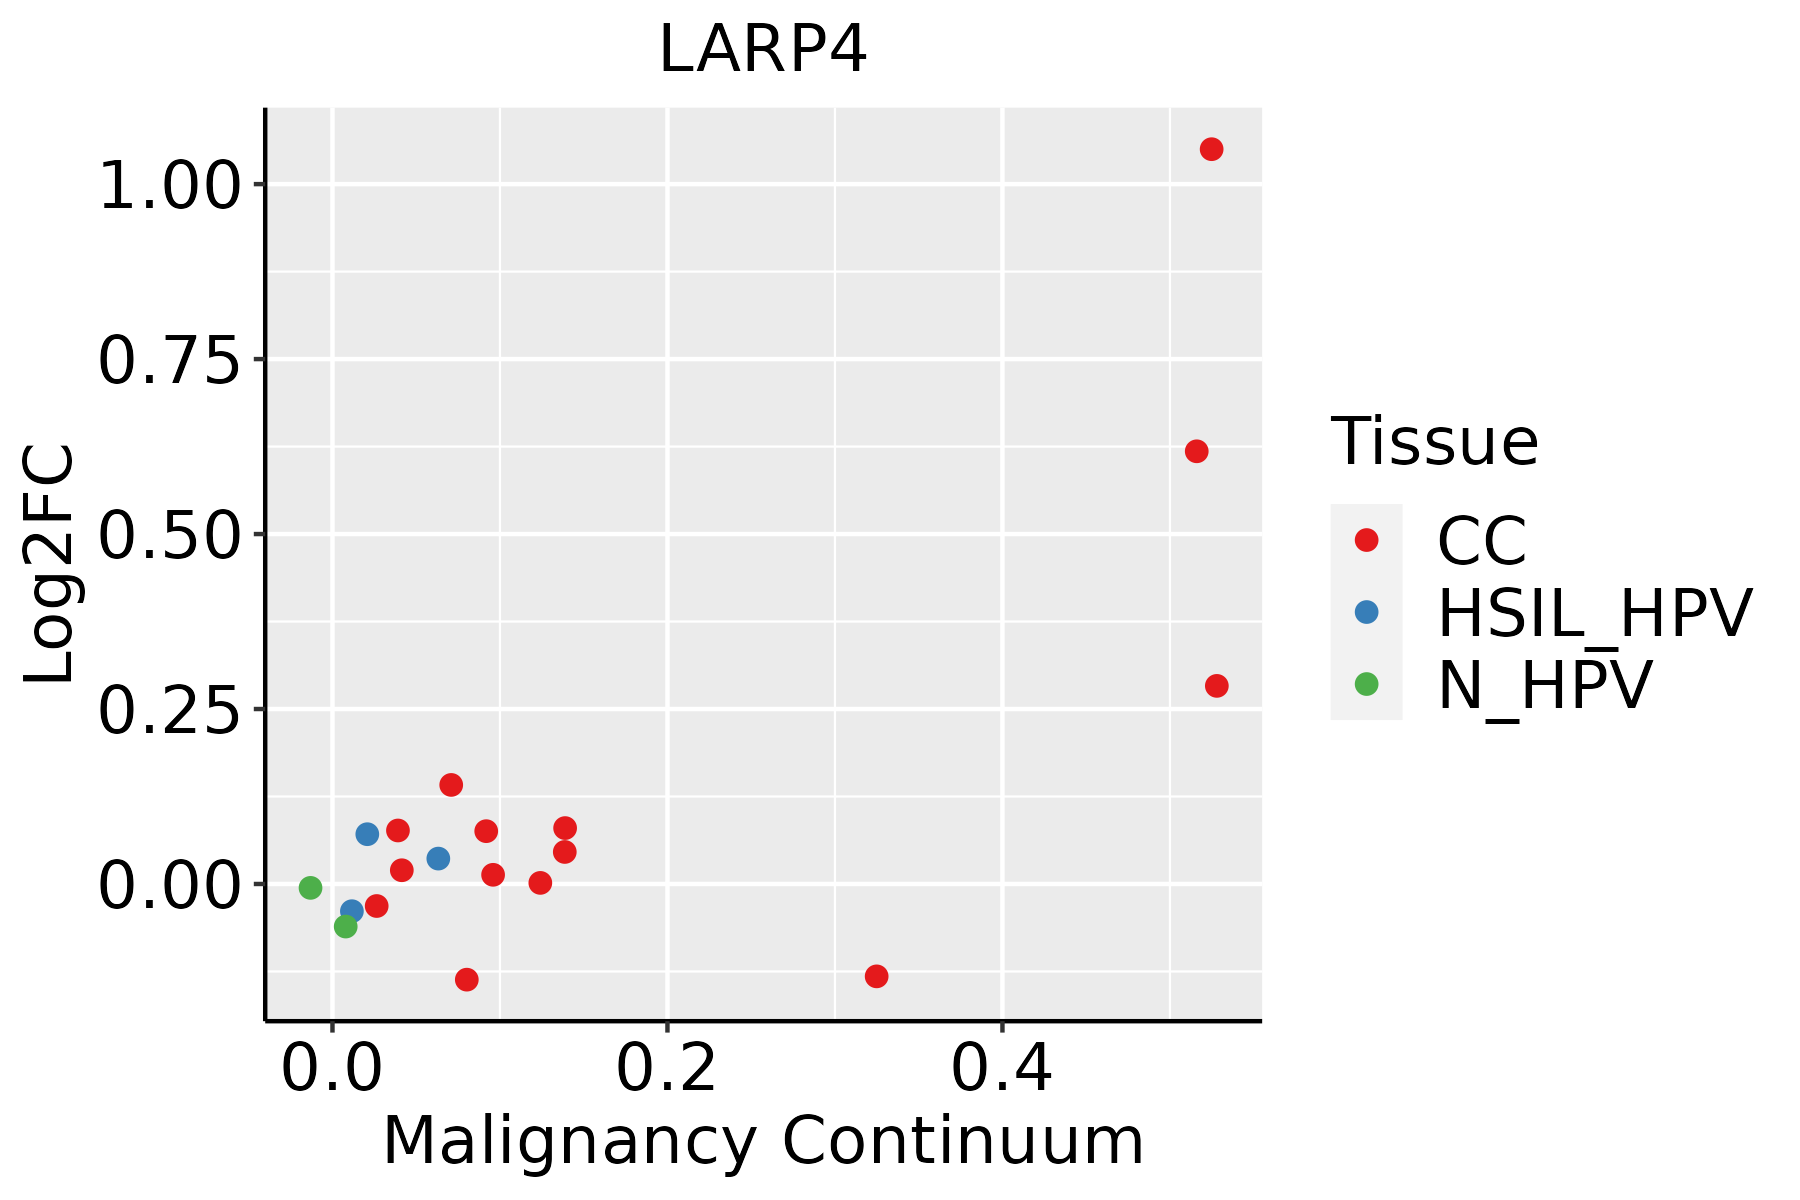 | CC: Cervix cancer |
| HSIL_HPV: HPV-infected high-grade squamous intraepithelial lesions |
| N_HPV: HPV-infected normal cervix |
| Esophagus | 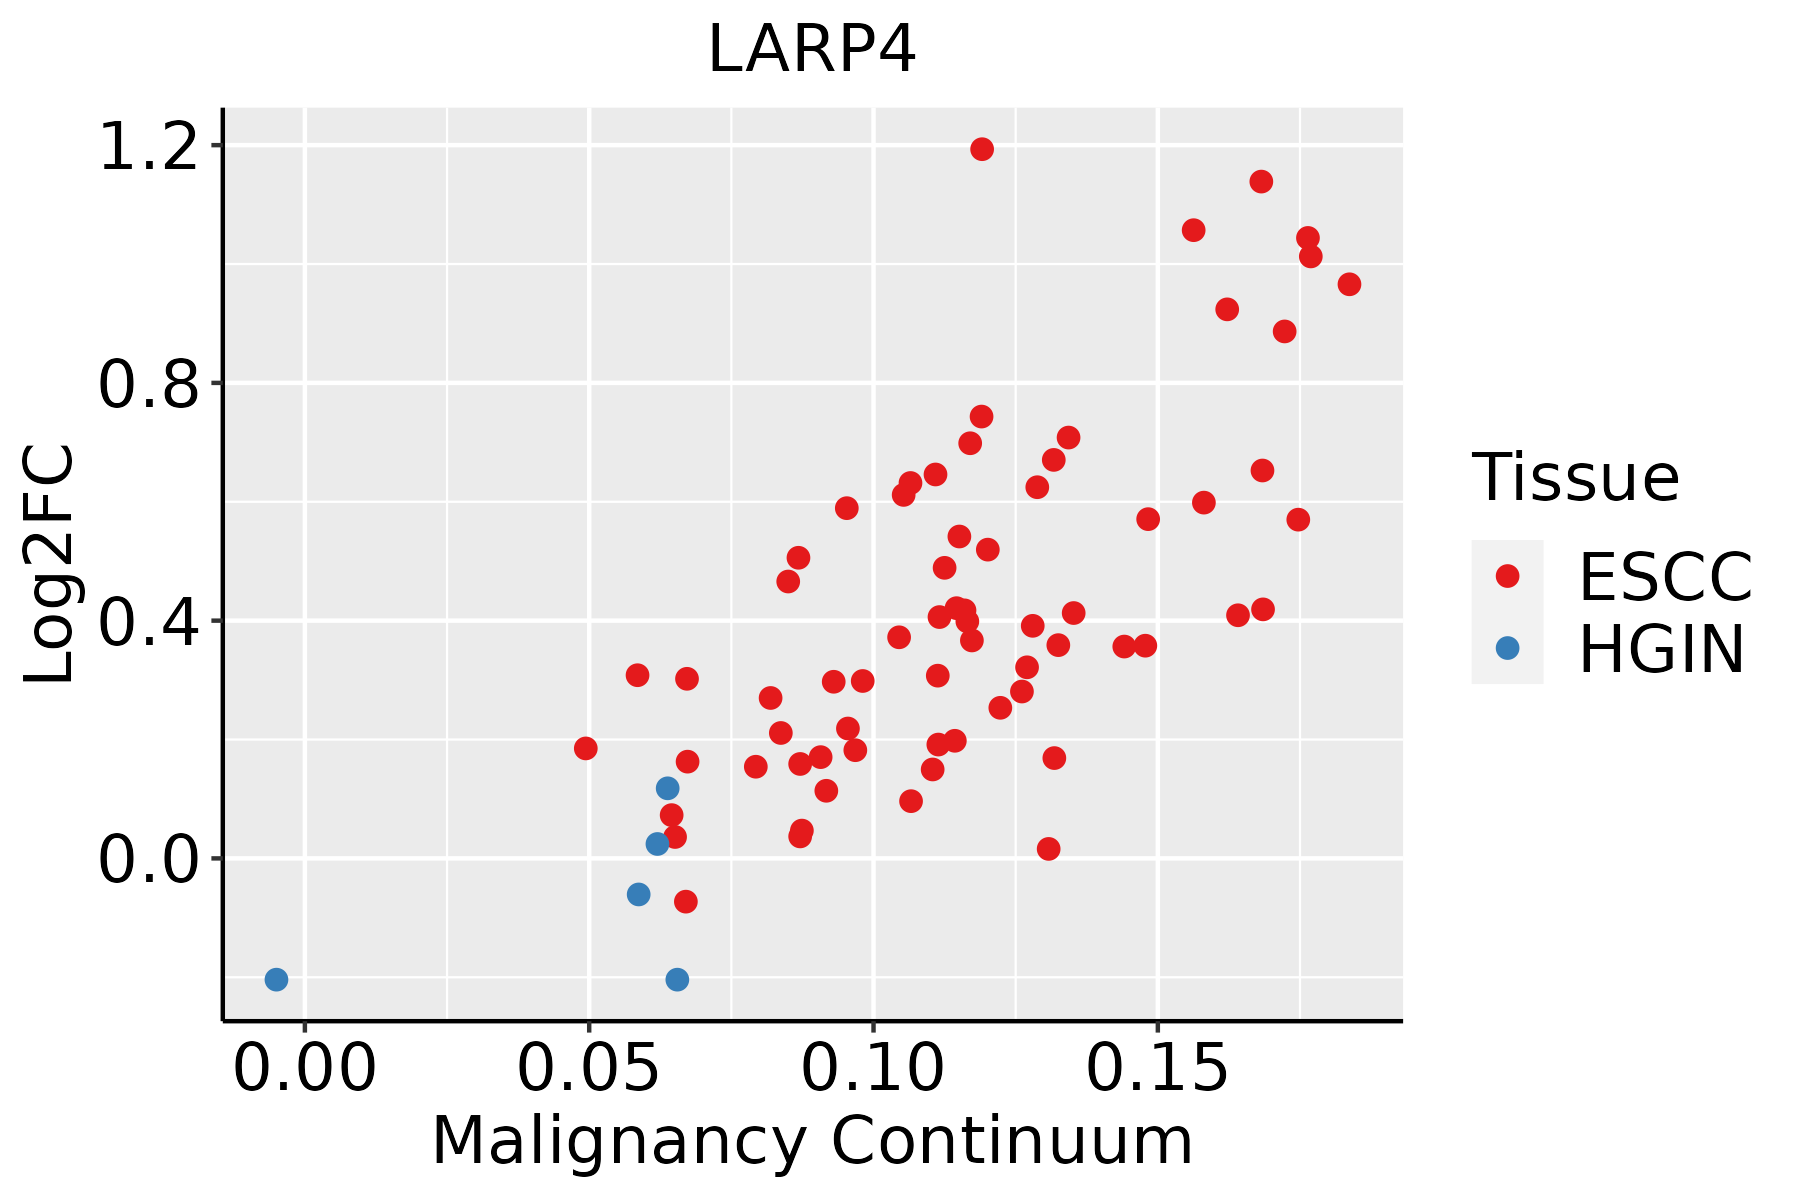 | ESCC: Esophageal squamous cell carcinoma |
| HGIN: High-grade intraepithelial neoplasias |
| LGIN: Low-grade intraepithelial neoplasias |
| Liver | 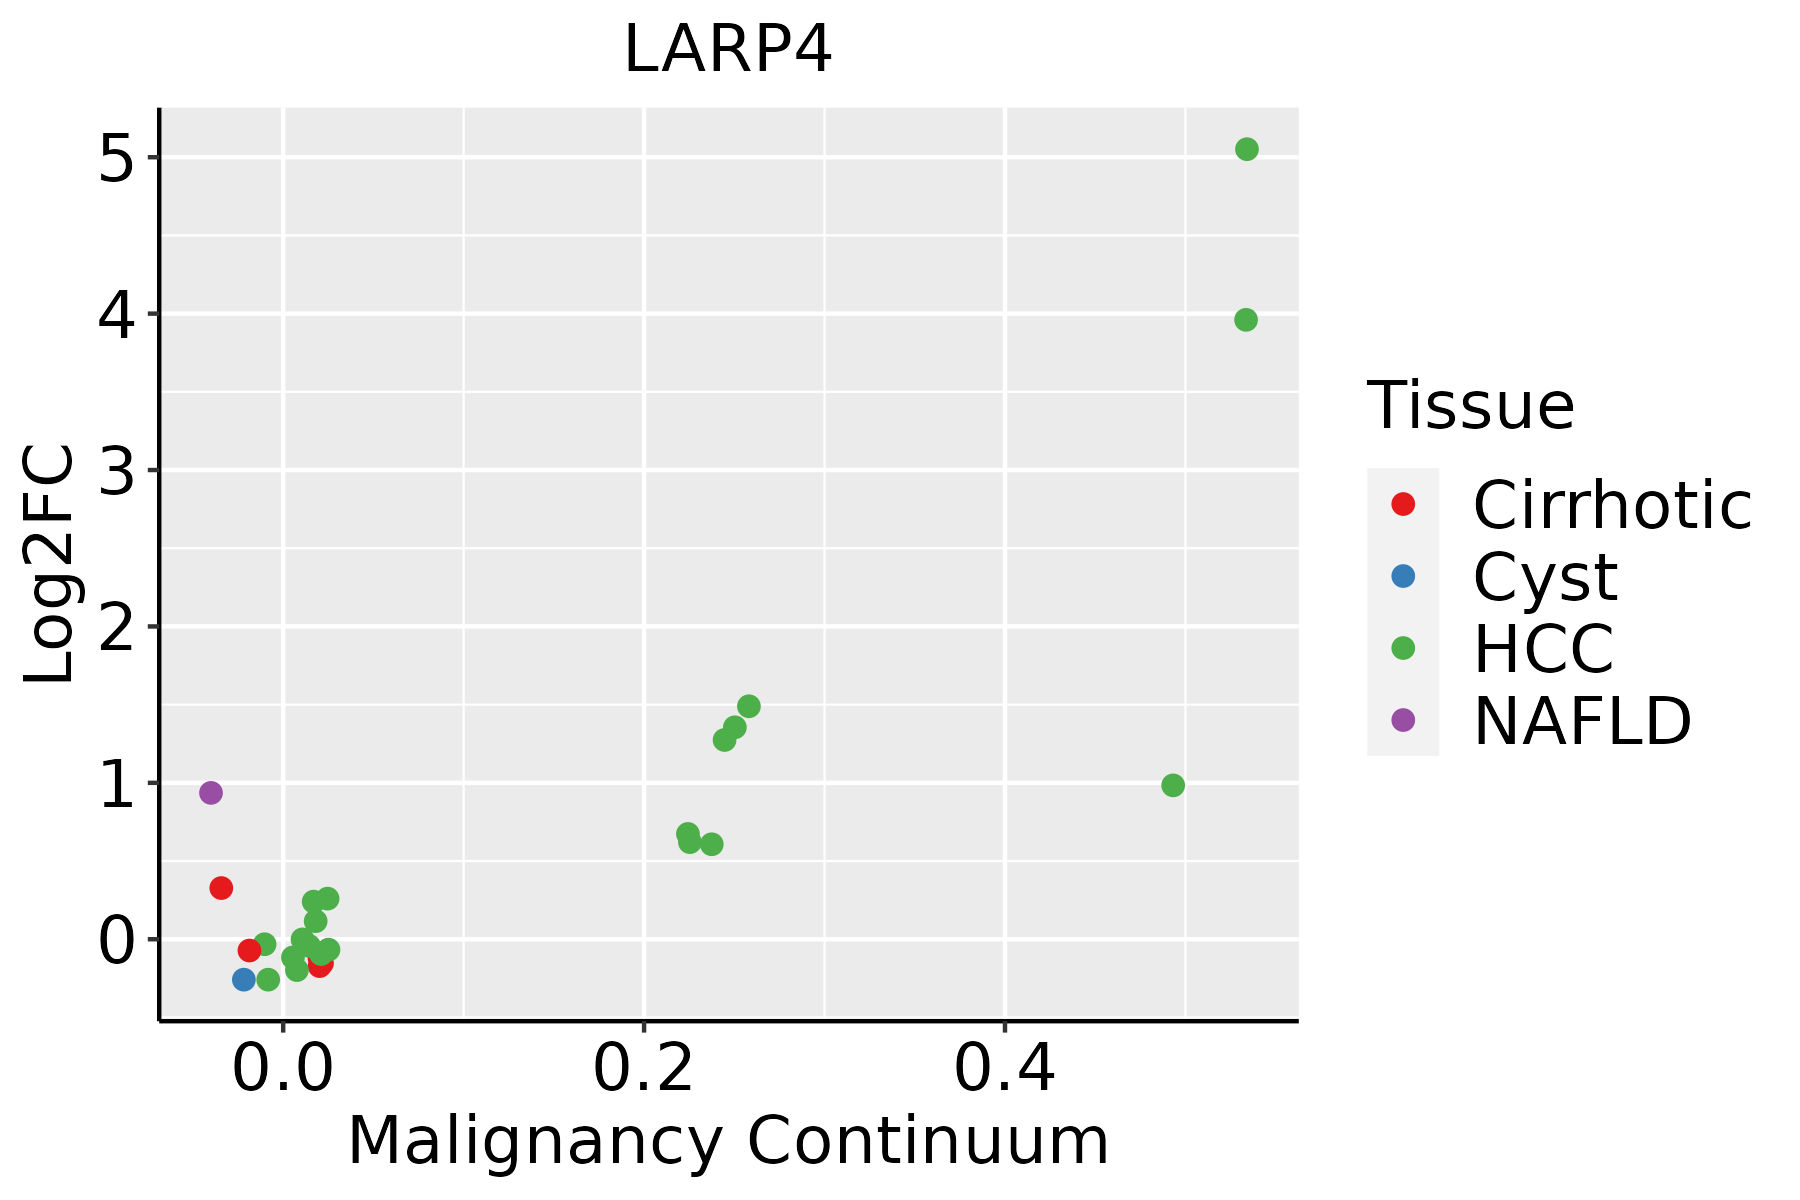 | HCC: Hepatocellular carcinoma |
| NAFLD: Non-alcoholic fatty liver disease |
| Thyroid | 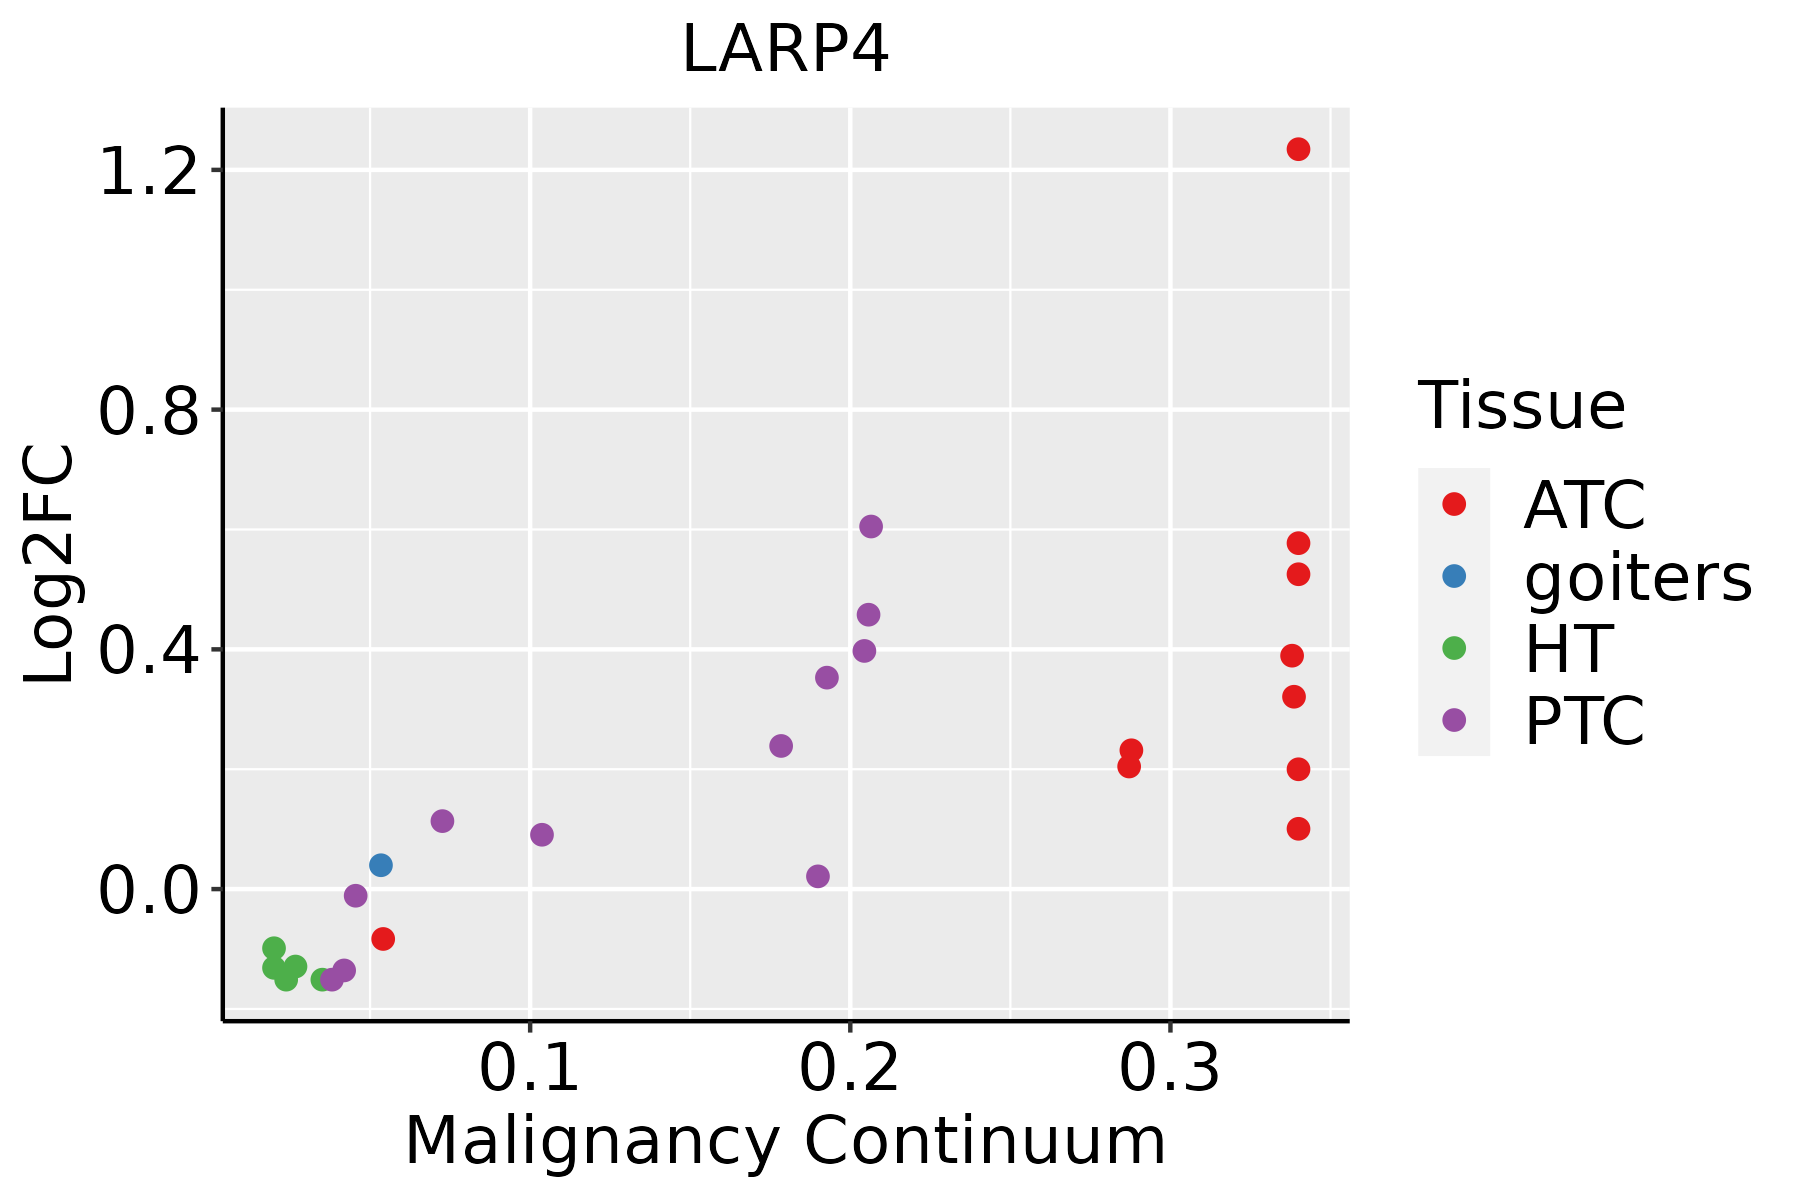 | ATC: Anaplastic thyroid cancer |
| HT: Hashimoto's thyroiditis |
| PTC: Papillary thyroid cancer |
| GO ID | Tissue | Disease Stage | Description | Gene Ratio | Bg Ratio | pvalue | p.adjust | Count |
| GO:19023699 | Endometrium | AEH | negative regulation of RNA catabolic process | 16/2100 | 75/18723 | 8.13e-03 | 4.49e-02 | 16 |
| GO:190331115 | Endometrium | EEC | regulation of mRNA metabolic process | 79/2168 | 288/18723 | 1.01e-13 | 2.64e-11 | 79 |
| GO:000640215 | Endometrium | EEC | mRNA catabolic process | 60/2168 | 232/18723 | 1.17e-09 | 9.92e-08 | 60 |
| GO:000640115 | Endometrium | EEC | RNA catabolic process | 65/2168 | 278/18723 | 1.90e-08 | 1.16e-06 | 65 |
| GO:000641717 | Endometrium | EEC | regulation of translation | 94/2168 | 468/18723 | 5.37e-08 | 2.88e-06 | 94 |
| GO:004572716 | Endometrium | EEC | positive regulation of translation | 38/2168 | 136/18723 | 1.47e-07 | 6.89e-06 | 38 |
| GO:003425016 | Endometrium | EEC | positive regulation of cellular amide metabolic process | 42/2168 | 162/18723 | 3.24e-07 | 1.32e-05 | 42 |
| GO:006101313 | Endometrium | EEC | regulation of mRNA catabolic process | 40/2168 | 166/18723 | 4.47e-06 | 1.14e-04 | 40 |
| GO:003133017 | Endometrium | EEC | negative regulation of cellular catabolic process | 55/2168 | 262/18723 | 7.93e-06 | 1.80e-04 | 55 |
| GO:004348813 | Endometrium | EEC | regulation of mRNA stability | 38/2168 | 158/18723 | 8.03e-06 | 1.81e-04 | 38 |
| GO:004427013 | Endometrium | EEC | cellular nitrogen compound catabolic process | 83/2168 | 451/18723 | 1.17e-05 | 2.43e-04 | 83 |
| GO:004670013 | Endometrium | EEC | heterocycle catabolic process | 82/2168 | 445/18723 | 1.26e-05 | 2.55e-04 | 82 |
| GO:003465514 | Endometrium | EEC | nucleobase-containing compound catabolic process | 76/2168 | 407/18723 | 1.61e-05 | 3.12e-04 | 76 |
| GO:004348713 | Endometrium | EEC | regulation of RNA stability | 39/2168 | 170/18723 | 1.99e-05 | 3.60e-04 | 39 |
| GO:190331217 | Endometrium | EEC | negative regulation of mRNA metabolic process | 25/2168 | 92/18723 | 3.19e-05 | 5.51e-04 | 25 |
| GO:001943913 | Endometrium | EEC | aromatic compound catabolic process | 83/2168 | 467/18723 | 4.32e-05 | 7.10e-04 | 83 |
| GO:000989516 | Endometrium | EEC | negative regulation of catabolic process | 61/2168 | 320/18723 | 5.76e-05 | 8.97e-04 | 61 |
| GO:190136113 | Endometrium | EEC | organic cyclic compound catabolic process | 86/2168 | 495/18723 | 7.31e-05 | 1.07e-03 | 86 |
| GO:1903311110 | Esophagus | ESCC | regulation of mRNA metabolic process | 210/8552 | 288/18723 | 3.25e-21 | 5.56e-19 | 210 |
| GO:0006401110 | Esophagus | ESCC | RNA catabolic process | 204/8552 | 278/18723 | 3.39e-21 | 5.66e-19 | 204 |
| Hugo Symbol | Variant Class | Variant Classification | dbSNP RS | HGVSc | HGVSp | HGVSp Short | SWISSPROT | BIOTYPE | SIFT | PolyPhen | Tumor Sample Barcode | Tissue | Histology | Sex | Age | Stage | Therapy Types | Drugs | Outcome |
| LARP4 | SNV | Missense_Mutation | | c.236N>G | p.Ser79Cys | p.S79C | Q71RC2 | protein_coding | deleterious(0.01) | probably_damaging(0.976) | TCGA-AC-A23H-01 | Breast | breast invasive carcinoma | Female | >=65 | I/II | Unknown | Unknown | PD |
| LARP4 | SNV | Missense_Mutation | novel | c.1235N>T | p.Arg412Ile | p.R412I | Q71RC2 | protein_coding | tolerated(0.09) | possibly_damaging(0.533) | TCGA-AN-A046-01 | Breast | breast invasive carcinoma | Female | >=65 | I/II | Unknown | Unknown | SD |
| LARP4 | SNV | Missense_Mutation | novel | c.1484N>T | p.Gly495Val | p.G495V | Q71RC2 | protein_coding | deleterious(0) | probably_damaging(1) | TCGA-AN-A046-01 | Breast | breast invasive carcinoma | Female | >=65 | I/II | Unknown | Unknown | SD |
| LARP4 | SNV | Missense_Mutation | novel | c.1427N>T | p.Ser476Leu | p.S476L | Q71RC2 | protein_coding | tolerated(0.1) | benign(0.007) | TCGA-BH-A2L8-01 | Breast | breast invasive carcinoma | Female | <65 | I/II | Chemotherapy | cytoxan | CR |
| LARP4 | deletion | Frame_Shift_Del | novel | c.954_966delNNNNNNNNNNNNN | p.Pro319ThrfsTer32 | p.P319Tfs*32 | Q71RC2 | protein_coding | | | TCGA-PL-A8LZ-01 | Breast | breast invasive carcinoma | Female | <65 | III/IV | Chemotherapy | paclitaxel | SD |
| LARP4 | SNV | Missense_Mutation | novel | c.1652N>A | p.Ser551Asn | p.S551N | Q71RC2 | protein_coding | tolerated(0.11) | benign(0.101) | TCGA-2W-A8YY-01 | Cervix | cervical & endocervical cancer | Female | <65 | I/II | Chemotherapy | cisplatin | CR |
| LARP4 | SNV | Missense_Mutation | novel | c.149N>T | p.Ser50Leu | p.S50L | Q71RC2 | protein_coding | tolerated(0.22) | benign(0.006) | TCGA-C5-A8YR-01 | Cervix | cervical & endocervical cancer | Female | <65 | I/II | Unknown | Unknown | PD |
| LARP4 | SNV | Missense_Mutation | | c.1463C>T | p.Ser488Leu | p.S488L | Q71RC2 | protein_coding | deleterious(0) | possibly_damaging(0.544) | TCGA-EK-A2H0-01 | Cervix | cervical & endocervical cancer | Female | <65 | I/II | Chemotherapy | cisplatin | CR |
| LARP4 | SNV | Missense_Mutation | | c.1918C>A | p.Leu640Ile | p.L640I | Q71RC2 | protein_coding | tolerated(0.15) | benign(0.091) | TCGA-FU-A3HZ-01 | Cervix | cervical & endocervical cancer | Female | <65 | I/II | Chemotherapy | cisplatin | CR |
| LARP4 | SNV | Missense_Mutation | novel | c.1657N>T | p.Pro553Ser | p.P553S | Q71RC2 | protein_coding | tolerated(0.2) | benign(0.006) | TCGA-HM-A4S6-01 | Cervix | cervical & endocervical cancer | Female | <65 | III/IV | Chemotherapy | cisplatin | CR |


