
|
|||||
|
 | |
| |
| |
| |
| |
| |
|
Gene: LAMC1 |
Gene summary for LAMC1 |
| Gene information | Species | Human | Gene symbol | LAMC1 | Gene ID | 3915 |
| Gene name | laminin subunit gamma 1 | |
| Gene Alias | LAMB2 | |
| Cytomap | 1q25.3 | |
| Gene Type | protein-coding | GO ID | GO:0000902 | UniProtAcc | P11047 |
Top |
Malignant transformation analysis |
| Identification of the aberrant gene expression in precancerous and cancerous lesions by comparing the gene expression of stem-like cells in diseased tissues with normal stem cells |
| Entrez ID | Symbol | Replicates | Species | Organ | Tissue | Adj P-value | Log2FC | Malignancy |
| 3915 | LAMC1 | CA_HPV_1 | Human | Cervix | CC | 2.01e-02 | -1.20e-01 | 0.0264 |
| 3915 | LAMC1 | CCI_3 | Human | Cervix | CC | 2.94e-03 | 5.39e-01 | 0.516 |
| 3915 | LAMC1 | AEH-subject1 | Human | Endometrium | AEH | 2.00e-08 | 3.30e-01 | -0.3059 |
| 3915 | LAMC1 | AEH-subject2 | Human | Endometrium | AEH | 5.39e-08 | 2.35e-01 | -0.2525 |
| 3915 | LAMC1 | AEH-subject3 | Human | Endometrium | AEH | 5.95e-08 | 2.17e-01 | -0.2576 |
| 3915 | LAMC1 | AEH-subject4 | Human | Endometrium | AEH | 2.41e-06 | 3.27e-01 | -0.2657 |
| 3915 | LAMC1 | AEH-subject5 | Human | Endometrium | AEH | 4.39e-02 | 1.06e-01 | -0.2953 |
| 3915 | LAMC1 | EEC-subject1 | Human | Endometrium | EEC | 3.98e-14 | 4.22e-01 | -0.2682 |
| 3915 | LAMC1 | EEC-subject3 | Human | Endometrium | EEC | 2.90e-34 | 5.92e-01 | -0.2525 |
| 3915 | LAMC1 | EEC-subject4 | Human | Endometrium | EEC | 4.69e-04 | 5.38e-02 | -0.2571 |
| 3915 | LAMC1 | GSM6177620_NYU_UCEC1_lib1_lib1 | Human | Endometrium | EEC | 5.64e-16 | 5.14e-02 | -0.1869 |
| 3915 | LAMC1 | GSM6177620_NYU_UCEC1_lib2_lib2 | Human | Endometrium | EEC | 1.73e-14 | -7.58e-02 | -0.1875 |
| 3915 | LAMC1 | GSM6177620_NYU_UCEC1_lib3_lib3 | Human | Endometrium | EEC | 1.26e-20 | 1.03e-01 | -0.1883 |
| 3915 | LAMC1 | GSM6177621_NYU_UCEC2_lib1_lib1 | Human | Endometrium | EEC | 3.43e-24 | 4.44e-01 | -0.1934 |
| 3915 | LAMC1 | GSM6177622_NYU_UCEC3_lib1_lib1 | Human | Endometrium | EEC | 1.25e-23 | 2.67e-02 | -0.1917 |
| 3915 | LAMC1 | GSM6177622_NYU_UCEC3_lib2_lib2 | Human | Endometrium | EEC | 2.68e-20 | 7.53e-02 | -0.1916 |
| 3915 | LAMC1 | GSM6177623_NYU_UCEC3_Vis | Human | Endometrium | EEC | 1.46e-05 | 2.62e-01 | -0.1269 |
| 3915 | LAMC1 | LZE2T | Human | Esophagus | ESCC | 1.04e-06 | 7.65e-01 | 0.082 |
| 3915 | LAMC1 | LZE4T | Human | Esophagus | ESCC | 7.55e-05 | 9.69e-02 | 0.0811 |
| 3915 | LAMC1 | LZE7T | Human | Esophagus | ESCC | 2.40e-04 | 5.98e-01 | 0.0667 |
| Page: 1 2 3 4 5 6 7 |
| Tissue | Expression Dynamics | Abbreviation |
| Cervix | 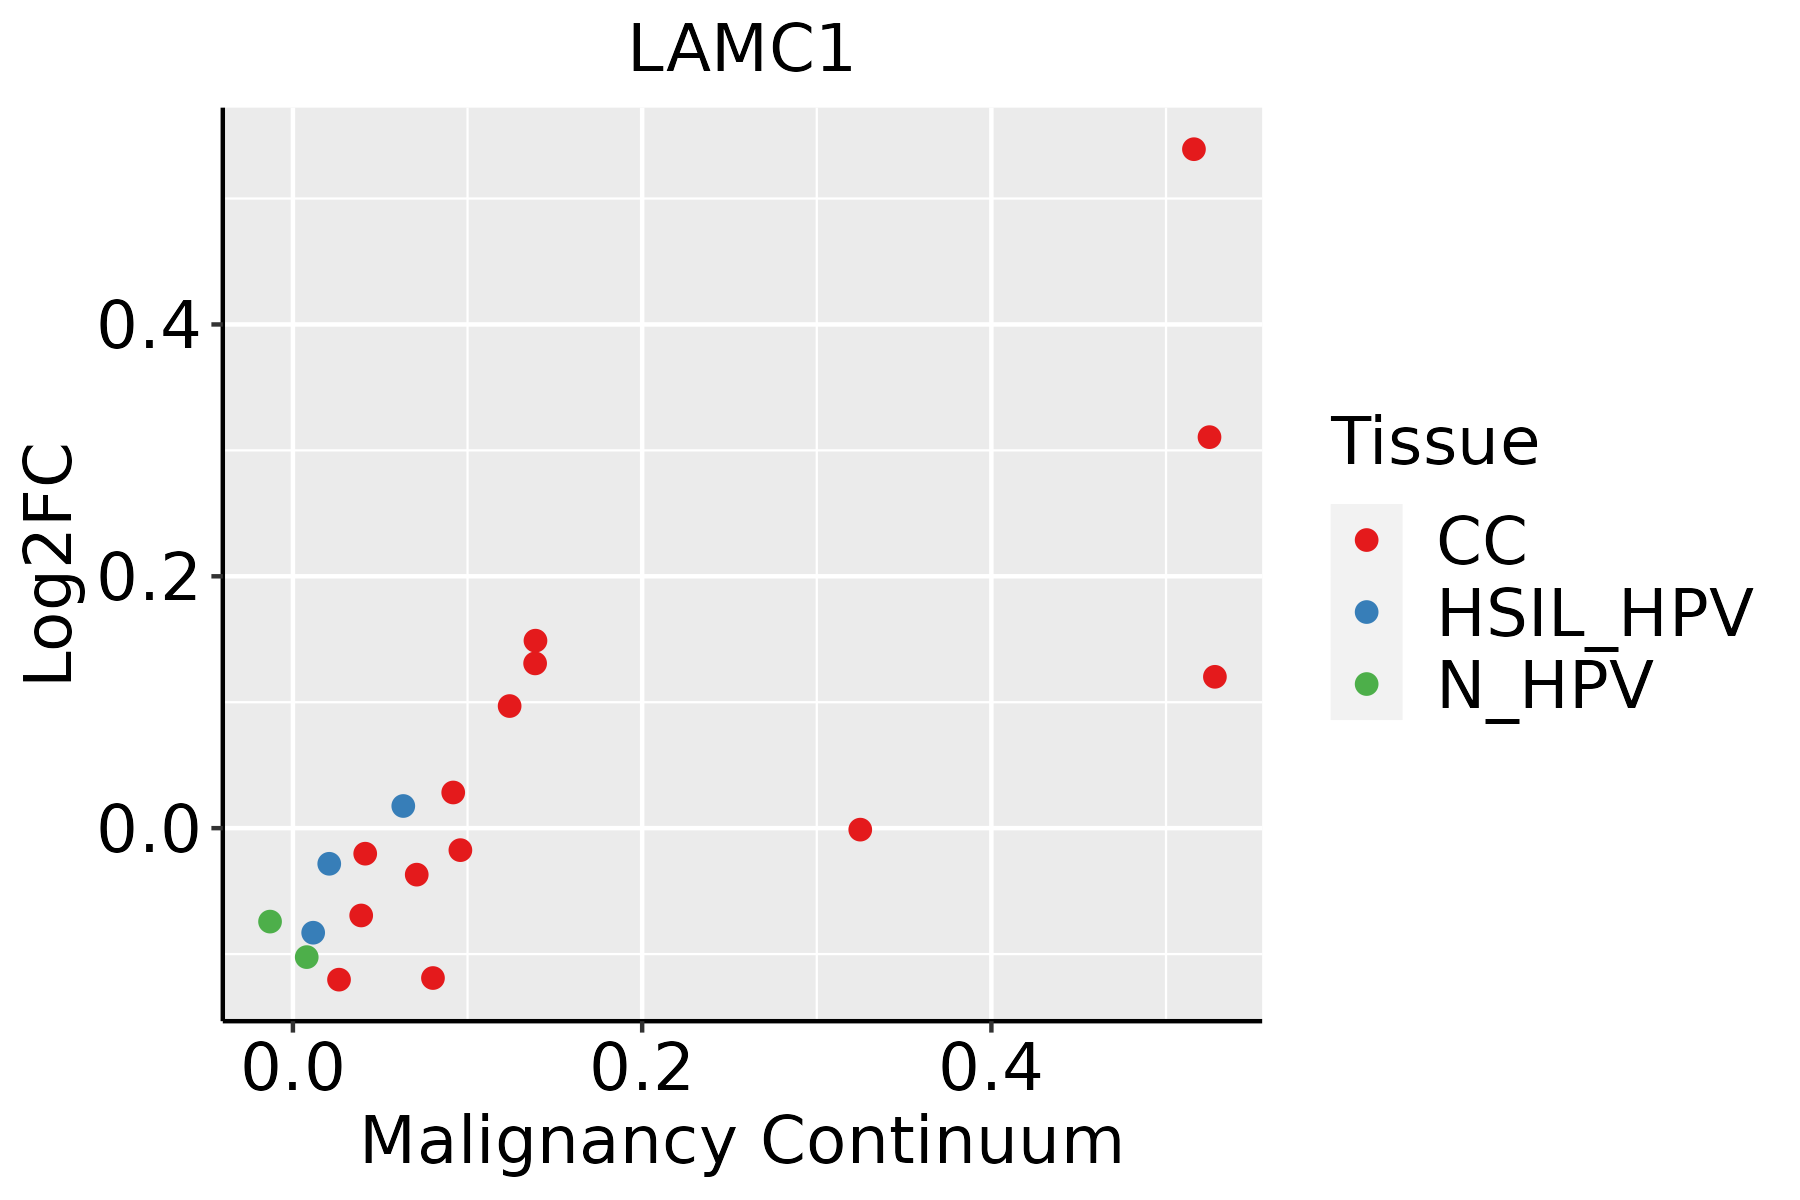 | CC: Cervix cancer |
| HSIL_HPV: HPV-infected high-grade squamous intraepithelial lesions | ||
| N_HPV: HPV-infected normal cervix | ||
| Endometrium |  | AEH: Atypical endometrial hyperplasia |
| EEC: Endometrioid Cancer | ||
| Esophagus | 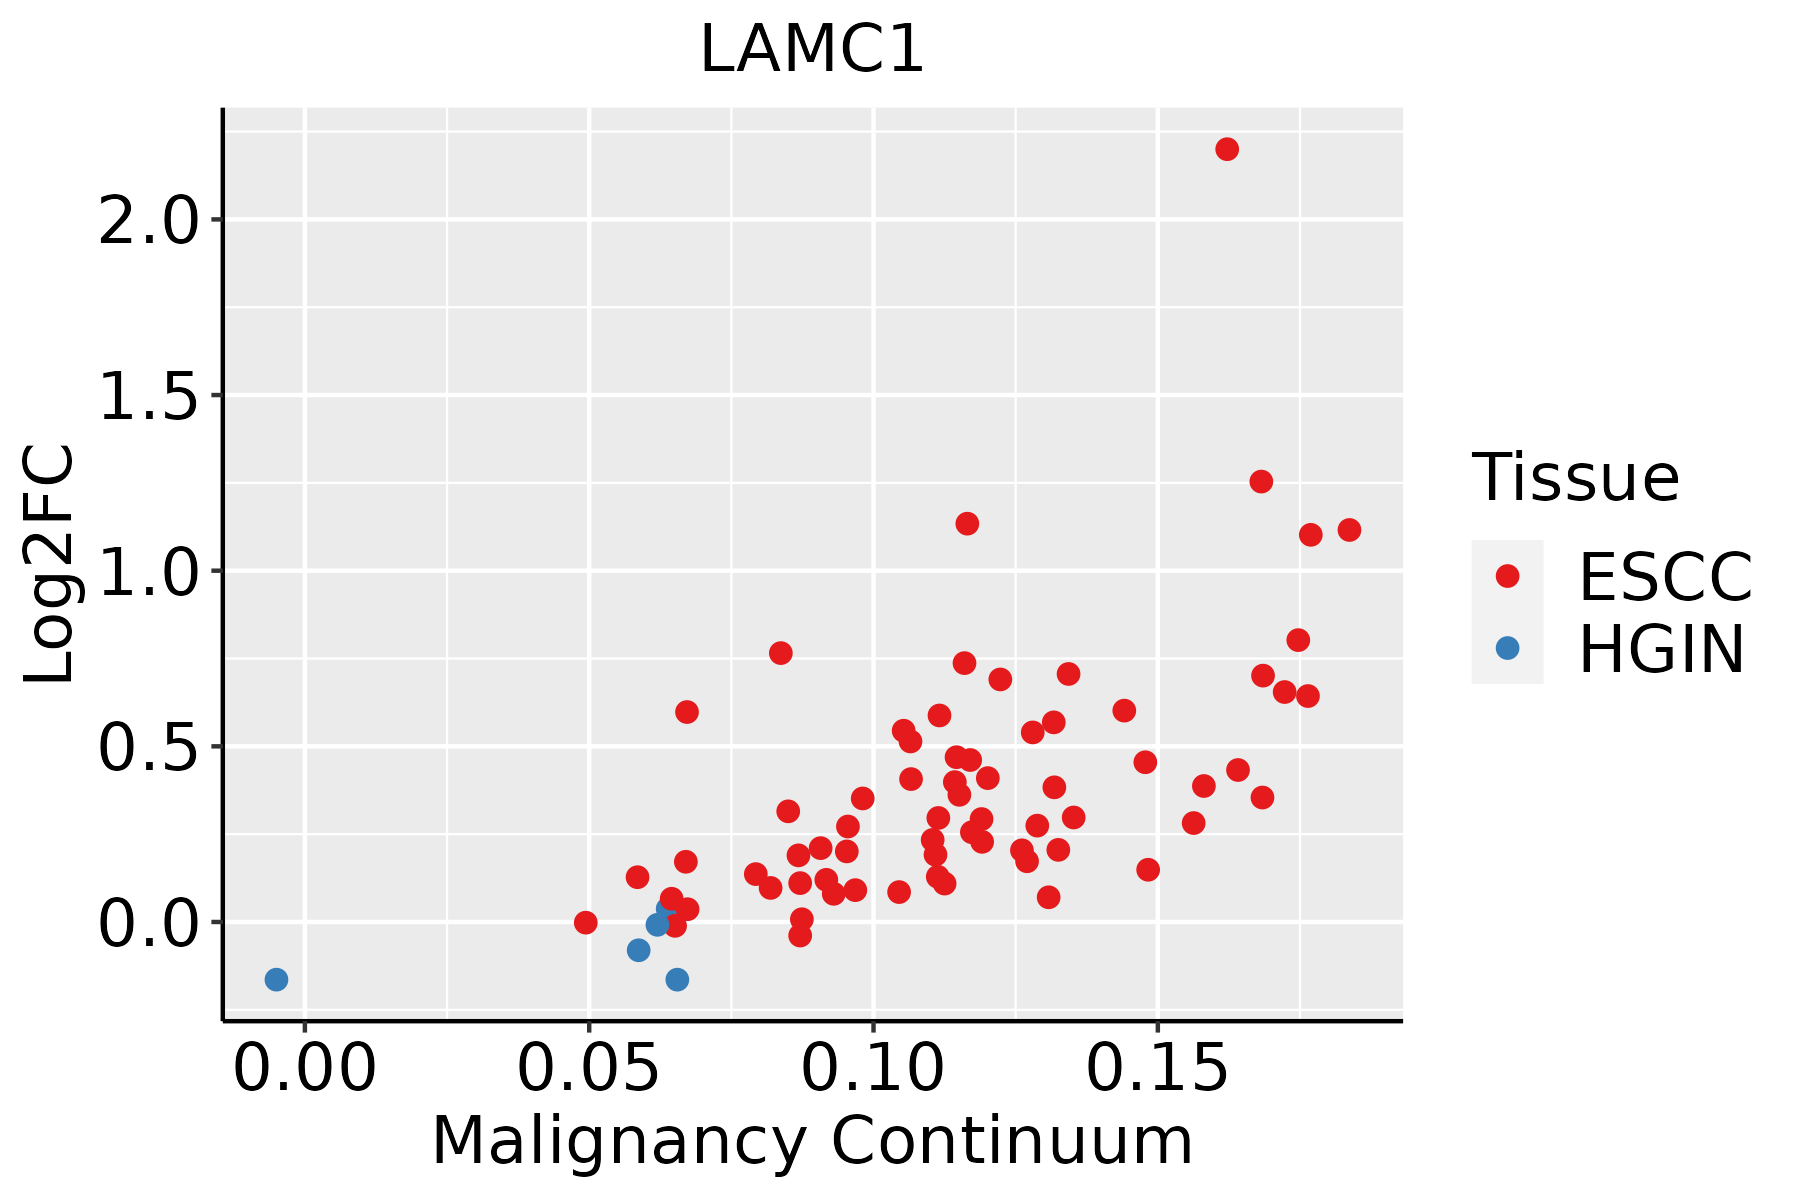 | ESCC: Esophageal squamous cell carcinoma |
| HGIN: High-grade intraepithelial neoplasias | ||
| LGIN: Low-grade intraepithelial neoplasias | ||
| Liver |  | HCC: Hepatocellular carcinoma |
| NAFLD: Non-alcoholic fatty liver disease | ||
| Oral Cavity | 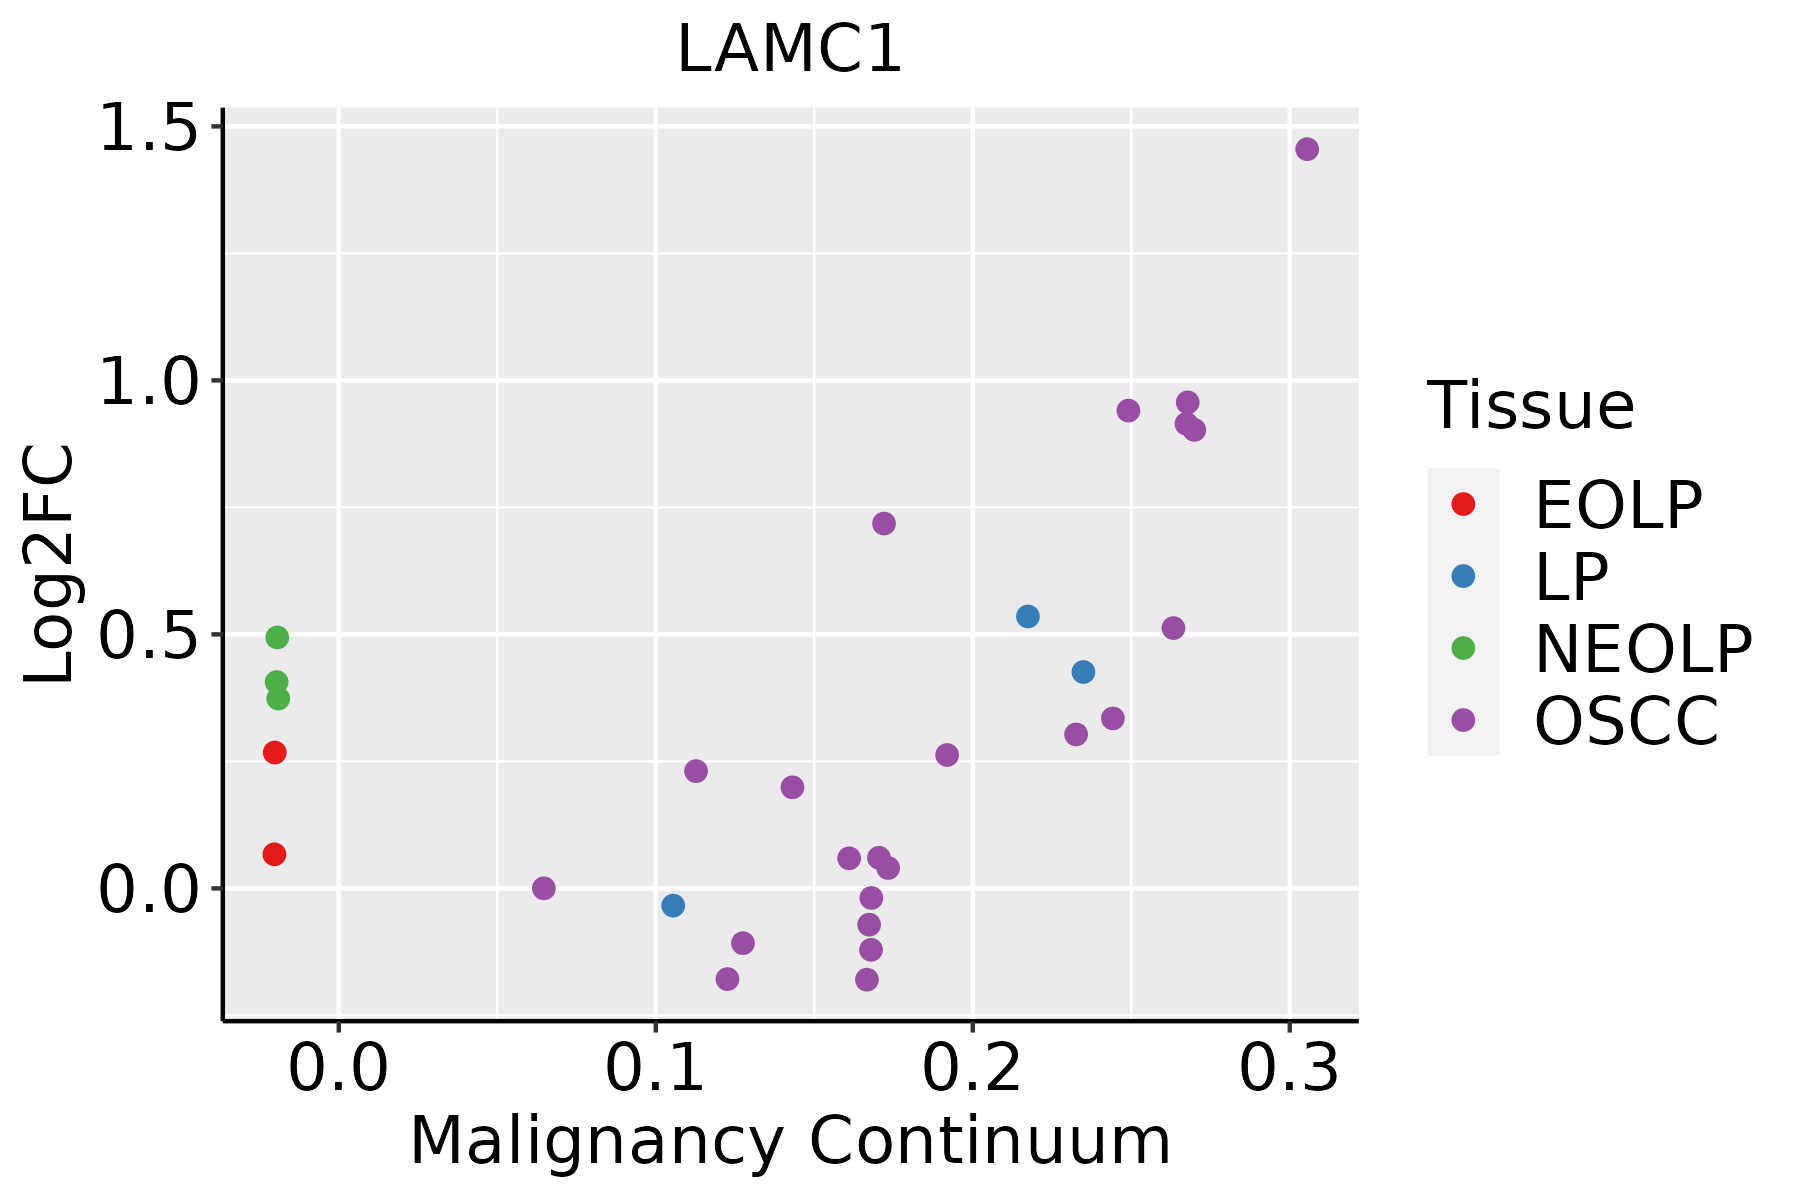 | EOLP: Erosive Oral lichen planus |
| LP: leukoplakia | ||
| NEOLP: Non-erosive oral lichen planus | ||
| OSCC: Oral squamous cell carcinoma | ||
| Prostate |  | BPH: Benign Prostatic Hyperplasia |
| Skin | 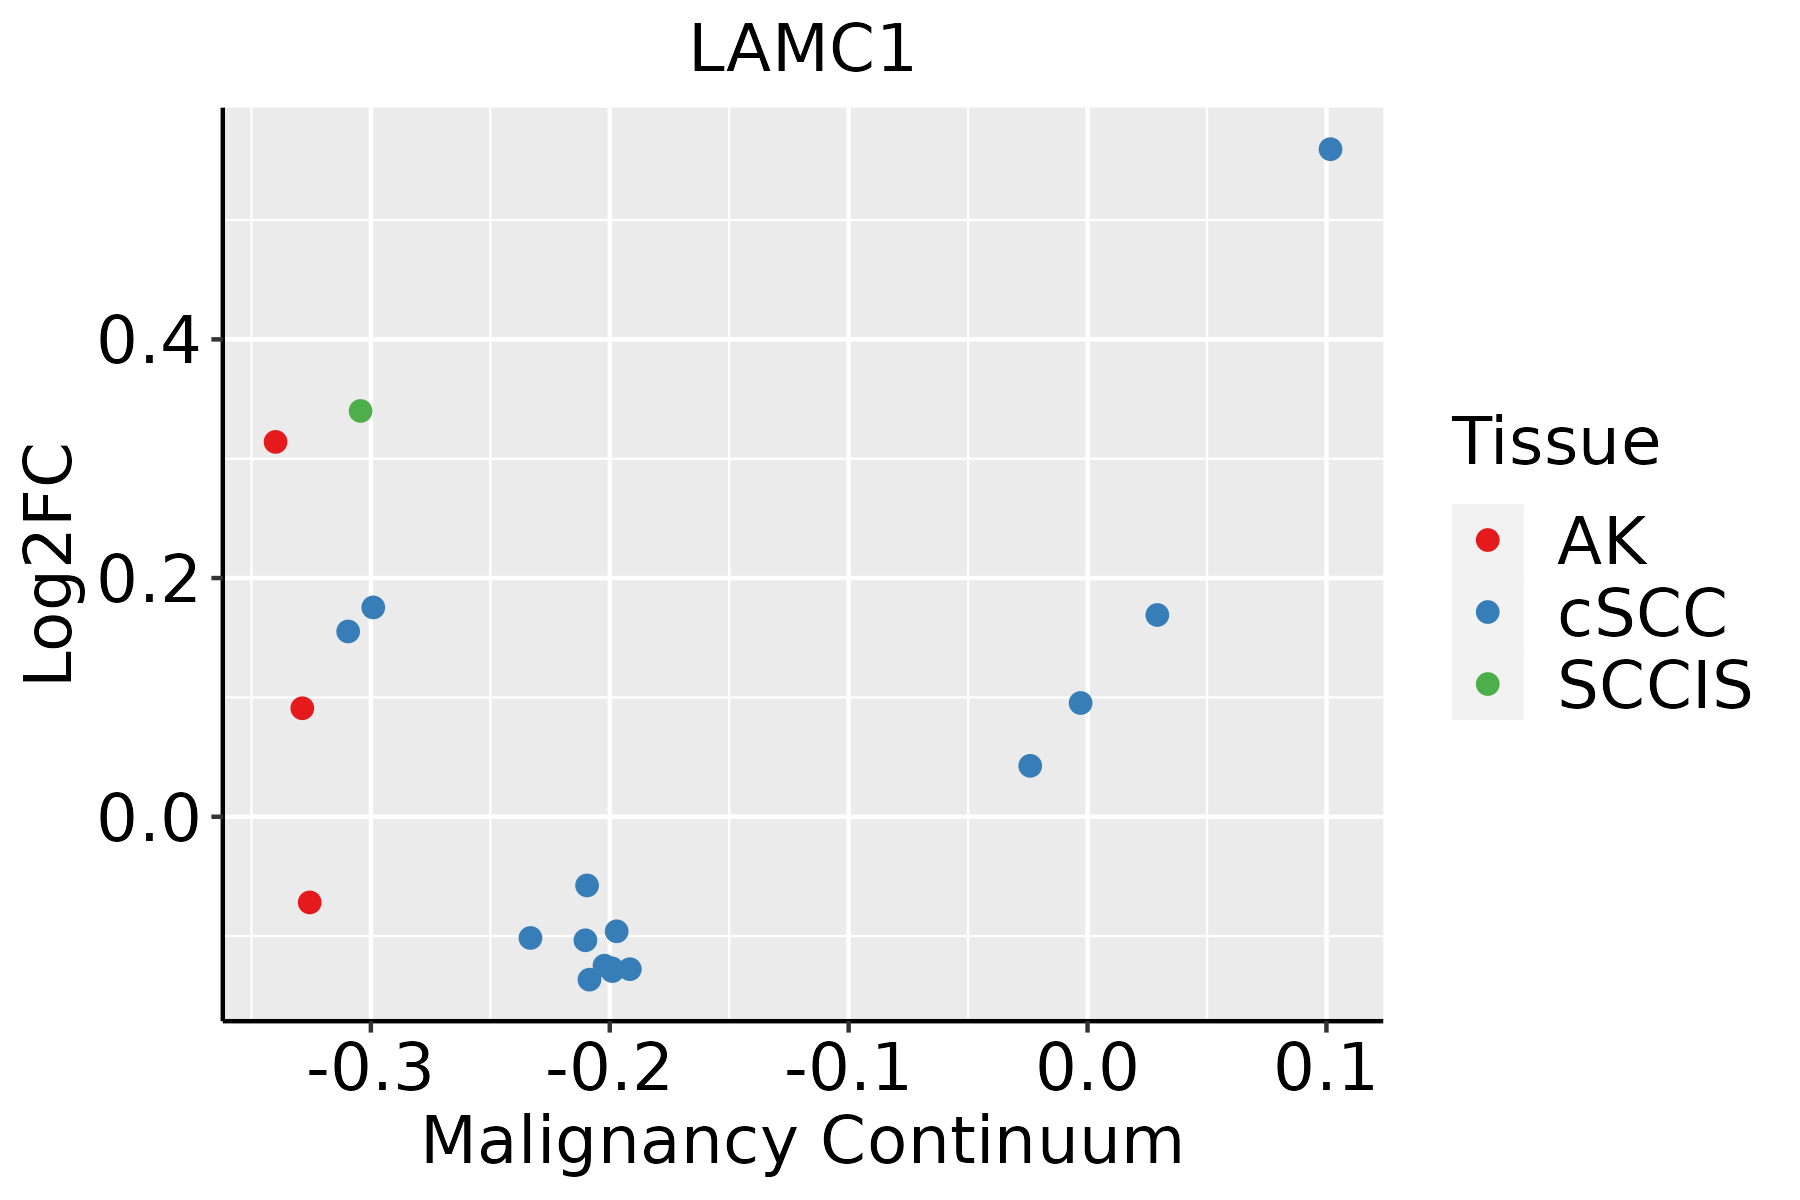 | AK: Actinic keratosis |
| cSCC: Cutaneous squamous cell carcinoma | ||
| SCCIS:squamous cell carcinoma in situ | ||
| Thyroid |  | ATC: Anaplastic thyroid cancer |
| HT: Hashimoto's thyroiditis | ||
| PTC: Papillary thyroid cancer |
| ∗log2FC in expression of this searched gene in stem-like cells from each diseased tissue sample relative to stem-like cells in normal samples in each tissue plotted against the malignancy continuum. Samples are colored based on if they are from different disease stage. |
Top |
Malignant transformation related pathway analysis |
| Find out the enriched GO biological processes and KEGG pathways involved in transition from healthy to precancer to cancer |
| Tissue | Disease Stage | Enriched GO biological Processes |
| Colorectum | AD |  |
| Colorectum | SER |  |
| Colorectum | MSS |  |
| Colorectum | MSI-H |  |
| Colorectum | FAP |  |
| ∗Top 15 enriched GO BP terms are showed in the bar plot of each disease state in each tissue. Each row represents a significant GO biological process which is colored according to the -log10(p.adjust). |
| Page: 1 2 3 4 5 6 7 8 9 |
| GO ID | Tissue | Disease Stage | Description | Gene Ratio | Bg Ratio | pvalue | p.adjust | Count |
| GO:00452291 | Prostate | BPH | external encapsulating structure organization | 66/3107 | 304/18723 | 1.15e-02 | 4.66e-02 | 66 |
| GO:015011516 | Prostate | Tumor | cell-substrate junction organization | 46/3246 | 101/18723 | 4.27e-11 | 2.82e-09 | 46 |
| GO:000704415 | Prostate | Tumor | cell-substrate junction assembly | 43/3246 | 95/18723 | 2.33e-10 | 1.34e-08 | 43 |
| GO:003158916 | Prostate | Tumor | cell-substrate adhesion | 109/3246 | 363/18723 | 1.41e-09 | 6.71e-08 | 109 |
| GO:005067316 | Prostate | Tumor | epithelial cell proliferation | 125/3246 | 437/18723 | 2.56e-09 | 1.08e-07 | 125 |
| GO:003444617 | Prostate | Tumor | substrate adhesion-dependent cell spreading | 44/3246 | 108/18723 | 8.25e-09 | 3.15e-07 | 44 |
| GO:005067815 | Prostate | Tumor | regulation of epithelial cell proliferation | 110/3246 | 381/18723 | 1.32e-08 | 4.82e-07 | 110 |
| GO:002241118 | Prostate | Tumor | cellular component disassembly | 121/3246 | 443/18723 | 8.10e-08 | 2.23e-06 | 121 |
| GO:003432915 | Prostate | Tumor | cell junction assembly | 113/3246 | 420/18723 | 4.94e-07 | 1.07e-05 | 113 |
| GO:003563315 | Prostate | Tumor | maintenance of blood-brain barrier | 17/3246 | 35/18723 | 2.09e-05 | 2.71e-04 | 17 |
| GO:000749211 | Prostate | Tumor | endoderm development | 28/3246 | 77/18723 | 5.01e-05 | 5.55e-04 | 28 |
| GO:005067914 | Prostate | Tumor | positive regulation of epithelial cell proliferation | 58/3246 | 207/18723 | 8.47e-05 | 8.47e-04 | 58 |
| GO:000189416 | Prostate | Tumor | tissue homeostasis | 65/3246 | 268/18723 | 2.39e-03 | 1.35e-02 | 65 |
| GO:006024915 | Prostate | Tumor | anatomical structure homeostasis | 74/3246 | 314/18723 | 2.82e-03 | 1.54e-02 | 74 |
| GO:0022411112 | Skin | cSCC | cellular component disassembly | 201/4864 | 443/18723 | 4.09e-19 | 5.69e-17 | 201 |
| GO:015011525 | Skin | cSCC | cell-substrate junction organization | 51/4864 | 101/18723 | 1.13e-07 | 2.68e-06 | 51 |
| GO:000704425 | Skin | cSCC | cell-substrate junction assembly | 48/4864 | 95/18723 | 2.57e-07 | 5.33e-06 | 48 |
| GO:003158926 | Skin | cSCC | cell-substrate adhesion | 130/4864 | 363/18723 | 1.87e-05 | 2.23e-04 | 130 |
| GO:005067324 | Skin | cSCC | epithelial cell proliferation | 144/4864 | 437/18723 | 6.07e-04 | 4.38e-03 | 144 |
| GO:0034446110 | Skin | cSCC | substrate adhesion-dependent cell spreading | 43/4864 | 108/18723 | 1.12e-03 | 7.36e-03 | 43 |
| Page: 1 2 3 4 5 6 7 8 9 |
| Pathway ID | Tissue | Disease Stage | Description | Gene Ratio | Bg Ratio | pvalue | p.adjust | qvalue | Count |
| hsa0502018 | Cervix | CC | Prion disease | 98/1267 | 273/8465 | 2.64e-18 | 1.42e-16 | 8.42e-17 | 98 |
| hsa0451010 | Cervix | CC | Focal adhesion | 59/1267 | 203/8465 | 1.53e-07 | 1.84e-06 | 1.09e-06 | 59 |
| hsa0514514 | Cervix | CC | Toxoplasmosis | 34/1267 | 112/8465 | 2.42e-05 | 1.82e-04 | 1.08e-04 | 34 |
| hsa052226 | Cervix | CC | Small cell lung cancer | 29/1267 | 92/8465 | 4.38e-05 | 3.09e-04 | 1.83e-04 | 29 |
| hsa051657 | Cervix | CC | Human papillomavirus infection | 74/1267 | 331/8465 | 1.70e-04 | 1.02e-03 | 6.03e-04 | 74 |
| hsa051465 | Cervix | CC | Amoebiasis | 29/1267 | 102/8465 | 3.31e-04 | 1.70e-03 | 1.01e-03 | 29 |
| hsa0502019 | Cervix | CC | Prion disease | 98/1267 | 273/8465 | 2.64e-18 | 1.42e-16 | 8.42e-17 | 98 |
| hsa0451014 | Cervix | CC | Focal adhesion | 59/1267 | 203/8465 | 1.53e-07 | 1.84e-06 | 1.09e-06 | 59 |
| hsa0514515 | Cervix | CC | Toxoplasmosis | 34/1267 | 112/8465 | 2.42e-05 | 1.82e-04 | 1.08e-04 | 34 |
| hsa0522213 | Cervix | CC | Small cell lung cancer | 29/1267 | 92/8465 | 4.38e-05 | 3.09e-04 | 1.83e-04 | 29 |
| hsa0516512 | Cervix | CC | Human papillomavirus infection | 74/1267 | 331/8465 | 1.70e-04 | 1.02e-03 | 6.03e-04 | 74 |
| hsa0514612 | Cervix | CC | Amoebiasis | 29/1267 | 102/8465 | 3.31e-04 | 1.70e-03 | 1.01e-03 | 29 |
| hsa0502020 | Endometrium | AEH | Prion disease | 110/1197 | 273/8465 | 2.39e-27 | 2.44e-25 | 1.78e-25 | 110 |
| hsa0451015 | Endometrium | AEH | Focal adhesion | 58/1197 | 203/8465 | 4.99e-08 | 7.37e-07 | 5.39e-07 | 58 |
| hsa051466 | Endometrium | AEH | Amoebiasis | 29/1197 | 102/8465 | 1.22e-04 | 1.10e-03 | 8.06e-04 | 29 |
| hsa05020110 | Endometrium | AEH | Prion disease | 110/1197 | 273/8465 | 2.39e-27 | 2.44e-25 | 1.78e-25 | 110 |
| hsa0451016 | Endometrium | AEH | Focal adhesion | 58/1197 | 203/8465 | 4.99e-08 | 7.37e-07 | 5.39e-07 | 58 |
| hsa0514613 | Endometrium | AEH | Amoebiasis | 29/1197 | 102/8465 | 1.22e-04 | 1.10e-03 | 8.06e-04 | 29 |
| hsa0502025 | Endometrium | EEC | Prion disease | 111/1237 | 273/8465 | 1.01e-26 | 8.27e-25 | 6.16e-25 | 111 |
| hsa0451024 | Endometrium | EEC | Focal adhesion | 58/1237 | 203/8465 | 1.61e-07 | 2.30e-06 | 1.71e-06 | 58 |
| Page: 1 2 3 4 5 6 7 |
Top |
Cell-cell communication analysis |
| Identification of potential cell-cell interactions between two cell types and their ligand-receptor pairs for different disease states |
| Ligand | Receptor | LRpair | Pathway | Tissue | Disease Stage |
| LAMC1 | ITGA1_ITGB1 | LAMC1_ITGA1_ITGB1 | LAMININ | Breast | ADJ |
| LAMC1 | ITGA2_ITGB1 | LAMC1_ITGA2_ITGB1 | LAMININ | Breast | ADJ |
| LAMC1 | CD44 | LAMC1_CD44 | LAMININ | Breast | ADJ |
| LAMC1 | ITGA1_ITGB1 | LAMC1_ITGA1_ITGB1 | LAMININ | Breast | DCIS |
| LAMC1 | ITGA2_ITGB1 | LAMC1_ITGA2_ITGB1 | LAMININ | Breast | DCIS |
| LAMC1 | ITGA6_ITGB1 | LAMC1_ITGA6_ITGB1 | LAMININ | Breast | DCIS |
| LAMC1 | ITGA7_ITGB1 | LAMC1_ITGA7_ITGB1 | LAMININ | Breast | DCIS |
| LAMC1 | ITGA6_ITGB4 | LAMC1_ITGA6_ITGB4 | LAMININ | Breast | DCIS |
| LAMC1 | CD44 | LAMC1_CD44 | LAMININ | Breast | DCIS |
| LAMC1 | DAG1 | LAMC1_DAG1 | LAMININ | Breast | DCIS |
| LAMC1 | ITGA1_ITGB1 | LAMC1_ITGA1_ITGB1 | LAMININ | Breast | Healthy |
| LAMC1 | ITGA2_ITGB1 | LAMC1_ITGA2_ITGB1 | LAMININ | Breast | Healthy |
| LAMC1 | ITGA6_ITGB1 | LAMC1_ITGA6_ITGB1 | LAMININ | Breast | Healthy |
| LAMC1 | ITGA7_ITGB1 | LAMC1_ITGA7_ITGB1 | LAMININ | Breast | Healthy |
| LAMC1 | ITGAV_ITGB8 | LAMC1_ITGAV_ITGB8 | LAMININ | Breast | Healthy |
| LAMC1 | CD44 | LAMC1_CD44 | LAMININ | Breast | Healthy |
| LAMC1 | ITGA1_ITGB1 | LAMC1_ITGA1_ITGB1 | LAMININ | Breast | IDC |
| LAMC1 | ITGA6_ITGB1 | LAMC1_ITGA6_ITGB1 | LAMININ | Breast | IDC |
| LAMC1 | CD44 | LAMC1_CD44 | LAMININ | Breast | IDC |
| LAMC1 | ITGA1_ITGB1 | LAMC1_ITGA1_ITGB1 | LAMININ | Breast | Precancer |
| Page: 1 2 3 4 5 6 7 8 9 10 11 12 13 14 15 16 17 |
Top |
Single-cell gene regulatory network inference analysis |
| Find out the significant the regulons (TFs) and the target genes of each regulon across cell types for different disease states |
| TF | Cell Type | Tissue | Disease Stage | Target Gene | RSS | Regulon Activity |
| ∗The dot plots of a searched regulon are shown for all cell subpopulations in each disease state of each tissue based on the regulon specific score inferred using pySCENIC and by calculating the average expression. |
| Page: 1 |
Top |
Somatic mutation of malignant transformation related genes |
| Annotation of somatic variants for genes involved in malignant transformation |
| Hugo Symbol | Variant Class | Variant Classification | dbSNP RS | HGVSc | HGVSp | HGVSp Short | SWISSPROT | BIOTYPE | SIFT | PolyPhen | Tumor Sample Barcode | Tissue | Histology | Sex | Age | Stage | Therapy Types | Drugs | Outcome |
| LAMC1 | SNV | Missense_Mutation | c.3031N>T | p.Arg1011Cys | p.R1011C | P11047 | protein_coding | deleterious(0) | probably_damaging(0.994) | TCGA-A8-A081-01 | Breast | breast invasive carcinoma | Female | >=65 | I/II | Unknown | Unknown | SD | |
| LAMC1 | SNV | Missense_Mutation | rs754467490 | c.598N>A | p.Glu200Lys | p.E200K | P11047 | protein_coding | deleterious(0) | probably_damaging(0.994) | TCGA-A8-A09Z-01 | Breast | breast invasive carcinoma | Female | >=65 | I/II | Unknown | Unknown | SD |
| LAMC1 | SNV | Missense_Mutation | novel | c.4420N>C | p.Glu1474Gln | p.E1474Q | P11047 | protein_coding | tolerated(0.13) | benign(0.012) | TCGA-AC-A5XS-01 | Breast | breast invasive carcinoma | Female | >=65 | I/II | Hormone Therapy | femara | SD |
| LAMC1 | SNV | Missense_Mutation | c.2769N>G | p.Phe923Leu | p.F923L | P11047 | protein_coding | deleterious(0.01) | benign(0.11) | TCGA-AN-A0XW-01 | Breast | breast invasive carcinoma | Female | <65 | III/IV | Unknown | Unknown | SD | |
| LAMC1 | SNV | Missense_Mutation | rs146505800 | c.4298N>T | p.Ala1433Val | p.A1433V | P11047 | protein_coding | deleterious(0) | probably_damaging(0.992) | TCGA-AO-A128-01 | Breast | breast invasive carcinoma | Female | <65 | I/II | Chemotherapy | doxorubicin | SD |
| LAMC1 | SNV | Missense_Mutation | rs746484378 | c.1034N>G | p.Asn345Ser | p.N345S | P11047 | protein_coding | tolerated(0.77) | probably_damaging(0.998) | TCGA-AR-A256-01 | Breast | breast invasive carcinoma | Female | <65 | I/II | Chemotherapy | doxorubicin | PD |
| LAMC1 | SNV | Missense_Mutation | rs200849348 | c.2899N>T | p.Arg967Cys | p.R967C | P11047 | protein_coding | deleterious(0) | possibly_damaging(0.803) | TCGA-AR-A2LJ-01 | Breast | breast invasive carcinoma | Female | <65 | III/IV | Chemotherapy | adriamycin | SD |
| LAMC1 | SNV | Missense_Mutation | c.2033N>T | p.Pro678Leu | p.P678L | P11047 | protein_coding | tolerated(0.05) | benign(0.053) | TCGA-BH-A1F2-01 | Breast | breast invasive carcinoma | Female | <65 | III/IV | Unknown | Unknown | SD | |
| LAMC1 | SNV | Missense_Mutation | c.1724A>G | p.Gln575Arg | p.Q575R | P11047 | protein_coding | deleterious(0) | probably_damaging(0.999) | TCGA-D8-A1XQ-01 | Breast | breast invasive carcinoma | Female | >=65 | I/II | Unknown | Unknown | SD | |
| LAMC1 | SNV | Missense_Mutation | c.2409N>C | p.Arg803Ser | p.R803S | P11047 | protein_coding | deleterious(0) | probably_damaging(0.976) | TCGA-E2-A1L8-01 | Breast | breast invasive carcinoma | Female | <65 | I/II | Chemotherapy | cyclophosphamide | SD |
| Page: 1 2 3 4 5 6 7 8 9 10 11 12 13 14 15 16 17 18 |
Top |
Related drugs of malignant transformation related genes |
| Identification of chemicals and drugs interact with genes involved in malignant transfromation |
| (DGIdb 4.0) |
| Entrez ID | Symbol | Category | Interaction Types | Drug Claim Name | Drug Name | PMIDs |
| Page: 1 |

Copyright 2023-Present -The University of Texas Health Science Center at Houston |