| Tissue | Expression Dynamics | Abbreviation |
| Esophagus | 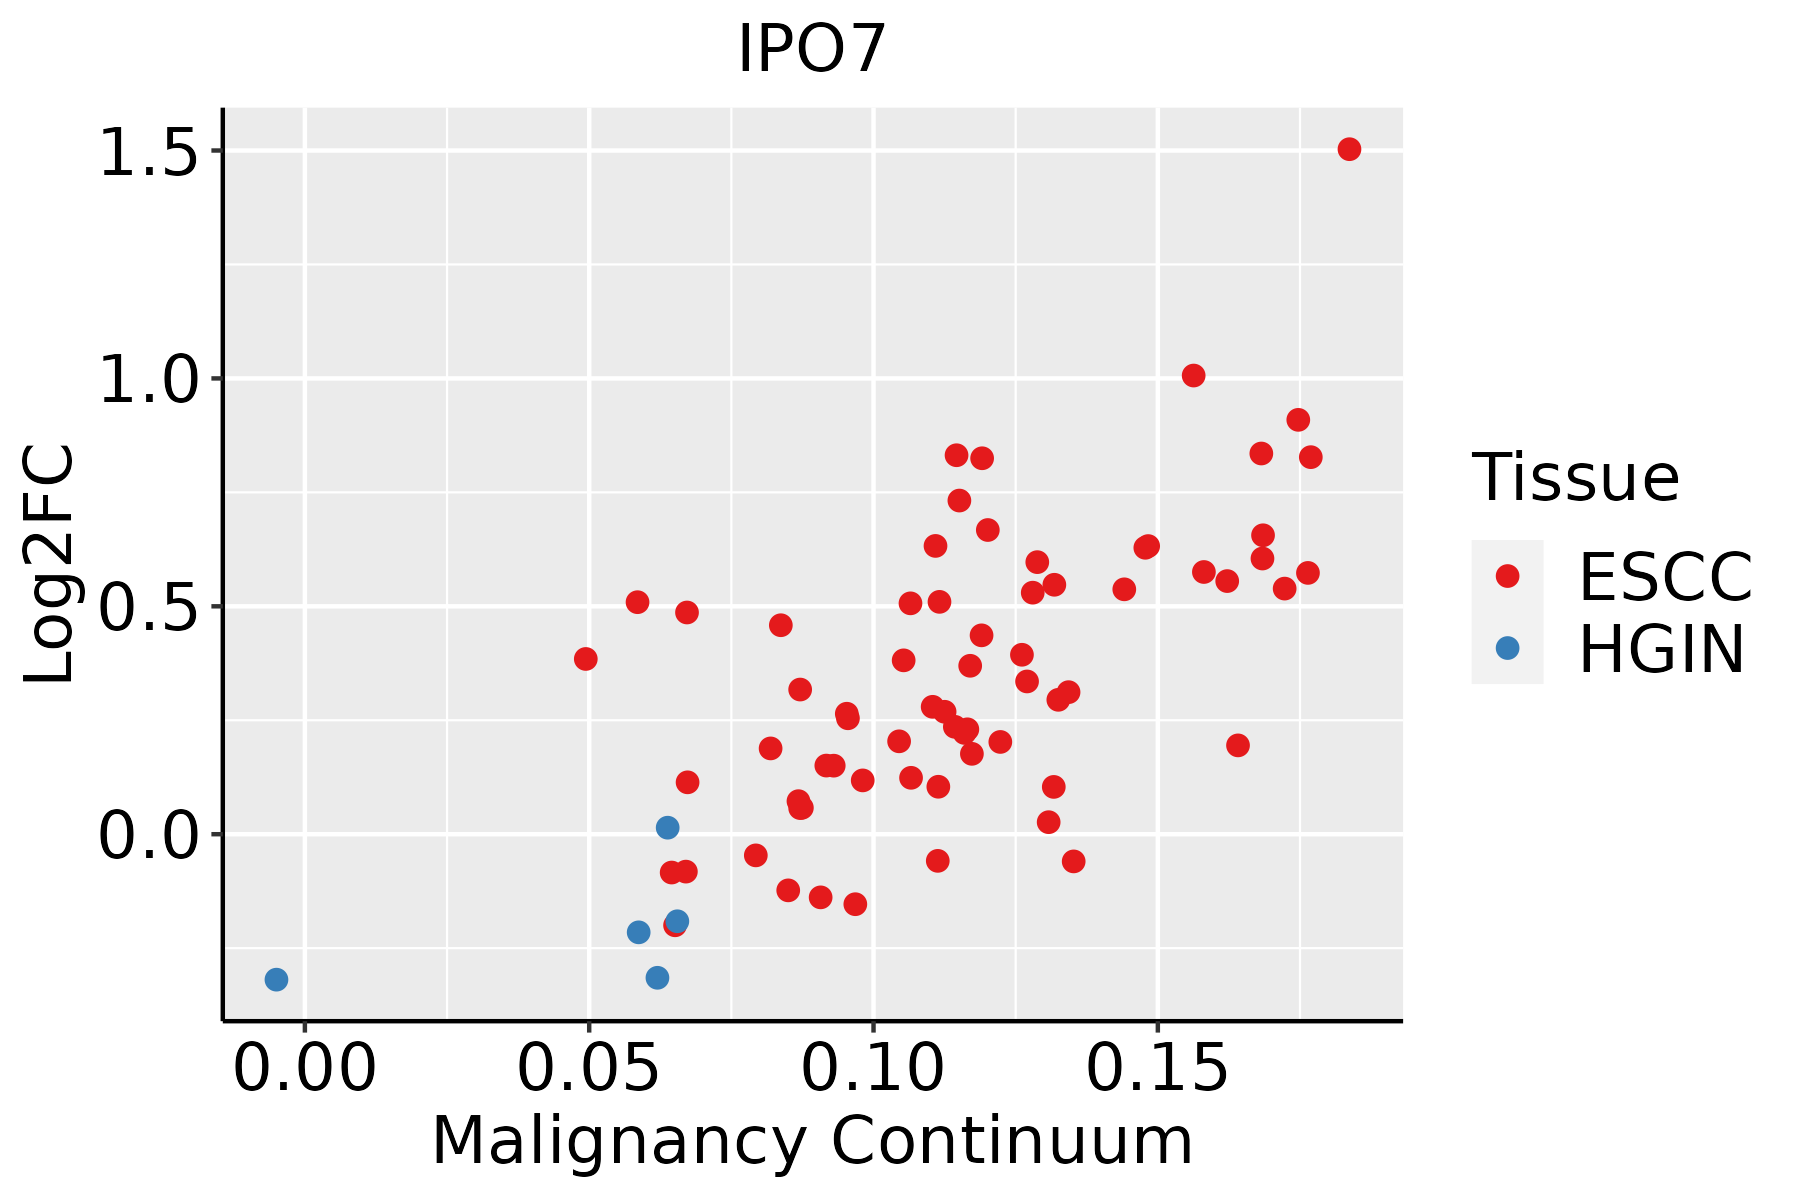 | ESCC: Esophageal squamous cell carcinoma |
| HGIN: High-grade intraepithelial neoplasias |
| LGIN: Low-grade intraepithelial neoplasias |
| Liver | 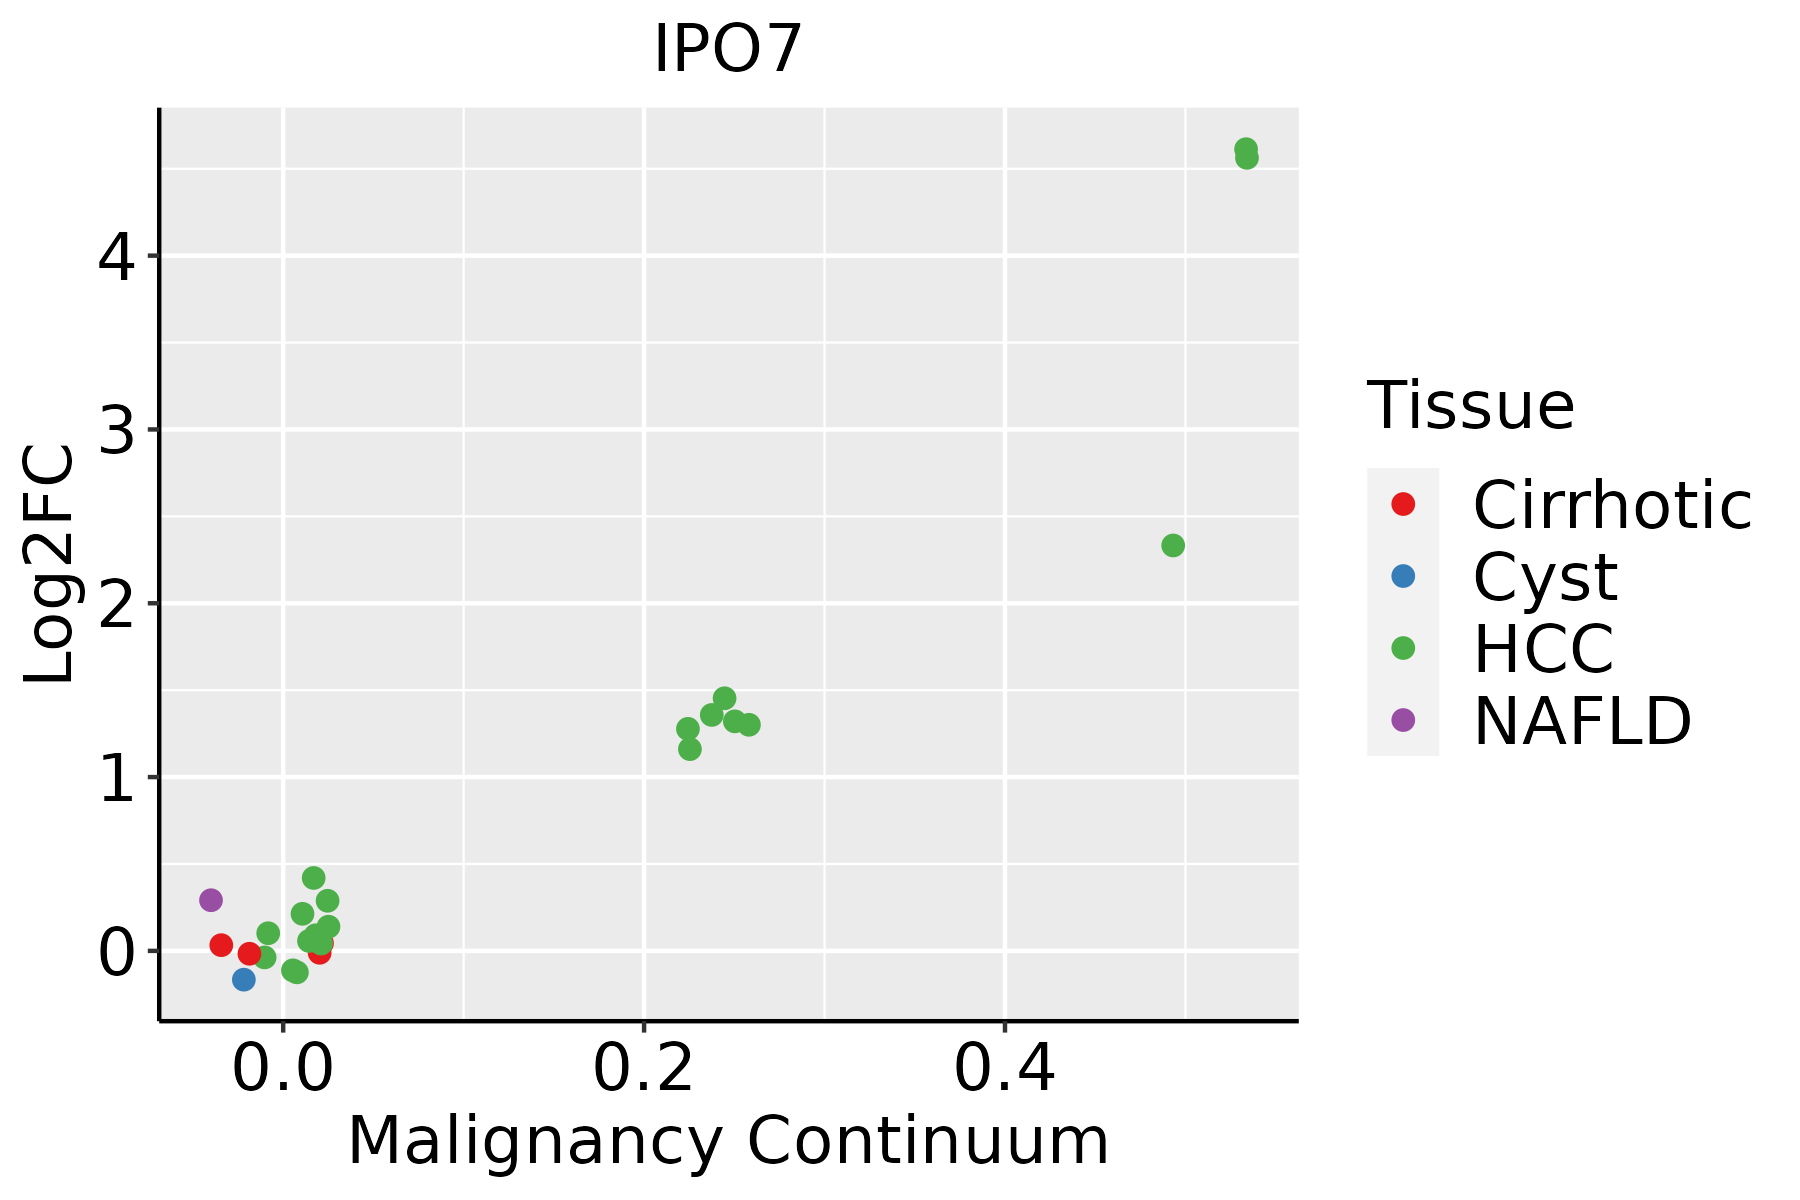 | HCC: Hepatocellular carcinoma |
| NAFLD: Non-alcoholic fatty liver disease |
| Oral Cavity | 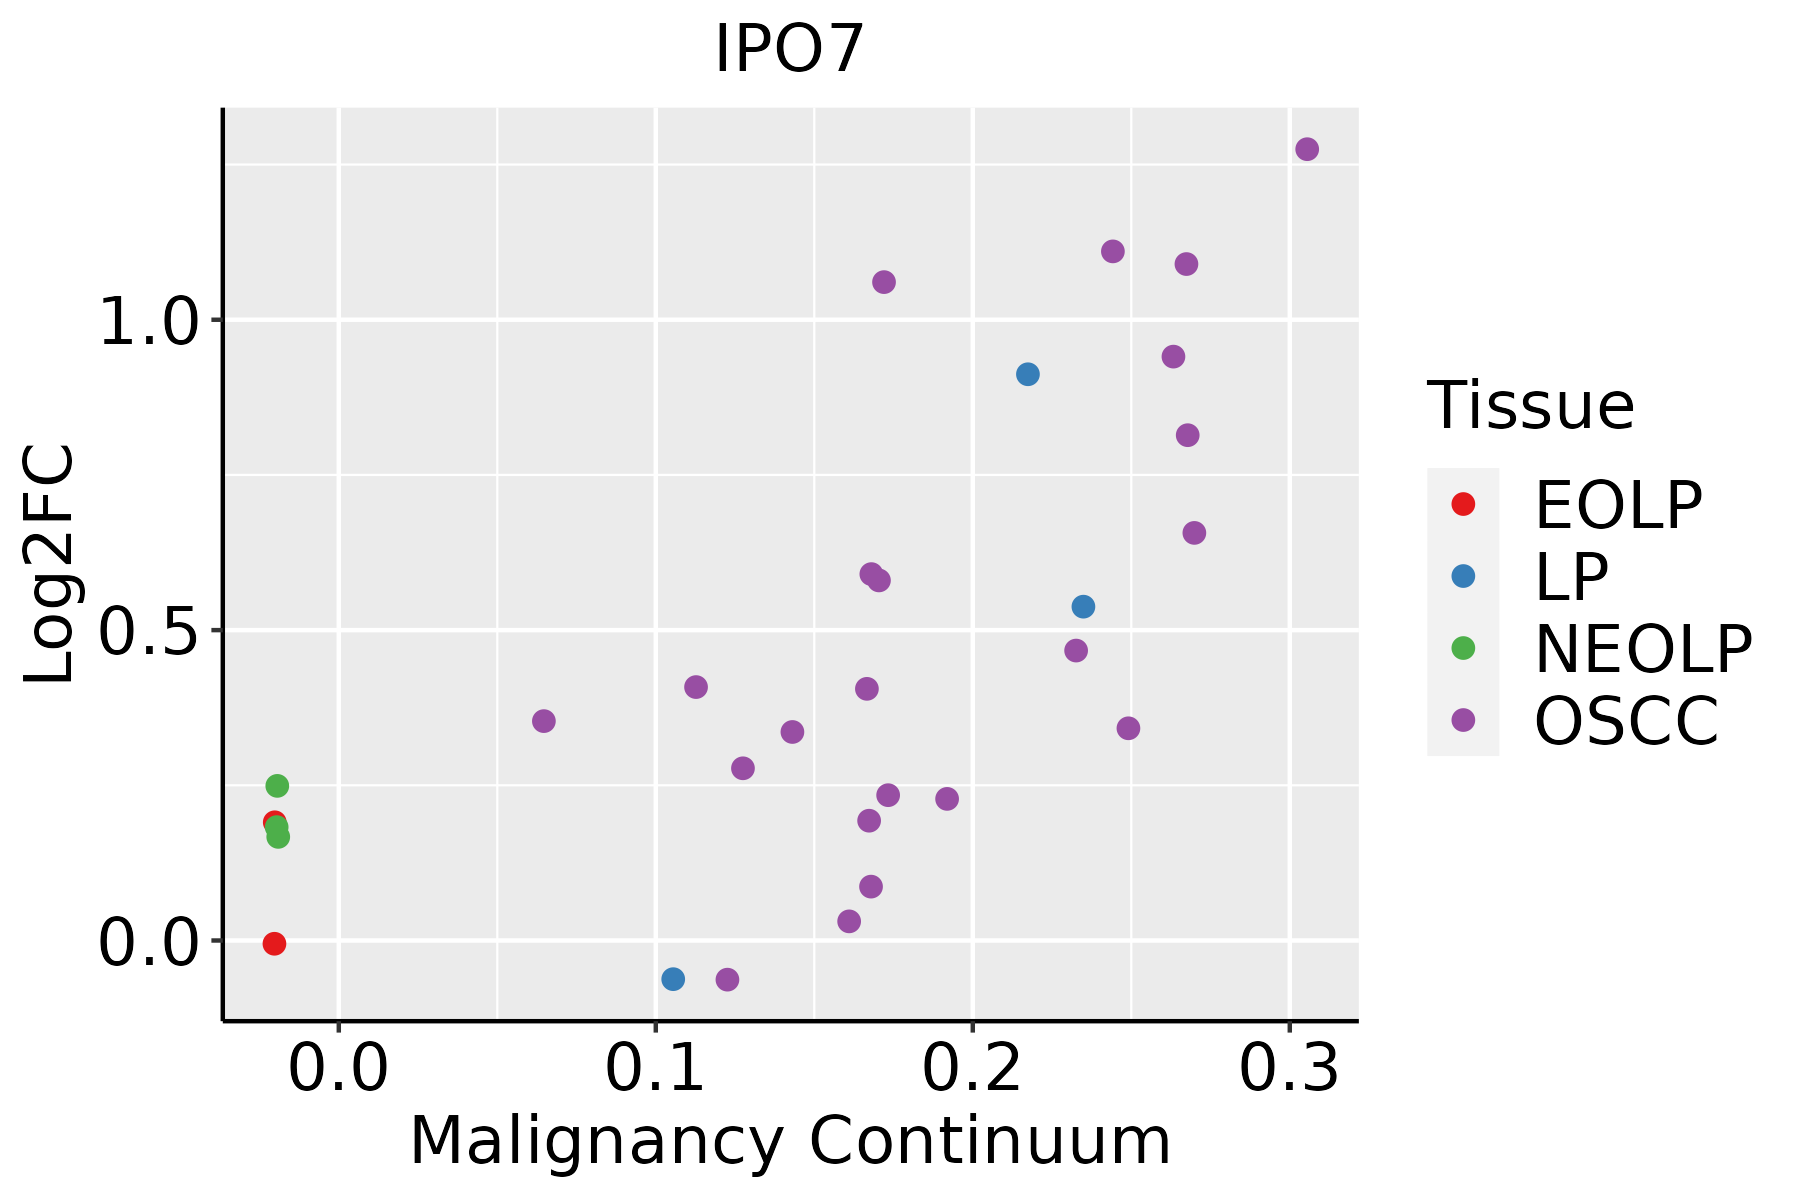 | EOLP: Erosive Oral lichen planus |
| LP: leukoplakia |
| NEOLP: Non-erosive oral lichen planus |
| OSCC: Oral squamous cell carcinoma |
| Prostate | 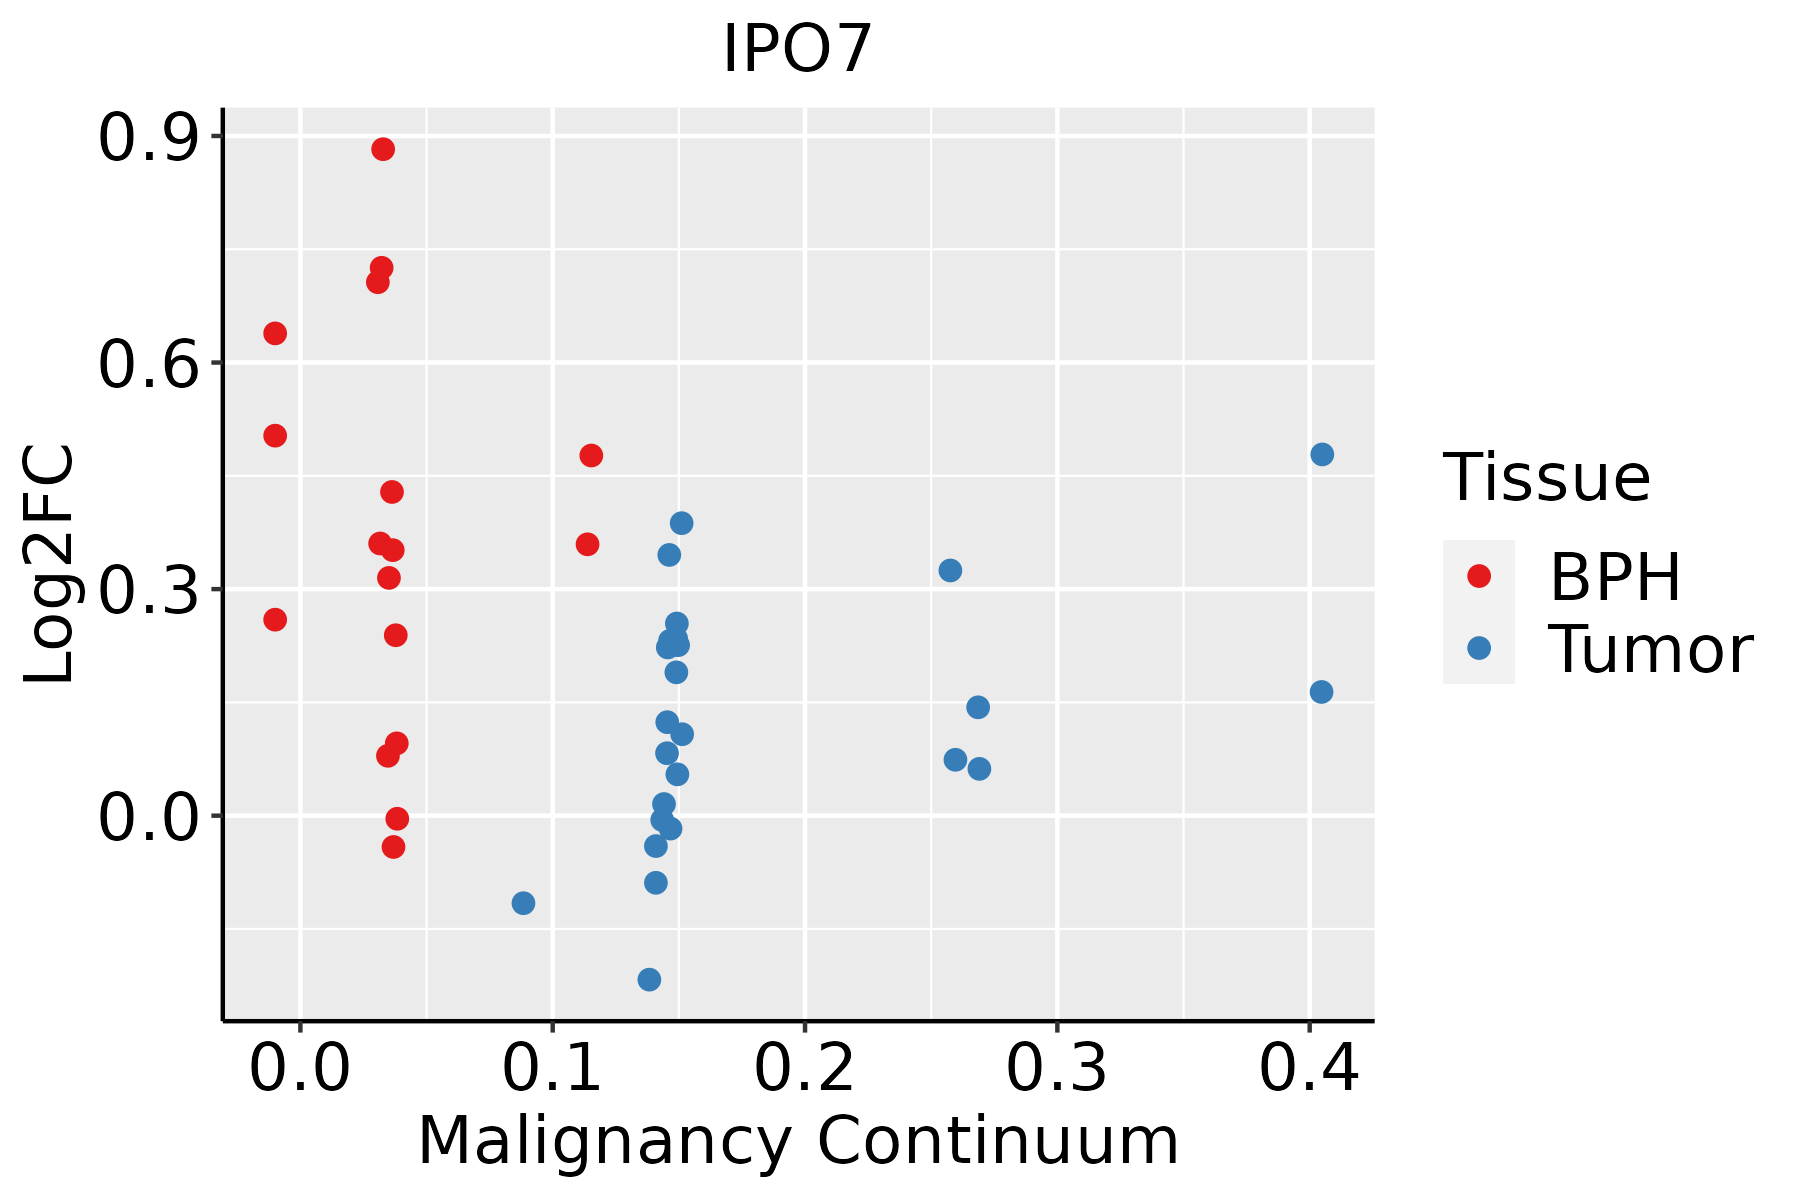 | BPH: Benign Prostatic Hyperplasia |
| Skin | 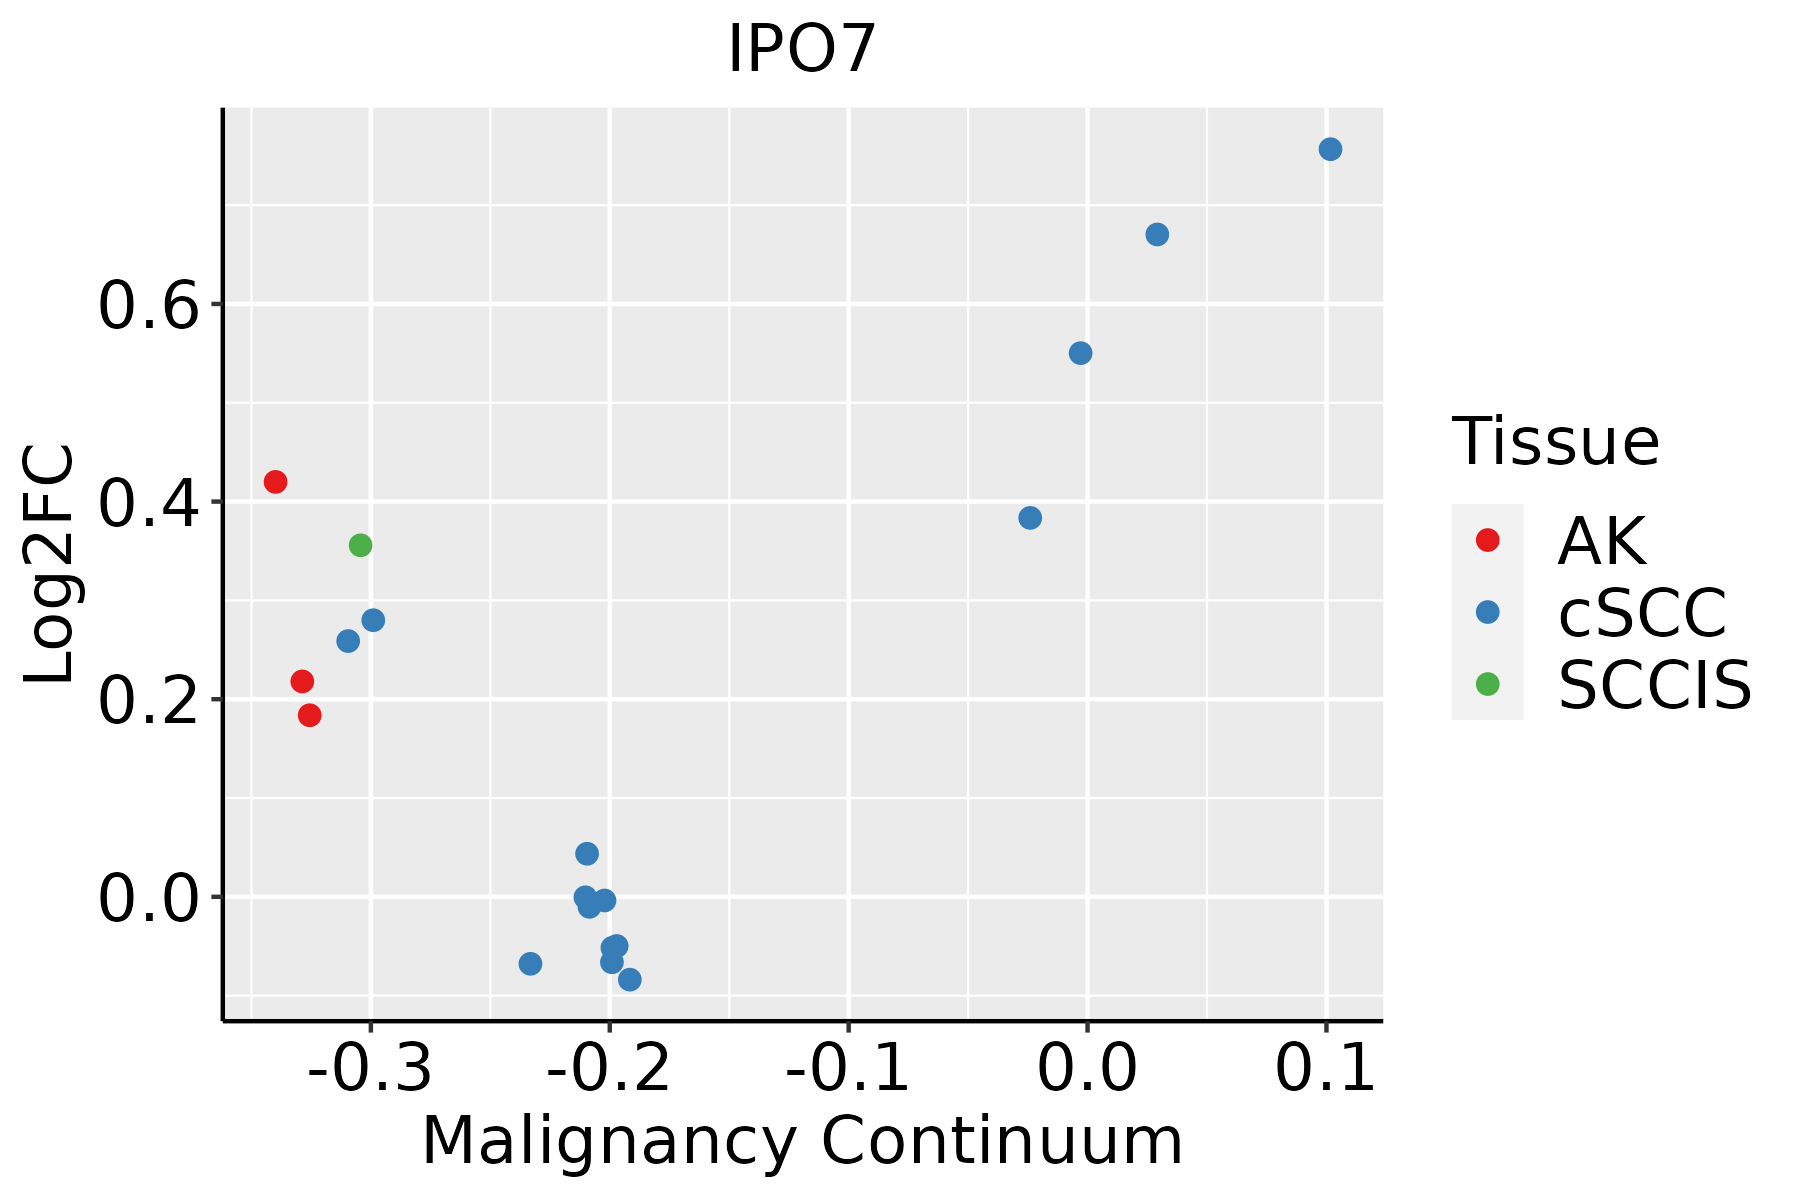 | AK: Actinic keratosis |
| cSCC: Cutaneous squamous cell carcinoma |
| SCCIS:squamous cell carcinoma in situ |
| Thyroid | 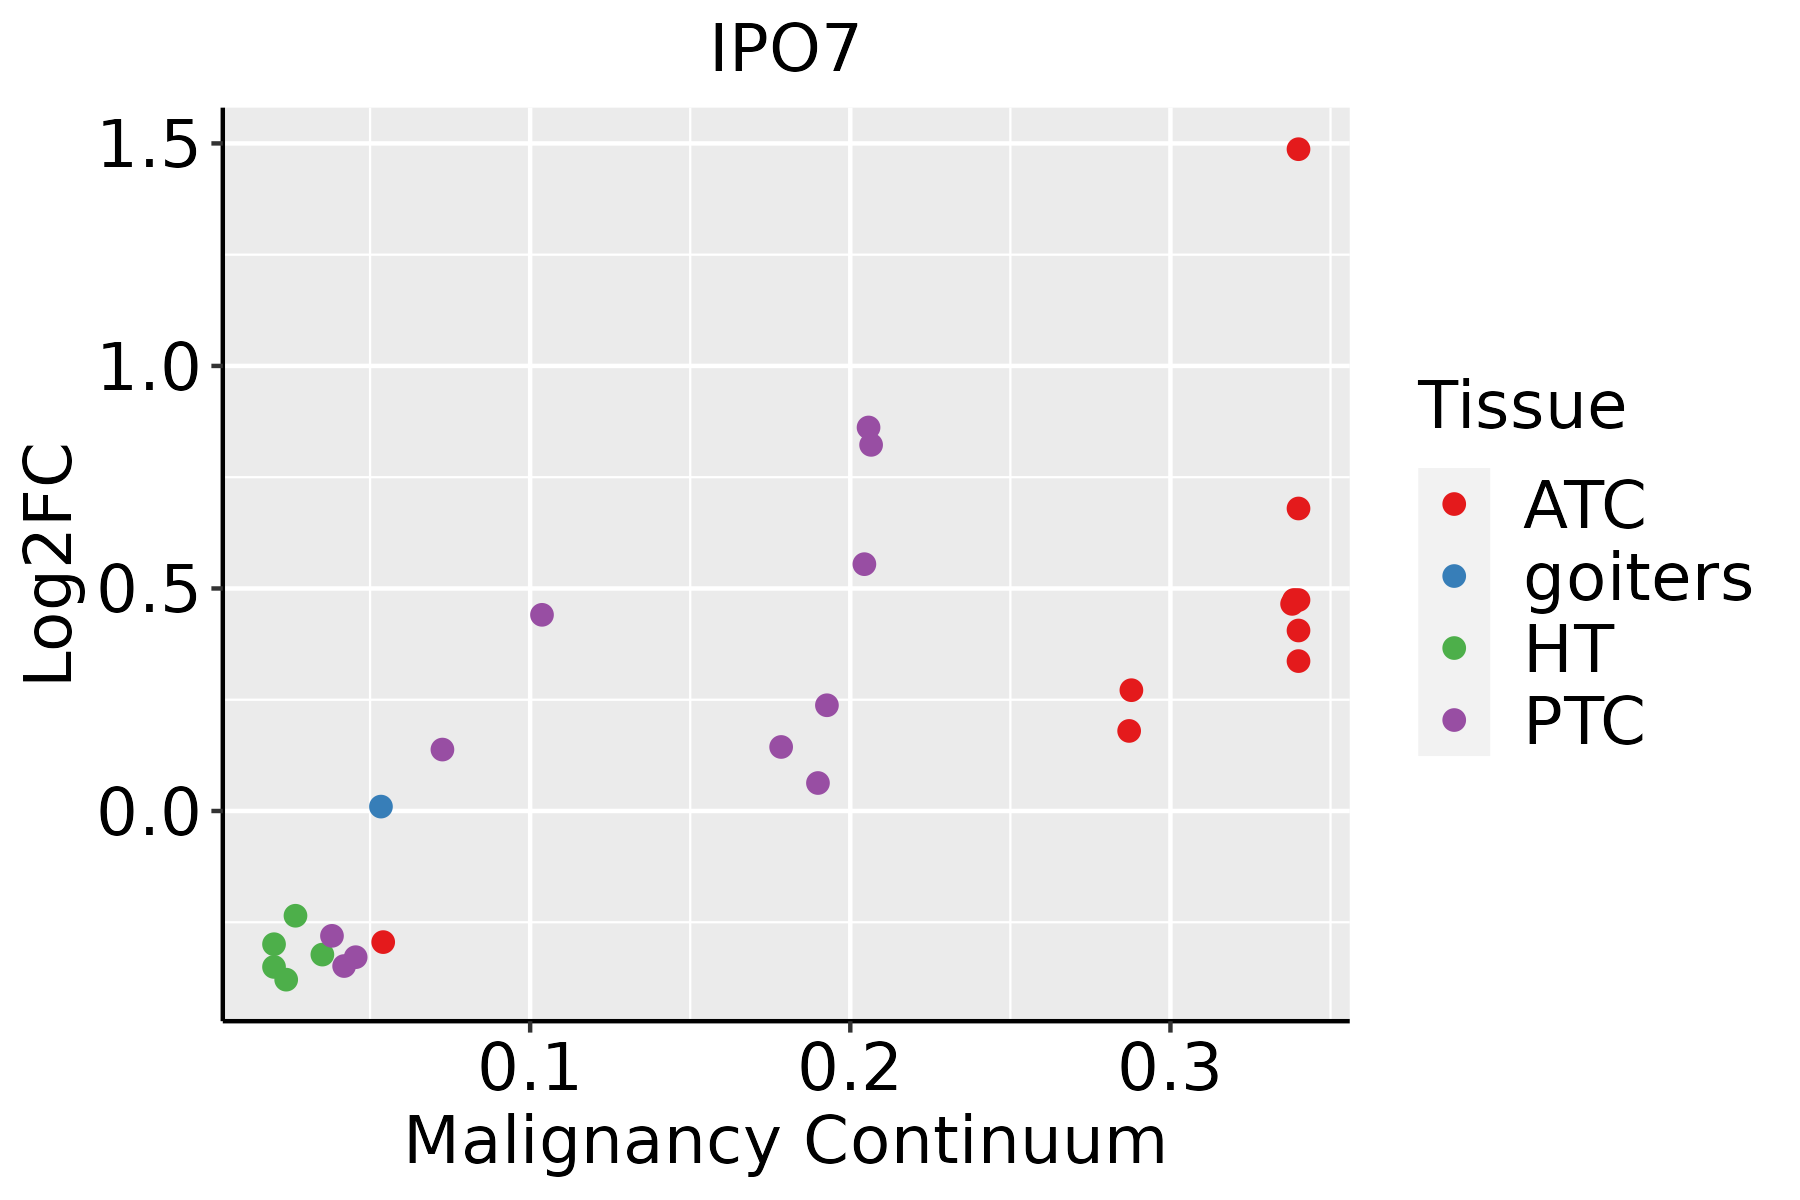 | ATC: Anaplastic thyroid cancer |
| HT: Hashimoto's thyroiditis |
| PTC: Papillary thyroid cancer |
| GO ID | Tissue | Disease Stage | Description | Gene Ratio | Bg Ratio | pvalue | p.adjust | Count |
| GO:001703831 | Oral cavity | NEOLP | protein import | 42/2005 | 206/18723 | 2.98e-05 | 4.54e-04 | 42 |
| GO:000660631 | Oral cavity | NEOLP | protein import into nucleus | 34/2005 | 155/18723 | 3.55e-05 | 5.20e-04 | 34 |
| GO:007259416 | Prostate | BPH | establishment of protein localization to organelle | 142/3107 | 422/18723 | 4.01e-18 | 1.31e-15 | 142 |
| GO:003450410 | Prostate | BPH | protein localization to nucleus | 98/3107 | 290/18723 | 4.78e-13 | 4.35e-11 | 98 |
| GO:004593618 | Prostate | BPH | negative regulation of phosphate metabolic process | 124/3107 | 441/18723 | 5.95e-10 | 2.90e-08 | 124 |
| GO:001056318 | Prostate | BPH | negative regulation of phosphorus metabolic process | 124/3107 | 442/18723 | 6.94e-10 | 3.25e-08 | 124 |
| GO:000691315 | Prostate | BPH | nucleocytoplasmic transport | 92/3107 | 301/18723 | 1.09e-09 | 4.84e-08 | 92 |
| GO:005116915 | Prostate | BPH | nuclear transport | 92/3107 | 301/18723 | 1.09e-09 | 4.84e-08 | 92 |
| GO:004232617 | Prostate | BPH | negative regulation of phosphorylation | 110/3107 | 385/18723 | 2.08e-09 | 8.35e-08 | 110 |
| GO:000193317 | Prostate | BPH | negative regulation of protein phosphorylation | 97/3107 | 342/18723 | 2.74e-08 | 8.11e-07 | 97 |
| GO:005134818 | Prostate | BPH | negative regulation of transferase activity | 78/3107 | 268/18723 | 1.94e-07 | 4.29e-06 | 78 |
| GO:00719009 | Prostate | BPH | regulation of protein serine/threonine kinase activity | 97/3107 | 359/18723 | 3.42e-07 | 7.23e-06 | 97 |
| GO:001703810 | Prostate | BPH | protein import | 62/3107 | 206/18723 | 9.72e-07 | 1.77e-05 | 62 |
| GO:000646916 | Prostate | BPH | negative regulation of protein kinase activity | 62/3107 | 212/18723 | 2.81e-06 | 4.45e-05 | 62 |
| GO:003367315 | Prostate | BPH | negative regulation of kinase activity | 67/3107 | 237/18723 | 4.15e-06 | 6.25e-05 | 67 |
| GO:19040292 | Prostate | BPH | regulation of cyclin-dependent protein kinase activity | 34/3107 | 98/18723 | 1.00e-05 | 1.39e-04 | 34 |
| GO:00511708 | Prostate | BPH | import into nucleus | 48/3107 | 159/18723 | 1.42e-05 | 1.85e-04 | 48 |
| GO:00000792 | Prostate | BPH | regulation of cyclin-dependent protein serine/threonine kinase activity | 32/3107 | 94/18723 | 2.79e-05 | 3.27e-04 | 32 |
| GO:00066068 | Prostate | BPH | protein import into nucleus | 46/3107 | 155/18723 | 3.42e-05 | 3.82e-04 | 46 |
| GO:00457863 | Prostate | BPH | negative regulation of cell cycle | 91/3107 | 385/18723 | 2.10e-04 | 1.71e-03 | 91 |
| Pathway ID | Tissue | Disease Stage | Description | Gene Ratio | Bg Ratio | pvalue | p.adjust | qvalue | Count |
| hsa030137 | Esophagus | HGIN | Nucleocytoplasmic transport | 31/1383 | 108/8465 | 8.29e-04 | 7.95e-03 | 6.31e-03 | 31 |
| hsa0301312 | Esophagus | HGIN | Nucleocytoplasmic transport | 31/1383 | 108/8465 | 8.29e-04 | 7.95e-03 | 6.31e-03 | 31 |
| hsa0301321 | Esophagus | ESCC | Nucleocytoplasmic transport | 89/4205 | 108/8465 | 1.20e-12 | 2.37e-11 | 1.21e-11 | 89 |
| hsa0301331 | Esophagus | ESCC | Nucleocytoplasmic transport | 89/4205 | 108/8465 | 1.20e-12 | 2.37e-11 | 1.21e-11 | 89 |
| hsa03013 | Liver | HCC | Nucleocytoplasmic transport | 81/4020 | 108/8465 | 4.28e-09 | 6.83e-08 | 3.80e-08 | 81 |
| hsa030131 | Liver | HCC | Nucleocytoplasmic transport | 81/4020 | 108/8465 | 4.28e-09 | 6.83e-08 | 3.80e-08 | 81 |
| hsa030136 | Oral cavity | OSCC | Nucleocytoplasmic transport | 82/3704 | 108/8465 | 7.93e-12 | 1.33e-10 | 6.77e-11 | 82 |
| hsa0301311 | Oral cavity | OSCC | Nucleocytoplasmic transport | 82/3704 | 108/8465 | 7.93e-12 | 1.33e-10 | 6.77e-11 | 82 |
| hsa030132 | Oral cavity | LP | Nucleocytoplasmic transport | 53/2418 | 108/8465 | 4.68e-06 | 4.10e-05 | 2.64e-05 | 53 |
| hsa030133 | Oral cavity | LP | Nucleocytoplasmic transport | 53/2418 | 108/8465 | 4.68e-06 | 4.10e-05 | 2.64e-05 | 53 |
| hsa030134 | Oral cavity | EOLP | Nucleocytoplasmic transport | 34/1218 | 108/8465 | 4.24e-06 | 2.91e-05 | 1.72e-05 | 34 |
| hsa030135 | Oral cavity | EOLP | Nucleocytoplasmic transport | 34/1218 | 108/8465 | 4.24e-06 | 2.91e-05 | 1.72e-05 | 34 |
| Hugo Symbol | Variant Class | Variant Classification | dbSNP RS | HGVSc | HGVSp | HGVSp Short | SWISSPROT | BIOTYPE | SIFT | PolyPhen | Tumor Sample Barcode | Tissue | Histology | Sex | Age | Stage | Therapy Types | Drugs | Outcome |
| IPO7 | SNV | Missense_Mutation | rs773555364 | c.2413N>T | p.Arg805Cys | p.R805C | O95373 | protein_coding | deleterious(0.04) | benign(0.006) | TCGA-AN-A046-01 | Breast | breast invasive carcinoma | Female | >=65 | I/II | Unknown | Unknown | SD |
| IPO7 | SNV | Missense_Mutation | | c.2403A>T | p.Leu801Phe | p.L801F | O95373 | protein_coding | deleterious(0) | probably_damaging(0.979) | TCGA-D8-A1X8-01 | Breast | breast invasive carcinoma | Female | <65 | III/IV | Chemotherapy | adrimicin+cyclophosphamide | SD |
| IPO7 | deletion | Frame_Shift_Del | novel | c.788delN | p.Ala264ProfsTer5 | p.A264Pfs*5 | O95373 | protein_coding | | | TCGA-D8-A27V-01 | Breast | breast invasive carcinoma | Female | <65 | I/II | Hormone Therapy | tamoxiphen | SD |
| IPO7 | SNV | Missense_Mutation | | c.2248A>G | p.Lys750Glu | p.K750E | O95373 | protein_coding | deleterious(0.01) | possibly_damaging(0.805) | TCGA-EA-A5FO-01 | Cervix | cervical & endocervical cancer | Female | <65 | I/II | Unknown | Unknown | SD |
| IPO7 | SNV | Missense_Mutation | | c.1564N>G | p.Gln522Glu | p.Q522E | O95373 | protein_coding | deleterious(0) | probably_damaging(0.993) | TCGA-EK-A2R7-01 | Cervix | cervical & endocervical cancer | Female | <65 | I/II | Unknown | Unknown | SD |
| IPO7 | SNV | Missense_Mutation | | c.3044G>T | p.Gly1015Val | p.G1015V | O95373 | protein_coding | deleterious(0) | benign(0.156) | TCGA-IR-A3LA-01 | Cervix | cervical & endocervical cancer | Female | <65 | I/II | Chemotherapy | cisplatin | CR |
| IPO7 | SNV | Missense_Mutation | novel | c.21N>G | p.Ile7Met | p.I7M | O95373 | protein_coding | deleterious(0.01) | possibly_damaging(0.681) | TCGA-MA-AA3Y-01 | Cervix | cervical & endocervical cancer | Female | <65 | I/II | Unknown | Unknown | SD |
| IPO7 | SNV | Missense_Mutation | novel | c.2849N>C | p.Asp950Ala | p.D950A | O95373 | protein_coding | deleterious(0) | probably_damaging(0.994) | TCGA-MA-AA42-01 | Cervix | cervical & endocervical cancer | Female | >=65 | I/II | Unknown | Unknown | SD |
| IPO7 | SNV | Missense_Mutation | | c.1976C>T | p.Ala659Val | p.A659V | O95373 | protein_coding | tolerated(1) | benign(0.042) | TCGA-VS-A9V4-01 | Cervix | cervical & endocervical cancer | Female | <65 | I/II | Chemotherapy | cisplatin | PD |
| IPO7 | SNV | Missense_Mutation | novel | c.2411N>G | p.Leu804Arg | p.L804R | O95373 | protein_coding | deleterious(0) | possibly_damaging(0.786) | TCGA-A6-3808-01 | Colorectum | colon adenocarcinoma | Male | >=65 | I/II | Unknown | Unknown | SD |


