
|
|||||
|
 | |
| |
| |
| |
| |
| |
|
Gene: HSD17B4 |
Gene summary for HSD17B4 |
| Gene information | Species | Human | Gene symbol | HSD17B4 | Gene ID | 3295 |
| Gene name | hydroxysteroid 17-beta dehydrogenase 4 | |
| Gene Alias | DBP | |
| Cytomap | 5q23.1 | |
| Gene Type | protein-coding | GO ID | GO:0000003 | UniProtAcc | A0A0S2Z4J1 |
Top |
Malignant transformation analysis |
| Identification of the aberrant gene expression in precancerous and cancerous lesions by comparing the gene expression of stem-like cells in diseased tissues with normal stem cells |
| Entrez ID | Symbol | Replicates | Species | Organ | Tissue | Adj P-value | Log2FC | Malignancy |
| 3295 | HSD17B4 | HTA11_3410_2000001011 | Human | Colorectum | AD | 2.22e-03 | -1.63e-01 | 0.0155 |
| 3295 | HSD17B4 | A002-C-010 | Human | Colorectum | FAP | 3.50e-02 | -1.46e-01 | 0.242 |
| 3295 | HSD17B4 | A015-C-203 | Human | Colorectum | FAP | 1.05e-21 | -3.48e-01 | -0.1294 |
| 3295 | HSD17B4 | A015-C-204 | Human | Colorectum | FAP | 1.85e-03 | -3.21e-01 | -0.0228 |
| 3295 | HSD17B4 | A014-C-040 | Human | Colorectum | FAP | 1.14e-02 | -4.26e-01 | -0.1184 |
| 3295 | HSD17B4 | A002-C-201 | Human | Colorectum | FAP | 1.89e-09 | -4.16e-01 | 0.0324 |
| 3295 | HSD17B4 | A002-C-203 | Human | Colorectum | FAP | 3.37e-04 | -2.03e-01 | 0.2786 |
| 3295 | HSD17B4 | A001-C-119 | Human | Colorectum | FAP | 8.72e-06 | -4.27e-01 | -0.1557 |
| 3295 | HSD17B4 | A001-C-108 | Human | Colorectum | FAP | 8.64e-14 | -2.80e-01 | -0.0272 |
| 3295 | HSD17B4 | A002-C-205 | Human | Colorectum | FAP | 1.32e-17 | -4.64e-01 | -0.1236 |
| 3295 | HSD17B4 | A001-C-104 | Human | Colorectum | FAP | 9.69e-04 | -1.30e-01 | 0.0184 |
| 3295 | HSD17B4 | A015-C-005 | Human | Colorectum | FAP | 1.71e-02 | -2.46e-01 | -0.0336 |
| 3295 | HSD17B4 | A015-C-006 | Human | Colorectum | FAP | 4.58e-12 | -4.31e-01 | -0.0994 |
| 3295 | HSD17B4 | A015-C-106 | Human | Colorectum | FAP | 1.35e-10 | -2.75e-01 | -0.0511 |
| 3295 | HSD17B4 | A002-C-114 | Human | Colorectum | FAP | 4.40e-11 | -3.77e-01 | -0.1561 |
| 3295 | HSD17B4 | A015-C-104 | Human | Colorectum | FAP | 1.31e-24 | -3.61e-01 | -0.1899 |
| 3295 | HSD17B4 | A001-C-014 | Human | Colorectum | FAP | 1.81e-14 | -3.40e-01 | 0.0135 |
| 3295 | HSD17B4 | A002-C-016 | Human | Colorectum | FAP | 8.34e-20 | -3.86e-01 | 0.0521 |
| 3295 | HSD17B4 | A015-C-002 | Human | Colorectum | FAP | 8.75e-09 | -4.14e-01 | -0.0763 |
| 3295 | HSD17B4 | A001-C-203 | Human | Colorectum | FAP | 4.21e-11 | -2.50e-01 | -0.0481 |
| Page: 1 2 3 4 5 6 7 8 |
| Tissue | Expression Dynamics | Abbreviation |
| Colorectum (GSE201348) |  | FAP: Familial adenomatous polyposis |
| CRC: Colorectal cancer | ||
| Colorectum (HTA11) |  | AD: Adenomas |
| SER: Sessile serrated lesions | ||
| MSI-H: Microsatellite-high colorectal cancer | ||
| MSS: Microsatellite stable colorectal cancer | ||
| Esophagus | 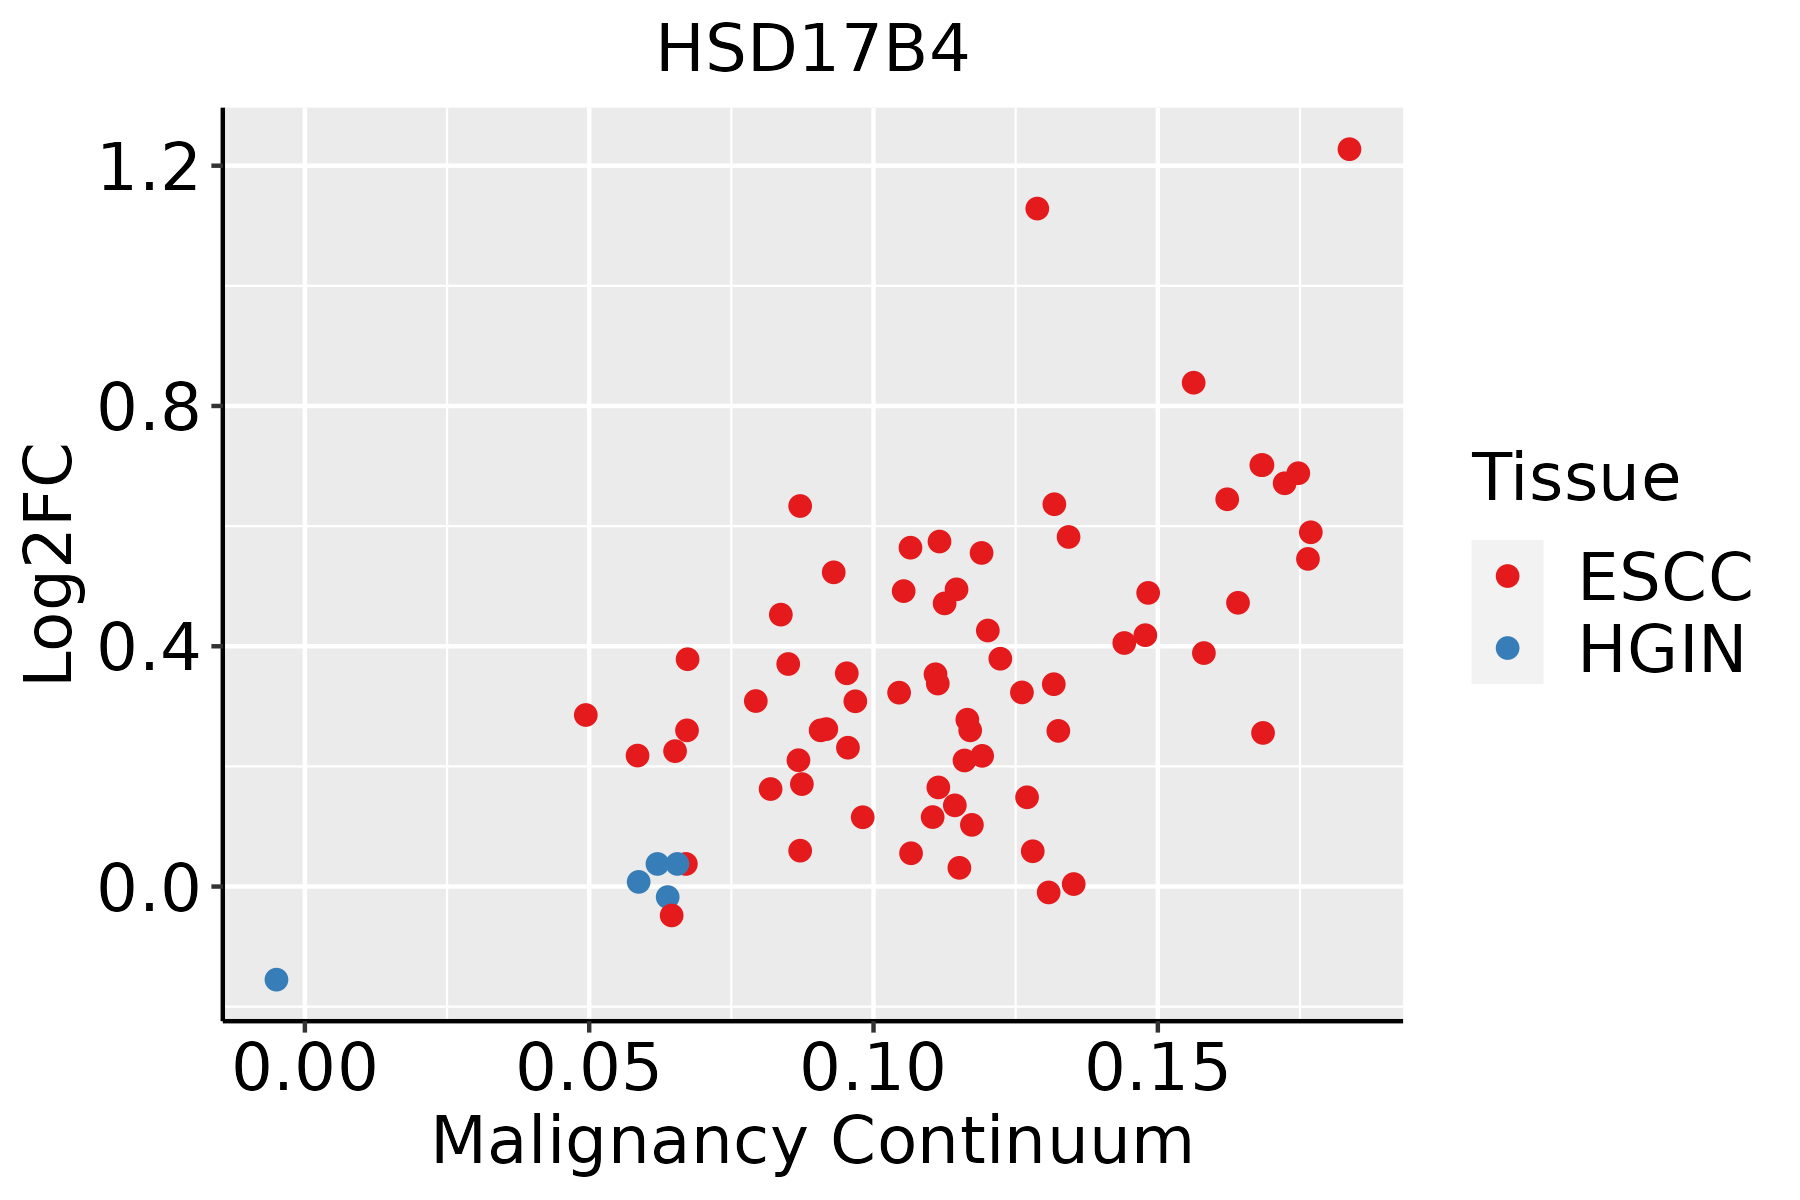 | ESCC: Esophageal squamous cell carcinoma |
| HGIN: High-grade intraepithelial neoplasias | ||
| LGIN: Low-grade intraepithelial neoplasias | ||
| Liver |  | HCC: Hepatocellular carcinoma |
| NAFLD: Non-alcoholic fatty liver disease | ||
| Oral Cavity | 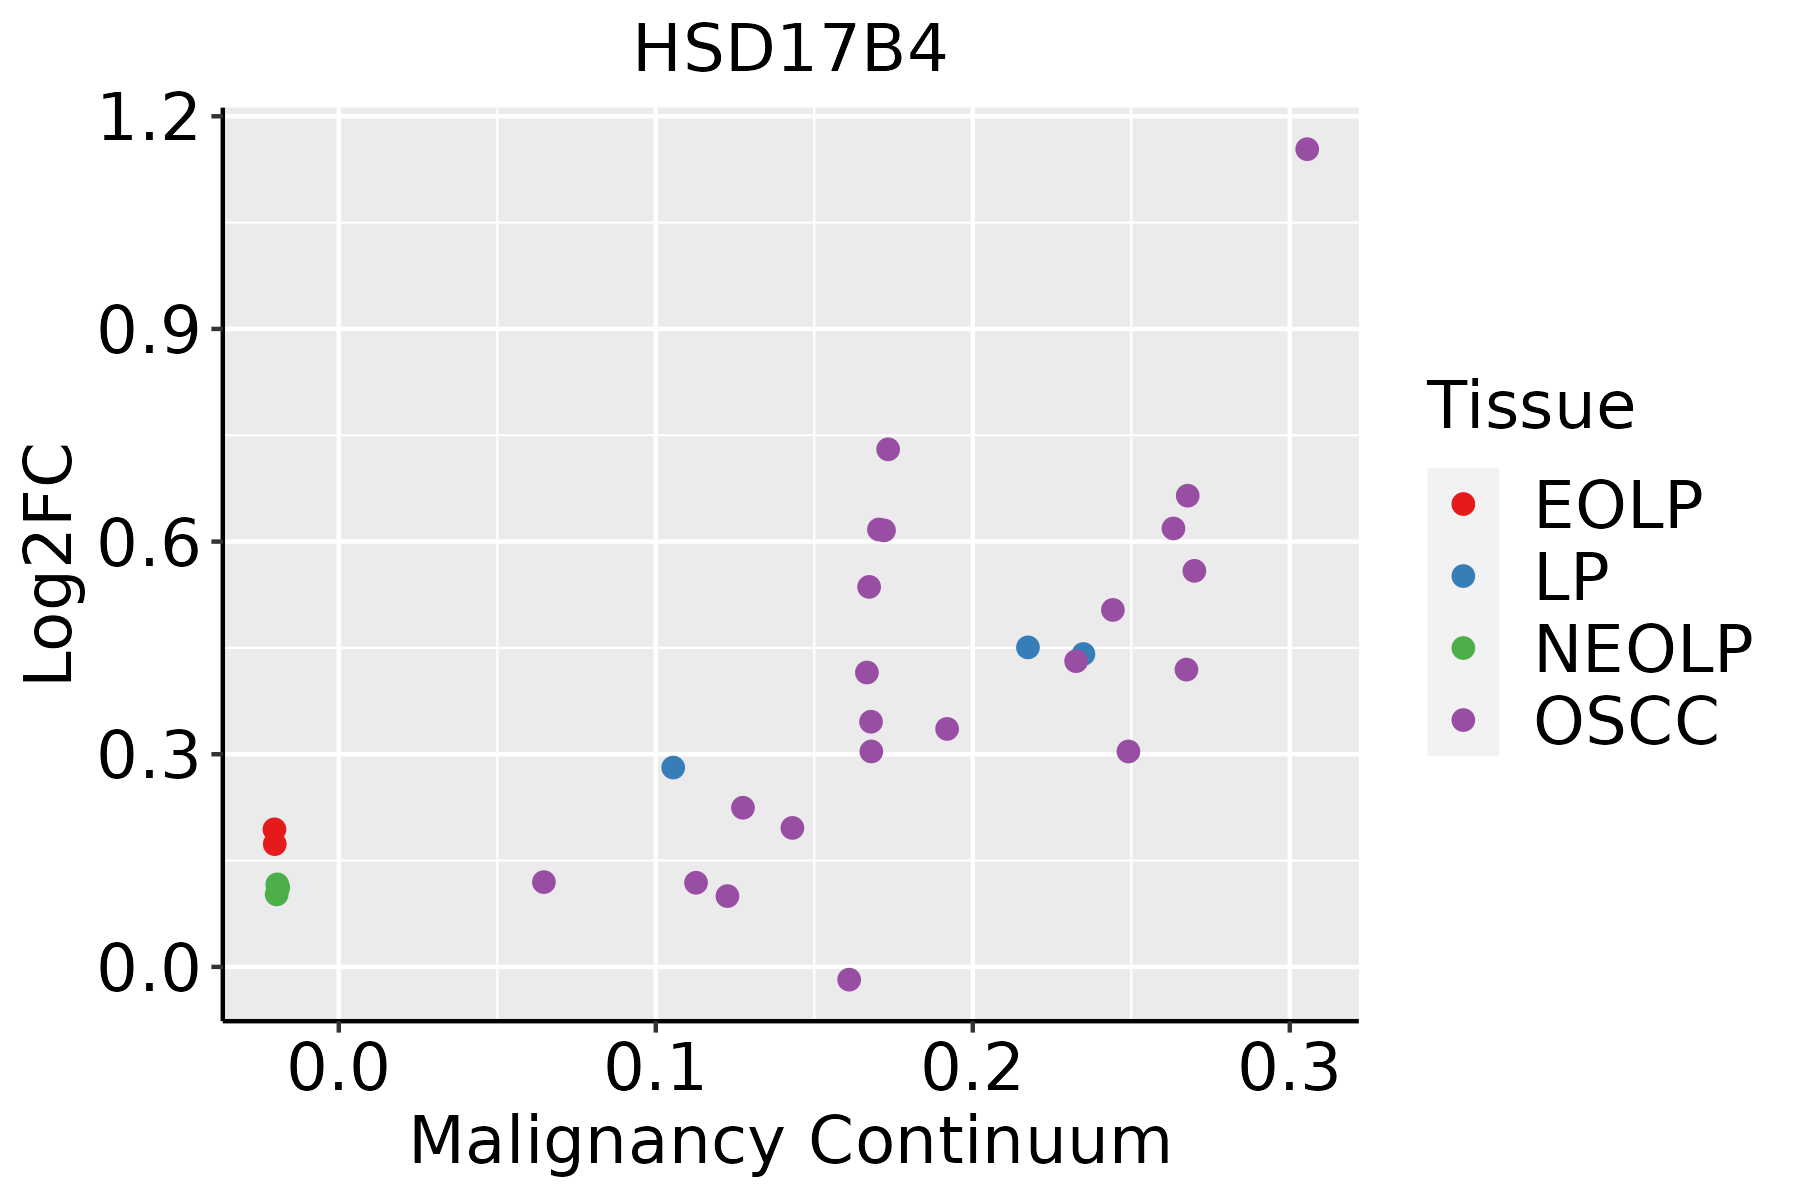 | EOLP: Erosive Oral lichen planus |
| LP: leukoplakia | ||
| NEOLP: Non-erosive oral lichen planus | ||
| OSCC: Oral squamous cell carcinoma | ||
| Prostate | 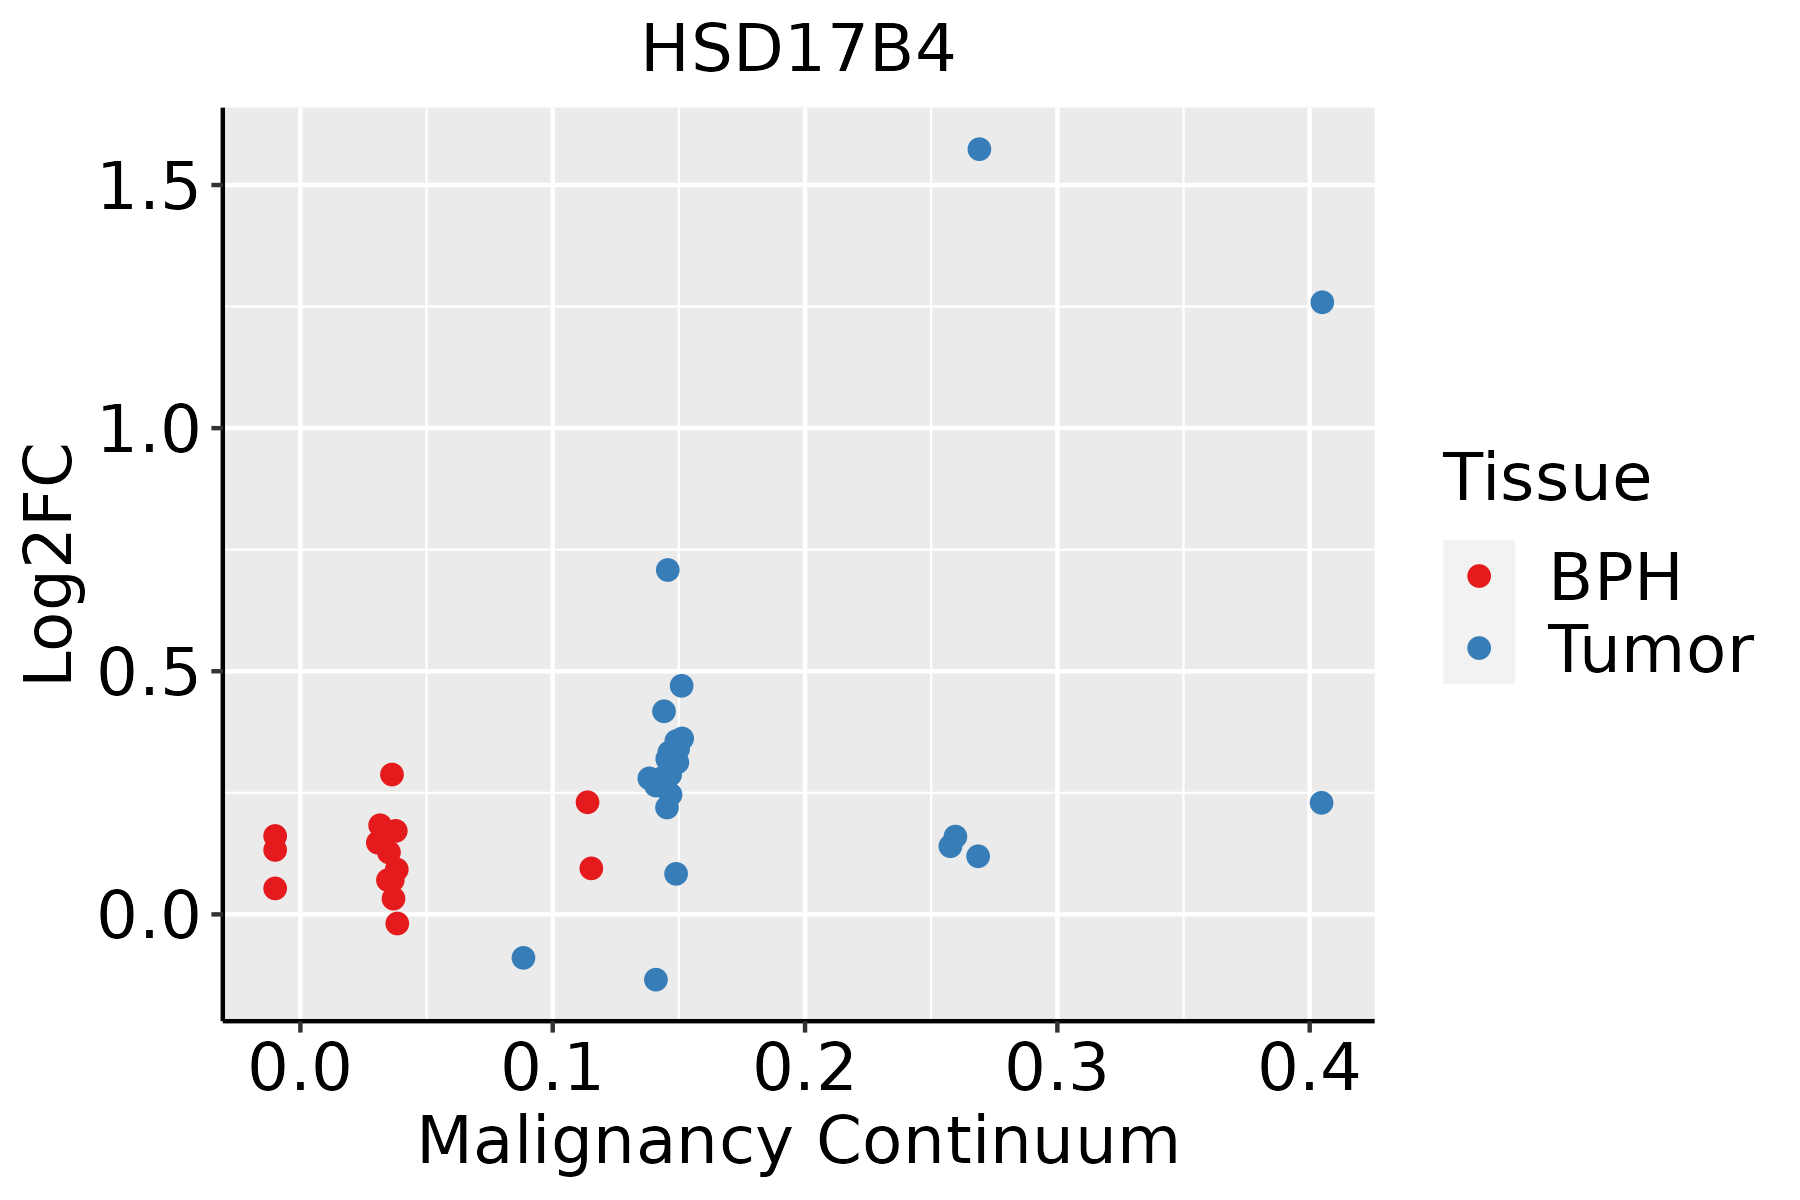 | BPH: Benign Prostatic Hyperplasia |
| Skin |  | AK: Actinic keratosis |
| cSCC: Cutaneous squamous cell carcinoma | ||
| SCCIS:squamous cell carcinoma in situ | ||
| Thyroid |  | ATC: Anaplastic thyroid cancer |
| HT: Hashimoto's thyroiditis | ||
| PTC: Papillary thyroid cancer |
| ∗log2FC in expression of this searched gene in stem-like cells from each diseased tissue sample relative to stem-like cells in normal samples in each tissue plotted against the malignancy continuum. Samples are colored based on if they are from different disease stage. |
Top |
Malignant transformation related pathway analysis |
| Find out the enriched GO biological processes and KEGG pathways involved in transition from healthy to precancer to cancer |
| Tissue | Disease Stage | Enriched GO biological Processes |
| Colorectum | AD |  |
| Colorectum | SER |  |
| Colorectum | MSS |  |
| Colorectum | MSI-H |  |
| Colorectum | FAP |  |
| ∗Top 15 enriched GO BP terms are showed in the bar plot of each disease state in each tissue. Each row represents a significant GO biological process which is colored according to the -log10(p.adjust). |
| Page: 1 2 3 4 5 6 7 8 9 |
| GO ID | Tissue | Disease Stage | Description | Gene Ratio | Bg Ratio | pvalue | p.adjust | Count |
| GO:00725217 | Liver | NAFLD | purine-containing compound metabolic process | 74/1882 | 416/18723 | 7.73e-07 | 4.27e-05 | 74 |
| GO:00091507 | Liver | NAFLD | purine ribonucleotide metabolic process | 67/1882 | 368/18723 | 1.10e-06 | 5.44e-05 | 67 |
| GO:00061637 | Liver | NAFLD | purine nucleotide metabolic process | 70/1882 | 396/18723 | 1.93e-06 | 8.23e-05 | 70 |
| GO:00067904 | Liver | NAFLD | sulfur compound metabolic process | 58/1882 | 339/18723 | 3.79e-05 | 9.38e-04 | 58 |
| GO:00338653 | Liver | NAFLD | nucleoside bisphosphate metabolic process | 28/1882 | 128/18723 | 5.89e-05 | 1.30e-03 | 28 |
| GO:00338753 | Liver | NAFLD | ribonucleoside bisphosphate metabolic process | 28/1882 | 128/18723 | 5.89e-05 | 1.30e-03 | 28 |
| GO:00340323 | Liver | NAFLD | purine nucleoside bisphosphate metabolic process | 28/1882 | 128/18723 | 5.89e-05 | 1.30e-03 | 28 |
| GO:00020647 | Liver | NAFLD | epithelial cell development | 41/1882 | 220/18723 | 7.39e-05 | 1.53e-03 | 41 |
| GO:0006637 | Liver | NAFLD | acyl-CoA metabolic process | 21/1882 | 96/18723 | 4.72e-04 | 6.74e-03 | 21 |
| GO:0035383 | Liver | NAFLD | thioester metabolic process | 21/1882 | 96/18723 | 4.72e-04 | 6.74e-03 | 21 |
| GO:00424452 | Liver | NAFLD | hormone metabolic process | 36/1882 | 218/18723 | 1.98e-03 | 1.98e-02 | 36 |
| GO:0008210 | Liver | NAFLD | estrogen metabolic process | 10/1882 | 38/18723 | 3.49e-03 | 3.00e-02 | 10 |
| GO:00600092 | Liver | NAFLD | Sertoli cell development | 5/1882 | 12/18723 | 4.41e-03 | 3.57e-02 | 5 |
| GO:000820211 | Liver | Cirrhotic | steroid metabolic process | 143/4634 | 319/18723 | 2.79e-15 | 3.18e-13 | 143 |
| GO:000663112 | Liver | Cirrhotic | fatty acid metabolic process | 165/4634 | 390/18723 | 1.29e-14 | 1.26e-12 | 165 |
| GO:000675312 | Liver | Cirrhotic | nucleoside phosphate metabolic process | 190/4634 | 497/18723 | 1.10e-11 | 6.96e-10 | 190 |
| GO:000911712 | Liver | Cirrhotic | nucleotide metabolic process | 187/4634 | 489/18723 | 1.55e-11 | 9.63e-10 | 187 |
| GO:004428211 | Liver | Cirrhotic | small molecule catabolic process | 151/4634 | 376/18723 | 2.20e-11 | 1.34e-09 | 151 |
| GO:001969312 | Liver | Cirrhotic | ribose phosphate metabolic process | 156/4634 | 396/18723 | 5.83e-11 | 3.23e-09 | 156 |
| GO:000925912 | Liver | Cirrhotic | ribonucleotide metabolic process | 151/4634 | 385/18723 | 1.72e-10 | 8.70e-09 | 151 |
| Page: 1 2 3 4 5 6 7 8 9 10 11 12 13 14 15 16 17 |
| Pathway ID | Tissue | Disease Stage | Description | Gene Ratio | Bg Ratio | pvalue | p.adjust | qvalue | Count |
| hsa01212 | Colorectum | CRC | Fatty acid metabolism | 14/1091 | 57/8465 | 1.17e-02 | 4.99e-02 | 3.38e-02 | 14 |
| hsa012121 | Colorectum | CRC | Fatty acid metabolism | 14/1091 | 57/8465 | 1.17e-02 | 4.99e-02 | 3.38e-02 | 14 |
| hsa012129 | Esophagus | ESCC | Fatty acid metabolism | 41/4205 | 57/8465 | 5.13e-04 | 1.75e-03 | 8.98e-04 | 41 |
| hsa041467 | Esophagus | ESCC | Peroxisome | 55/4205 | 82/8465 | 1.04e-03 | 3.27e-03 | 1.68e-03 | 55 |
| hsa0121214 | Esophagus | ESCC | Fatty acid metabolism | 41/4205 | 57/8465 | 5.13e-04 | 1.75e-03 | 8.98e-04 | 41 |
| hsa0414612 | Esophagus | ESCC | Peroxisome | 55/4205 | 82/8465 | 1.04e-03 | 3.27e-03 | 1.68e-03 | 55 |
| hsa00120 | Liver | NAFLD | Primary bile acid biosynthesis | 9/1043 | 17/8465 | 6.10e-05 | 1.33e-03 | 1.07e-03 | 9 |
| hsa012126 | Liver | NAFLD | Fatty acid metabolism | 17/1043 | 57/8465 | 3.43e-04 | 5.93e-03 | 4.78e-03 | 17 |
| hsa04146 | Liver | NAFLD | Peroxisome | 19/1043 | 82/8465 | 4.37e-03 | 4.10e-02 | 3.30e-02 | 19 |
| hsa001201 | Liver | NAFLD | Primary bile acid biosynthesis | 9/1043 | 17/8465 | 6.10e-05 | 1.33e-03 | 1.07e-03 | 9 |
| hsa0121211 | Liver | NAFLD | Fatty acid metabolism | 17/1043 | 57/8465 | 3.43e-04 | 5.93e-03 | 4.78e-03 | 17 |
| hsa041461 | Liver | NAFLD | Peroxisome | 19/1043 | 82/8465 | 4.37e-03 | 4.10e-02 | 3.30e-02 | 19 |
| hsa012122 | Liver | Cirrhotic | Fatty acid metabolism | 32/2530 | 57/8465 | 3.12e-05 | 2.47e-04 | 1.52e-04 | 32 |
| hsa041462 | Liver | Cirrhotic | Peroxisome | 36/2530 | 82/8465 | 4.79e-03 | 1.74e-02 | 1.07e-02 | 36 |
| hsa01040 | Liver | Cirrhotic | Biosynthesis of unsaturated fatty acids | 14/2530 | 27/8465 | 1.36e-02 | 4.25e-02 | 2.62e-02 | 14 |
| hsa012123 | Liver | Cirrhotic | Fatty acid metabolism | 32/2530 | 57/8465 | 3.12e-05 | 2.47e-04 | 1.52e-04 | 32 |
| hsa041463 | Liver | Cirrhotic | Peroxisome | 36/2530 | 82/8465 | 4.79e-03 | 1.74e-02 | 1.07e-02 | 36 |
| hsa010401 | Liver | Cirrhotic | Biosynthesis of unsaturated fatty acids | 14/2530 | 27/8465 | 1.36e-02 | 4.25e-02 | 2.62e-02 | 14 |
| hsa012124 | Liver | HCC | Fatty acid metabolism | 45/4020 | 57/8465 | 1.05e-06 | 1.10e-05 | 6.09e-06 | 45 |
| hsa041464 | Liver | HCC | Peroxisome | 58/4020 | 82/8465 | 1.57e-05 | 1.05e-04 | 5.85e-05 | 58 |
| Page: 1 2 |
Top |
Cell-cell communication analysis |
| Identification of potential cell-cell interactions between two cell types and their ligand-receptor pairs for different disease states |
| Ligand | Receptor | LRpair | Pathway | Tissue | Disease Stage |
| Page: 1 |
Top |
Single-cell gene regulatory network inference analysis |
| Find out the significant the regulons (TFs) and the target genes of each regulon across cell types for different disease states |
| TF | Cell Type | Tissue | Disease Stage | Target Gene | RSS | Regulon Activity |
| ∗The dot plots of a searched regulon are shown for all cell subpopulations in each disease state of each tissue based on the regulon specific score inferred using pySCENIC and by calculating the average expression. |
| Page: 1 |
Top |
Somatic mutation of malignant transformation related genes |
| Annotation of somatic variants for genes involved in malignant transformation |
| Hugo Symbol | Variant Class | Variant Classification | dbSNP RS | HGVSc | HGVSp | HGVSp Short | SWISSPROT | BIOTYPE | SIFT | PolyPhen | Tumor Sample Barcode | Tissue | Histology | Sex | Age | Stage | Therapy Types | Drugs | Outcome |
| HSD17B4 | SNV | Missense_Mutation | c.736C>G | p.Leu246Val | p.L246V | P51659 | protein_coding | tolerated(0.36) | benign(0.166) | TCGA-A2-A0T0-01 | Breast | breast invasive carcinoma | Female | <65 | I/II | Chemotherapy | taxotere | SD | |
| HSD17B4 | SNV | Missense_Mutation | novel | c.1919C>G | p.Thr640Arg | p.T640R | P51659 | protein_coding | tolerated(0.34) | benign(0.006) | TCGA-AC-A5EH-01 | Breast | breast invasive carcinoma | Female | >=65 | I/II | Unknown | Unknown | SD |
| HSD17B4 | SNV | Missense_Mutation | c.1783G>A | p.Gly595Arg | p.G595R | P51659 | protein_coding | deleterious(0) | probably_damaging(0.999) | TCGA-BH-A0AV-01 | Breast | breast invasive carcinoma | Female | <65 | I/II | Chemotherapy | taxotere | CR | |
| HSD17B4 | SNV | Missense_Mutation | c.1147N>G | p.Pro383Ala | p.P383A | P51659 | protein_coding | deleterious(0.05) | benign(0.071) | TCGA-BH-A0AW-01 | Breast | breast invasive carcinoma | Female | <65 | I/II | Chemotherapy | carboplatin | SD | |
| HSD17B4 | SNV | Missense_Mutation | c.1066A>G | p.Lys356Glu | p.K356E | P51659 | protein_coding | tolerated(0.33) | benign(0.024) | TCGA-D8-A1Y1-01 | Breast | breast invasive carcinoma | Female | >=65 | III/IV | Hormone Therapy | tamoxiphen | PD | |
| HSD17B4 | SNV | Missense_Mutation | c.662N>G | p.Ala221Gly | p.A221G | P51659 | protein_coding | deleterious(0) | probably_damaging(0.973) | TCGA-E9-A22G-01 | Breast | breast invasive carcinoma | Female | <65 | I/II | Chemotherapy | doxorubicin | SD | |
| HSD17B4 | SNV | Missense_Mutation | c.1268N>T | p.Ser423Leu | p.S423L | P51659 | protein_coding | deleterious(0.05) | benign(0.109) | TCGA-GM-A2D9-01 | Breast | breast invasive carcinoma | Female | >=65 | I/II | Hormone Therapy | arimidex | SD | |
| HSD17B4 | deletion | Frame_Shift_Del | c.1648delN | p.Gly550ValfsTer107 | p.G550Vfs*107 | P51659 | protein_coding | TCGA-AN-A0XP-01 | Breast | breast invasive carcinoma | Female | >=65 | III/IV | Unknown | Unknown | SD | |||
| HSD17B4 | insertion | Frame_Shift_Ins | novel | c.1744_1745insGATTATGGTGGAGGGAAGTTCCCGCTAGTGCGAGGTCT | p.Lys582ArgfsTer88 | p.K582Rfs*88 | P51659 | protein_coding | TCGA-AR-A0TY-01 | Breast | breast invasive carcinoma | Female | <65 | I/II | Unspecific | Paclitaxel | PD | ||
| HSD17B4 | deletion | Frame_Shift_Del | novel | c.922delN | p.Ser308AlafsTer13 | p.S308Afs*13 | P51659 | protein_coding | TCGA-EW-A2FV-01 | Breast | breast invasive carcinoma | Female | <65 | III/IV | Chemotherapy | docetaxel | SD |
| Page: 1 2 3 4 5 6 7 8 9 |
Top |
Related drugs of malignant transformation related genes |
| Identification of chemicals and drugs interact with genes involved in malignant transfromation |
| (DGIdb 4.0) |
| Entrez ID | Symbol | Category | Interaction Types | Drug Claim Name | Drug Name | PMIDs |
| Page: 1 |

Copyright 2023-Present -The University of Texas Health Science Center at Houston |