Schematic overview of the cellular and molecular mechanisms involved in the cancer progression, including the proposed cellular and molecular mechanisms in cancer cells trajectory. AT1: alveolar type 1 cells; AT2: alveolar type 2 cells; AAH: atypical adenomatous hyperplasia; AIS: adenocarcinoma in situ; MIA: minimally invasive adenocarcinoma; IA: invasive adenocarcinoma; EMT: epithelial-mesenchymal transition

Home

Download

Statistics

Help

Contact

Center for Computational Systems Medicine
leaf

Gene summary

leaf

Malignant transformation analysis

leaf

Malignant transformation related pathway analysis

leaf

Cell-cell communication analysis

leaf

Single-cell gene regulatory network inference analysis

leaf

Somatic mutation of malignant transformation related genes

leaf

Related drugs of malignant transformation related genes

Gene: HM13

Gene summary for HM13

check button Gene summary.

Gene informationSpeciesHuman
Gene symbol

HM13

Gene ID

81502

Gene namehistocompatibility minor 13
Gene AliasH13
Cytomap20q11.21
Gene Typeprotein-coding
GO ID

GO:0001701

UniProtAcc

A0A0S2Z5V7


Top

Malignant transformation analysis

check button Identification of the aberrant gene expression in precancerous and cancerous lesions by comparing the gene expression of stem-like cells in diseased tissues with normal stem cells
check button Malignant transformation involving gene list.
Entrez IDSymbolReplicatesSpeciesOrganTissueAdj P-valueLog2FCMalignancy
81502HM13CA_HPV_1HumanCervixCC6.82e-034.81e-030.0264
81502HM13N_HPV_1HumanCervixN_HPV6.05e-03-1.26e-010.0079
81502HM13N_HPV_2HumanCervixN_HPV4.43e-021.23e-01-0.0131
81502HM13TumorHumanCervixCC1.24e-104.55e-010.1241
81502HM13sample3HumanCervixCC4.45e-275.27e-010.1387
81502HM13T3HumanCervixCC8.24e-195.31e-010.1389
81502HM13HTA11_2487_2000001011HumanColorectumSER2.22e-075.95e-01-0.1808
81502HM13HTA11_1938_2000001011HumanColorectumAD3.75e-024.44e-01-0.0811
81502HM13HTA11_347_2000001011HumanColorectumAD1.33e-104.14e-01-0.1954
81502HM13HTA11_411_2000001011HumanColorectumSER2.10e-048.80e-01-0.2602
81502HM13HTA11_2112_2000001011HumanColorectumSER3.78e-037.83e-01-0.2196
81502HM13HTA11_83_2000001011HumanColorectumSER6.00e-034.74e-01-0.1526
81502HM13HTA11_696_2000001011HumanColorectumAD5.74e-146.72e-01-0.1464
81502HM13HTA11_866_2000001011HumanColorectumAD3.92e-033.53e-01-0.1001
81502HM13HTA11_1391_2000001011HumanColorectumAD1.55e-199.76e-01-0.059
81502HM13HTA11_866_3004761011HumanColorectumAD2.37e-115.45e-010.096
81502HM13HTA11_10711_2000001011HumanColorectumAD2.14e-064.80e-010.0338
81502HM13HTA11_7696_3000711011HumanColorectumAD2.29e-095.51e-010.0674
81502HM13HTA11_6818_2000001021HumanColorectumAD4.48e-033.96e-010.0588
81502HM13HTA11_99999970781_79442HumanColorectumMSS5.61e-043.57e-010.294
Page: 1 2 3 4 5 6 7 8 9 10 

check button Transcriptomic changes along malignancy continuum.
TissueExpression DynamicsAbbreviation
CervixThe image shows the transcriptomic changes along malignancy continuum.log2FC in expression of this searched gene in stem-like cells from each diseased tissue sample relative to stem-like cells in normal samples in each tissue plotted against the malignancy continuum. Samples are colored based on if they are from different disease stage.CC: Cervix cancer
HSIL_HPV: HPV-infected high-grade squamous intraepithelial lesions
N_HPV: HPV-infected normal cervix
Colorectum (GSE201348)The image shows the transcriptomic changes along malignancy continuum.log2FC in expression of this searched gene in stem-like cells from each diseased tissue sample relative to stem-like cells in normal samples in each tissue plotted against the malignancy continuum. Samples are colored based on if they are from different disease stage.FAP: Familial adenomatous polyposis
CRC: Colorectal cancer
Colorectum (HTA11)The image shows the transcriptomic changes along malignancy continuum.log2FC in expression of this searched gene in stem-like cells from each diseased tissue sample relative to stem-like cells in normal samples in each tissue plotted against the malignancy continuum. Samples are colored based on if they are from different disease stage.AD: Adenomas
SER: Sessile serrated lesions
MSI-H: Microsatellite-high colorectal cancer
MSS: Microsatellite stable colorectal cancer
EndometriumThe image shows the transcriptomic changes along malignancy continuum.log2FC in expression of this searched gene in stem-like cells from each diseased tissue sample relative to stem-like cells in normal samples in each tissue plotted against the malignancy continuum. Samples are colored based on if they are from different disease stage.
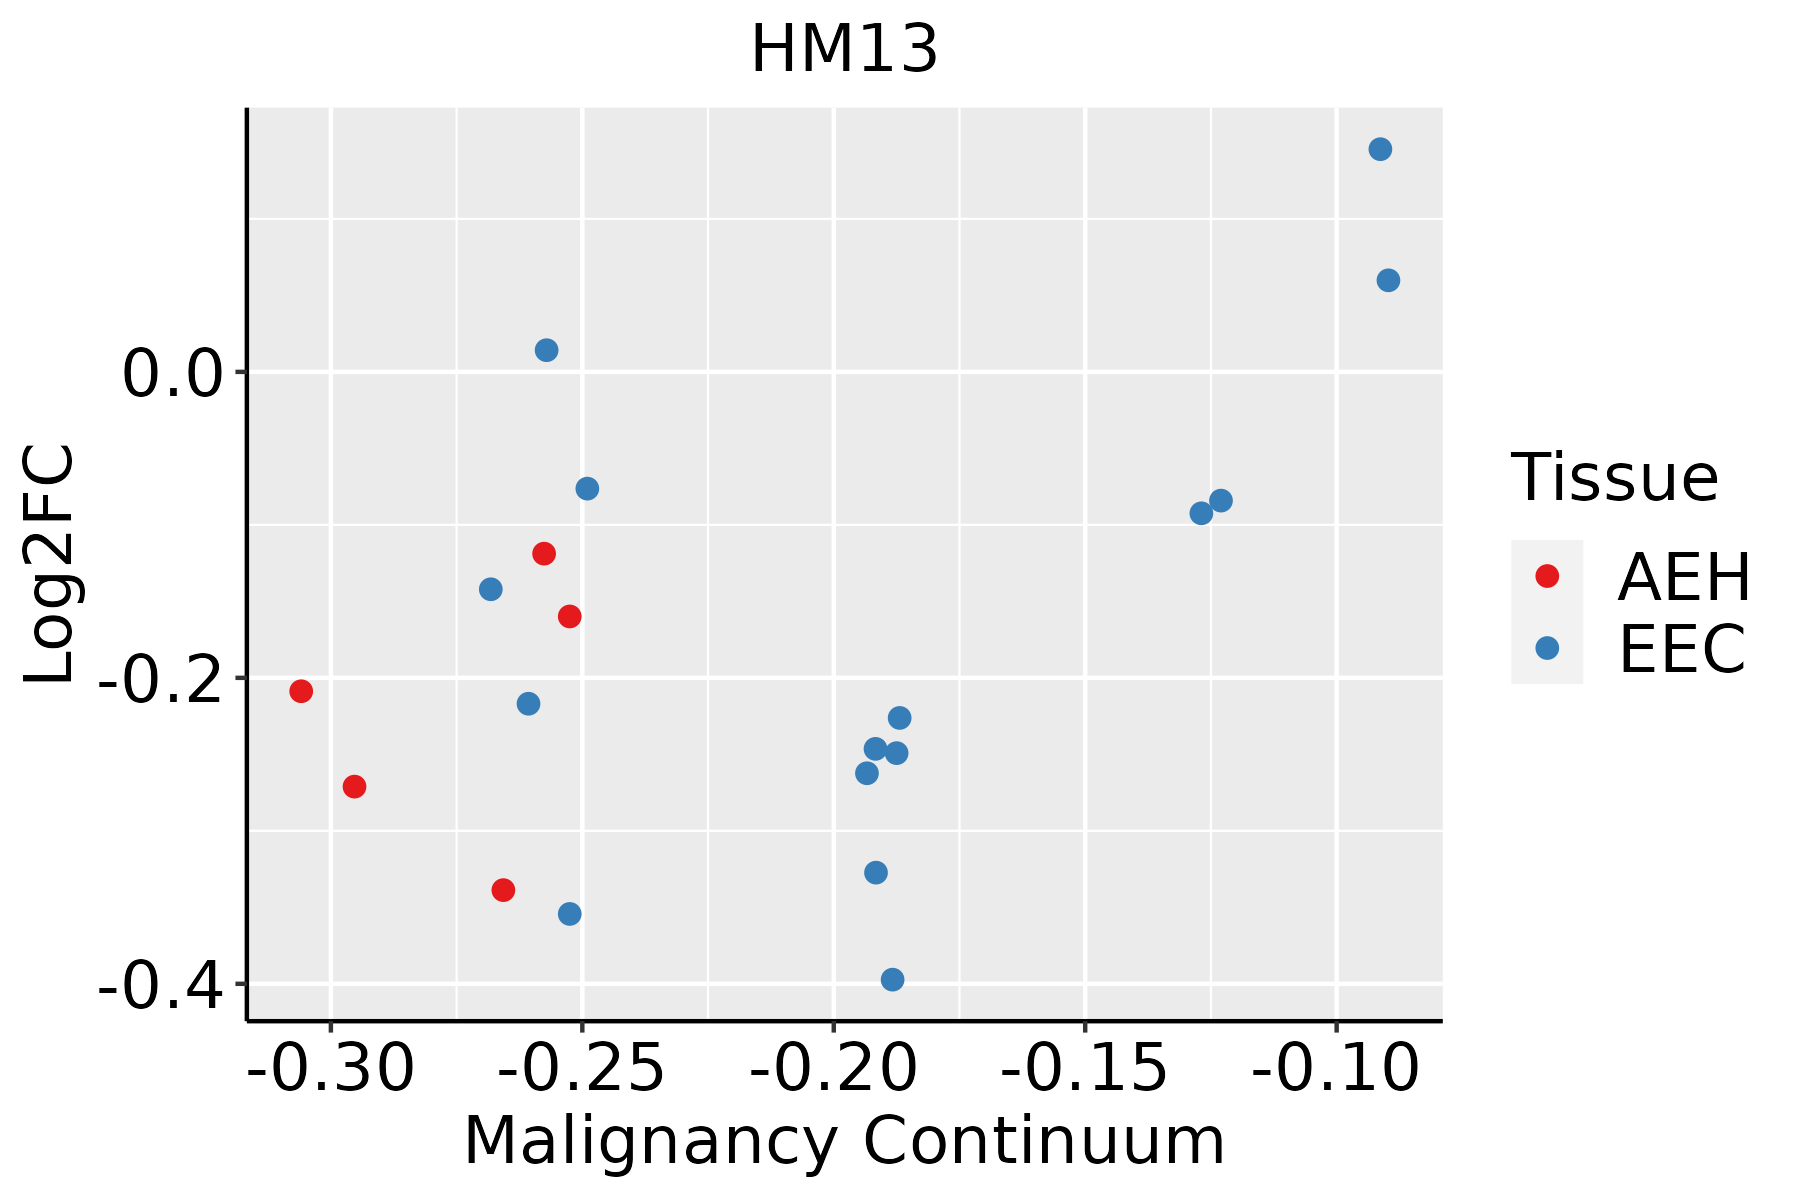
AEH: Atypical endometrial hyperplasia
EEC: Endometrioid Cancer
EsophagusThe image shows the transcriptomic changes along malignancy continuum.log2FC in expression of this searched gene in stem-like cells from each diseased tissue sample relative to stem-like cells in normal samples in each tissue plotted against the malignancy continuum. Samples are colored based on if they are from different disease stage.
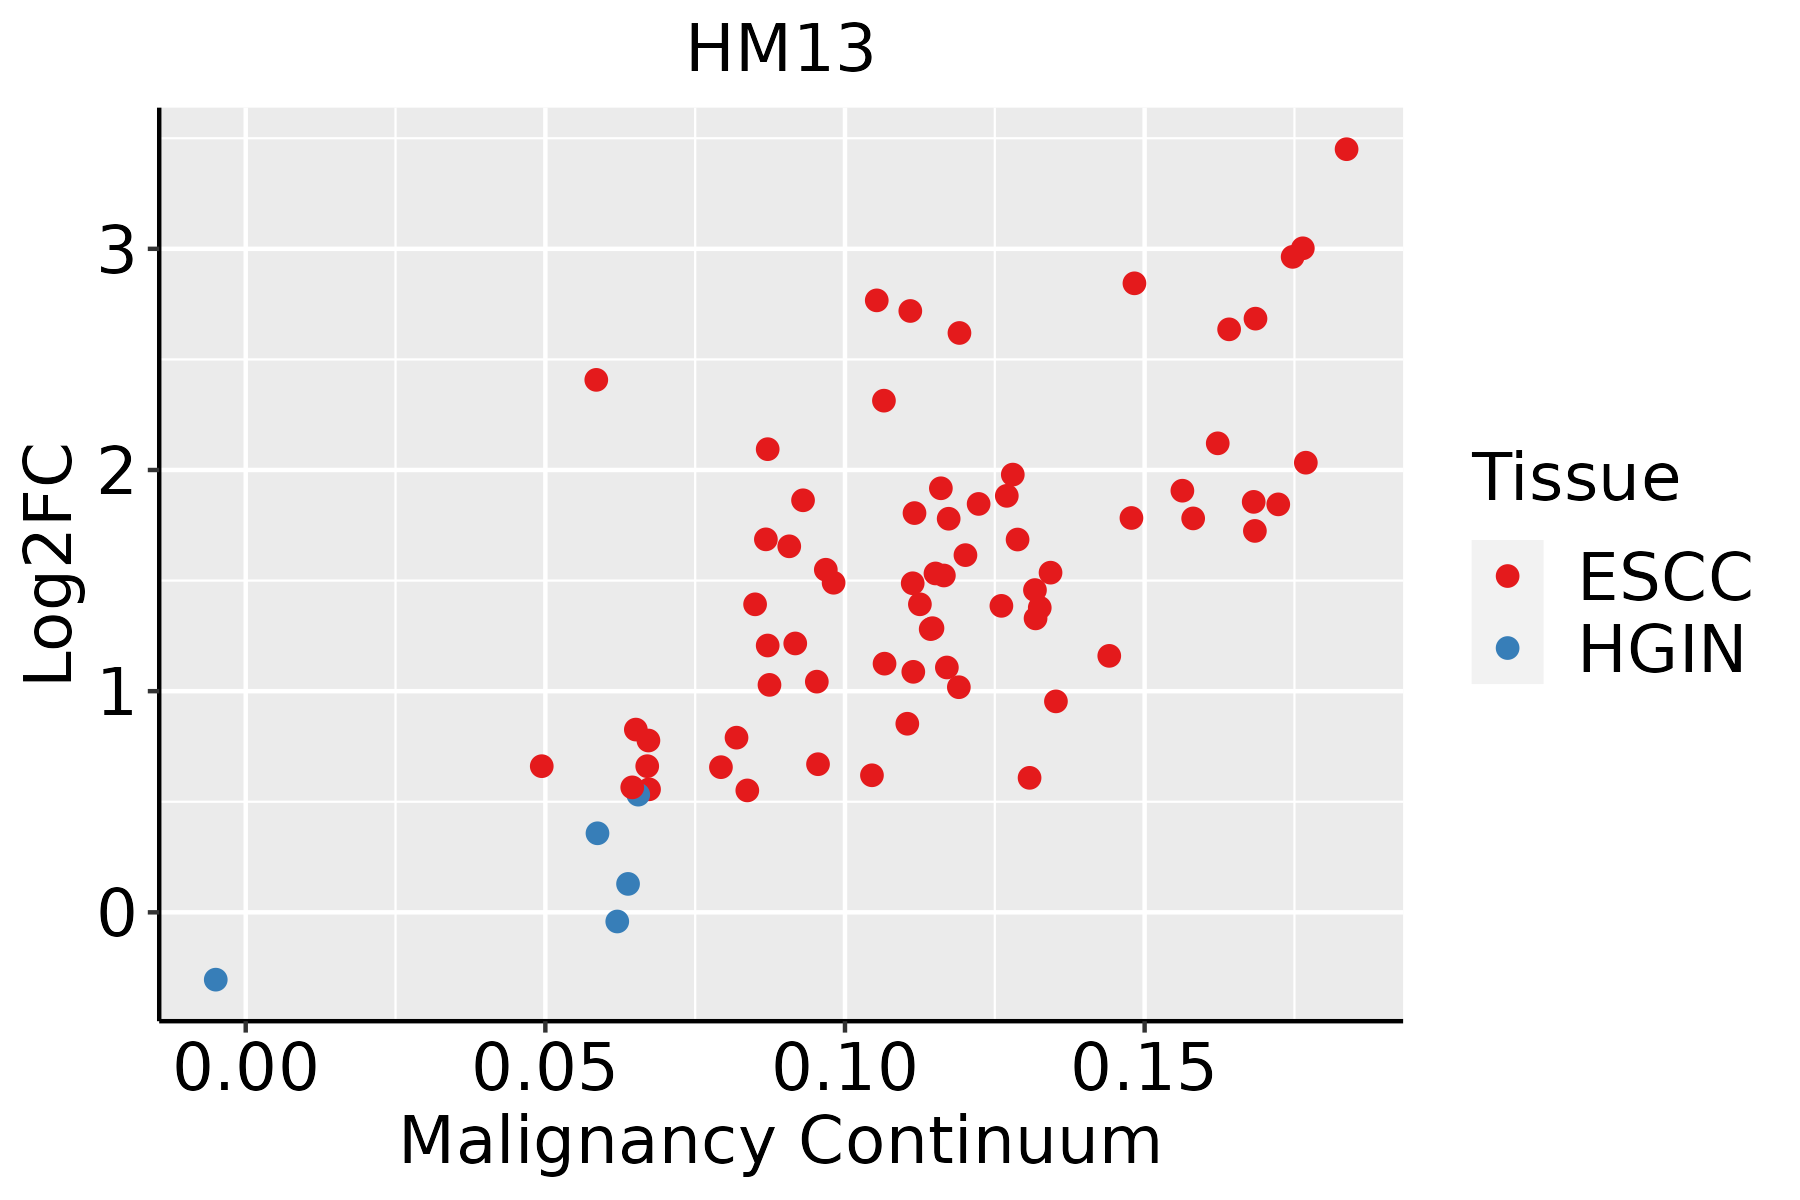
ESCC: Esophageal squamous cell carcinoma
HGIN: High-grade intraepithelial neoplasias
LGIN: Low-grade intraepithelial neoplasias
LiverThe image shows the transcriptomic changes along malignancy continuum.log2FC in expression of this searched gene in stem-like cells from each diseased tissue sample relative to stem-like cells in normal samples in each tissue plotted against the malignancy continuum. Samples are colored based on if they are from different disease stage.
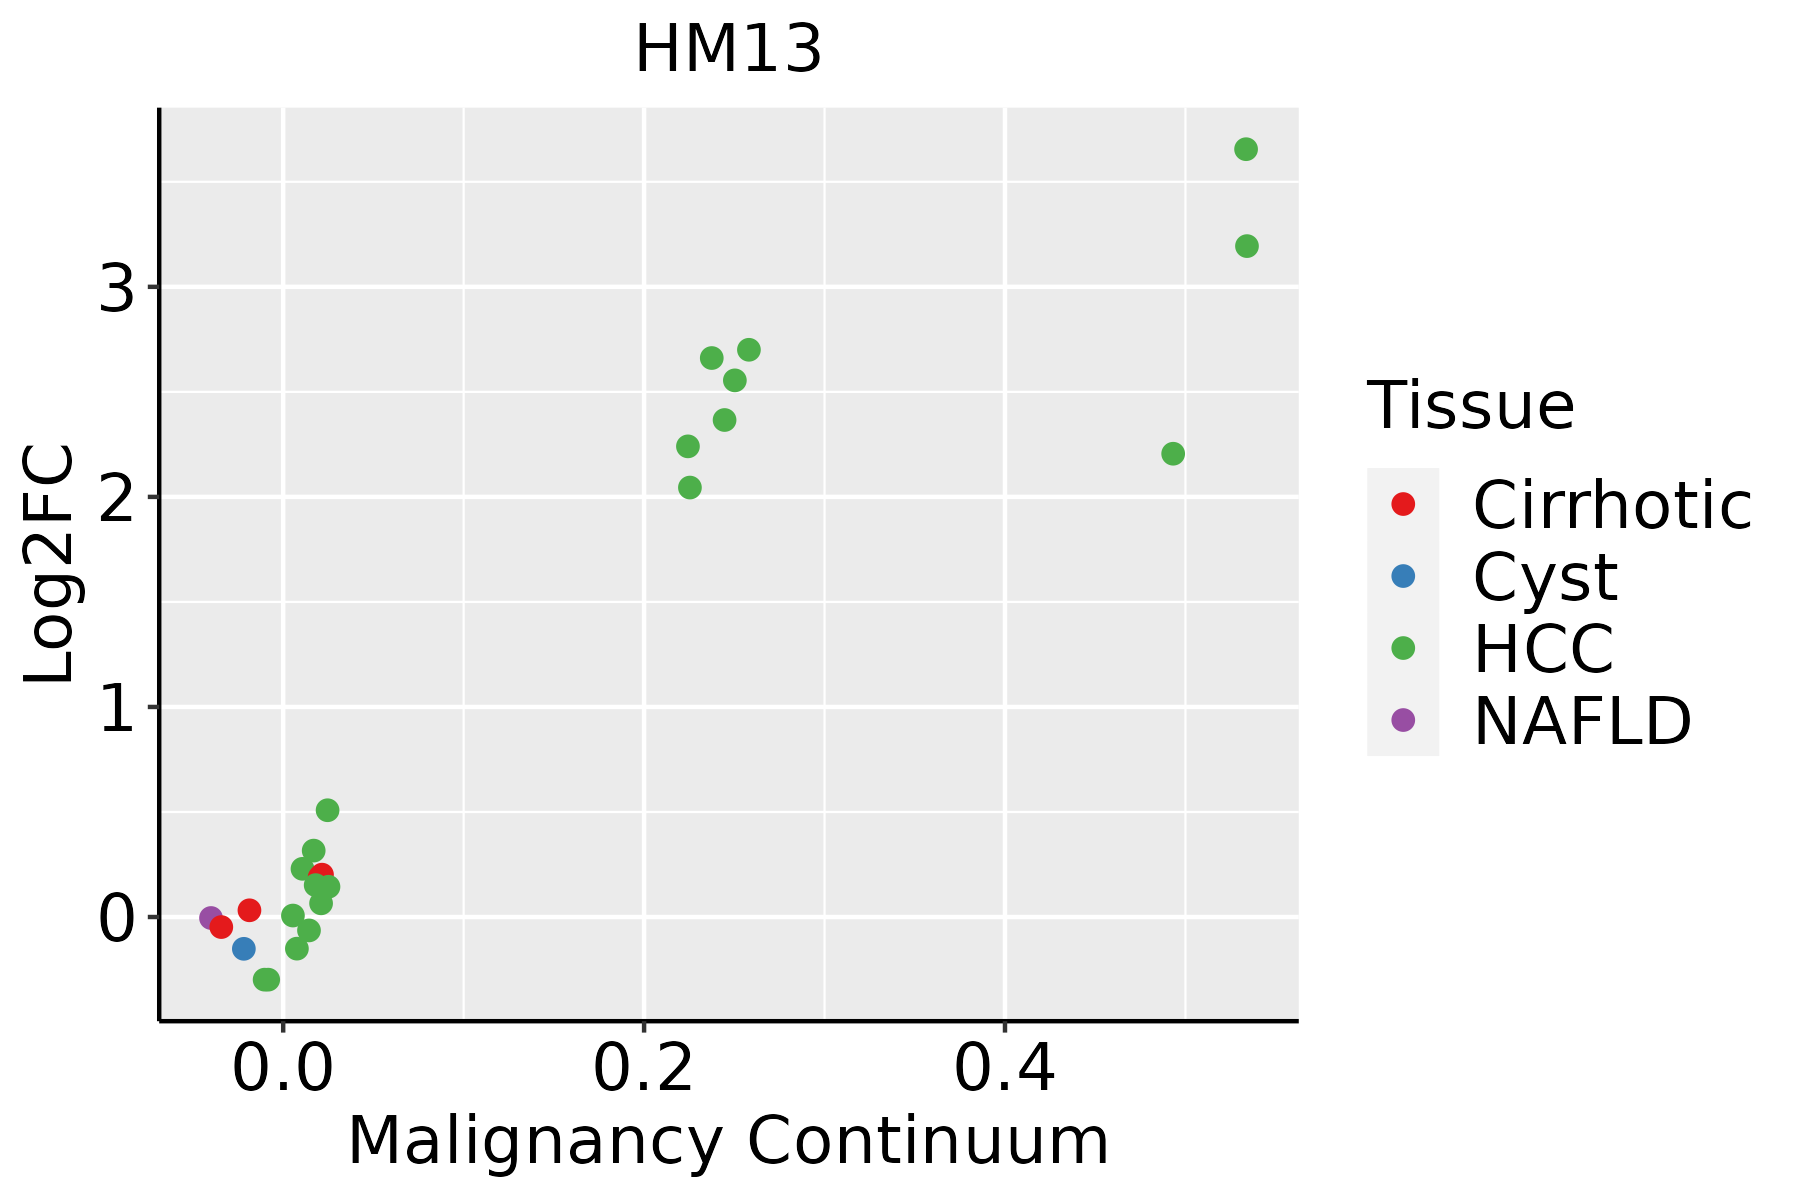
HCC: Hepatocellular carcinoma
NAFLD: Non-alcoholic fatty liver disease
Oral CavityThe image shows the transcriptomic changes along malignancy continuum.log2FC in expression of this searched gene in stem-like cells from each diseased tissue sample relative to stem-like cells in normal samples in each tissue plotted against the malignancy continuum. Samples are colored based on if they are from different disease stage.
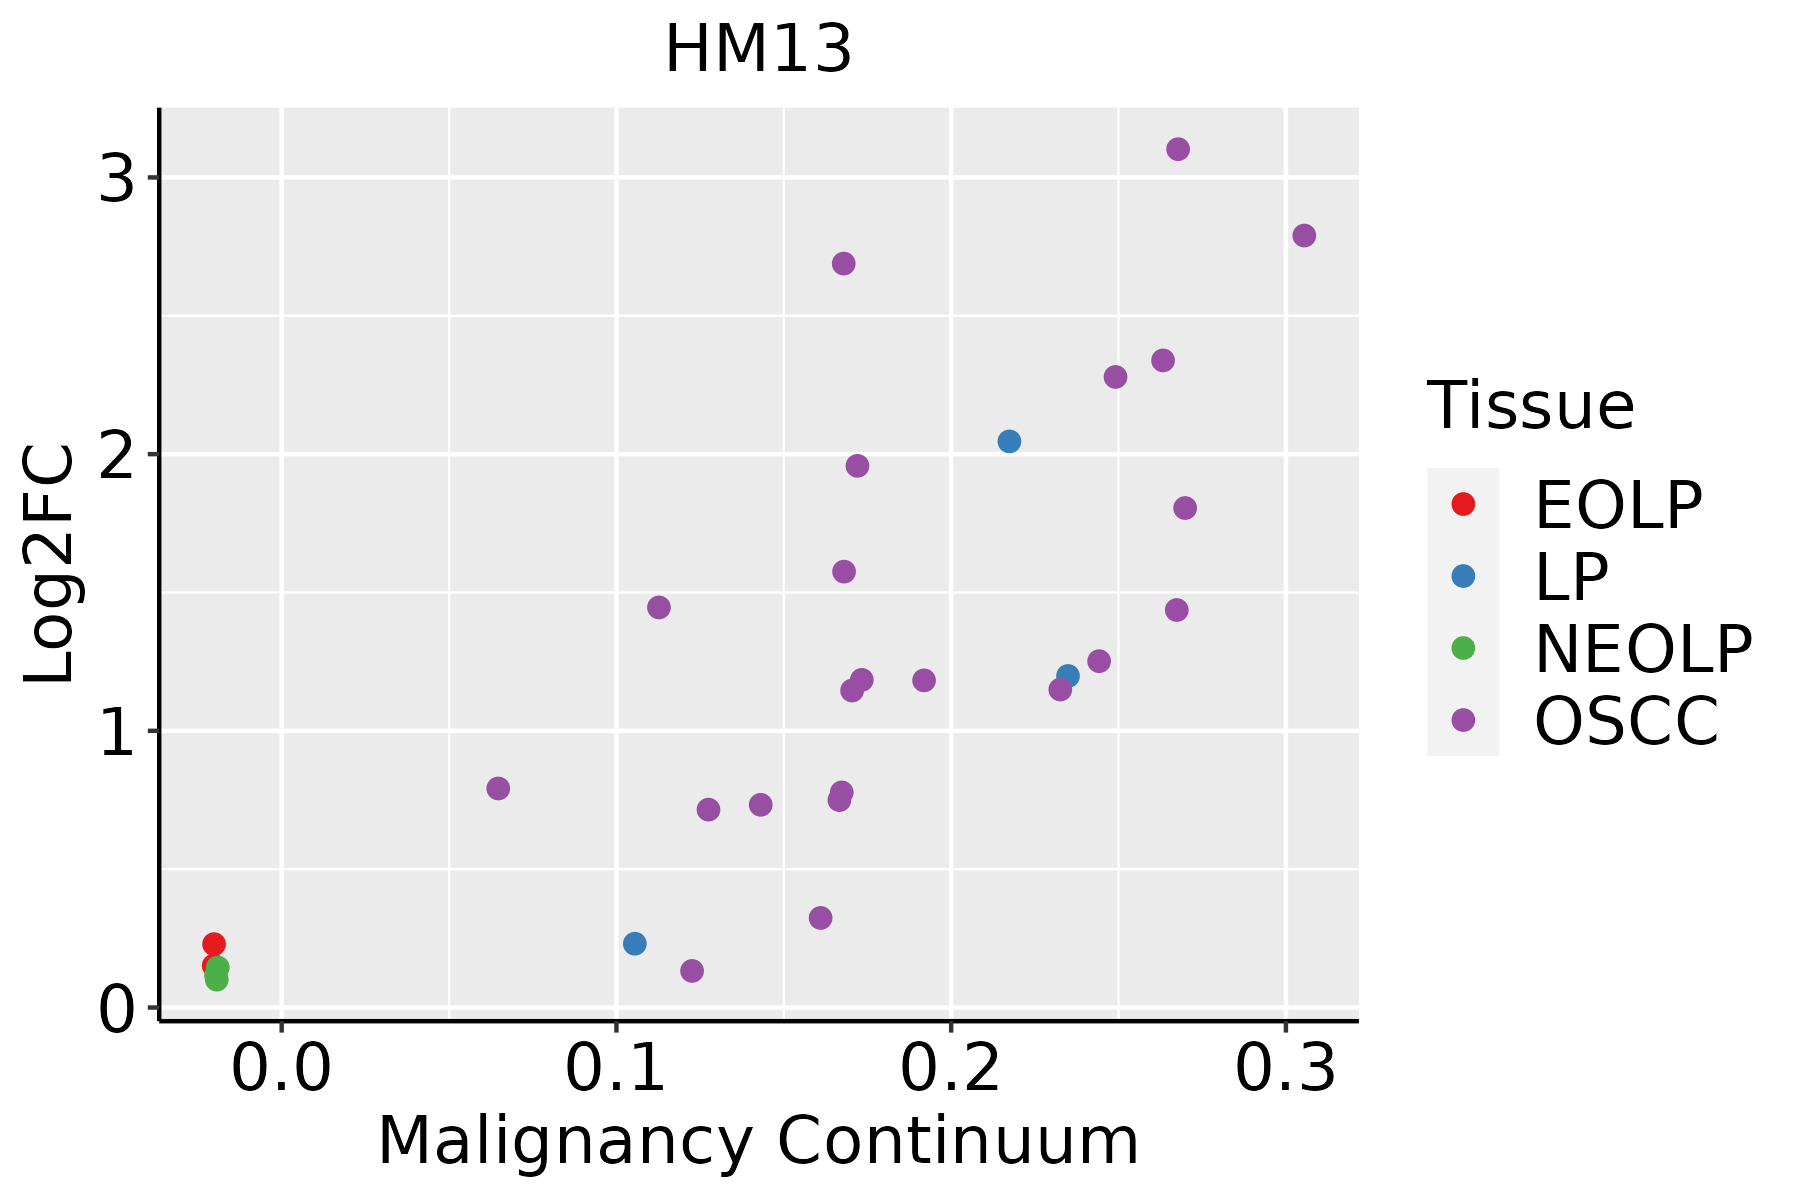
EOLP: Erosive Oral lichen planus
LP: leukoplakia
NEOLP: Non-erosive oral lichen planus
OSCC: Oral squamous cell carcinoma
ProstateThe image shows the transcriptomic changes along malignancy continuum.log2FC in expression of this searched gene in stem-like cells from each diseased tissue sample relative to stem-like cells in normal samples in each tissue plotted against the malignancy continuum. Samples are colored based on if they are from different disease stage.BPH: Benign Prostatic Hyperplasia
SkinThe image shows the transcriptomic changes along malignancy continuum.log2FC in expression of this searched gene in stem-like cells from each diseased tissue sample relative to stem-like cells in normal samples in each tissue plotted against the malignancy continuum. Samples are colored based on if they are from different disease stage.AK: Actinic keratosis
cSCC: Cutaneous squamous cell carcinoma
SCCIS:squamous cell carcinoma in situ
ThyroidThe image shows the transcriptomic changes along malignancy continuum.log2FC in expression of this searched gene in stem-like cells from each diseased tissue sample relative to stem-like cells in normal samples in each tissue plotted against the malignancy continuum. Samples are colored based on if they are from different disease stage.ATC: Anaplastic thyroid cancer
HT: Hashimoto's thyroiditis
PTC: Papillary thyroid cancer
∗log2FC in expression of this searched gene in stem-like cells from each diseased tissue sample relative to stem-like cells in normal samples in each tissue plotted against the malignancy continuum. Samples are colored based on if they are from different disease stage.

Top

Malignant transformation related pathway analysis

check buttonFind out the enriched GO biological processes and KEGG pathways involved in transition from healthy to precancer to cancer
check button Figure of enriched GO biological processes.
TissueDisease StageEnriched GO biological Processes
ColorectumADGO analysis - Figure of enriched GO biological processes: Top 15 enriched GO BP terms are showed in the bar plot of each disease state in each tissue. Each row represents a significant GO biological process which is colored according to the -log10(p.adjust).
ColorectumSERGO analysis - Figure of enriched GO biological processes: Top 15 enriched GO BP terms are showed in the bar plot of each disease state in each tissue. Each row represents a significant GO biological process which is colored according to the -log10(p.adjust).
ColorectumMSSGO analysis - Figure of enriched GO biological processes: Top 15 enriched GO BP terms are showed in the bar plot of each disease state in each tissue. Each row represents a significant GO biological process which is colored according to the -log10(p.adjust).
ColorectumMSI-HGO analysis - Figure of enriched GO biological processes: Top 15 enriched GO BP terms are showed in the bar plot of each disease state in each tissue. Each row represents a significant GO biological process which is colored according to the -log10(p.adjust).
ColorectumFAPGO analysis - Figure of enriched GO biological processes: Top 15 enriched GO BP terms are showed in the bar plot of each disease state in each tissue. Each row represents a significant GO biological process which is colored according to the -log10(p.adjust).
∗Top 15 enriched GO BP terms are showed in the bar plot of each disease state in each tissue. Each row represents a significant GO biological process which is colored according to the -log10(p.adjust).
Page: 1 2 3 4 5 6 7 8 9 

check button Enriched GO biological processes.
GO IDTissueDisease StageDescriptionGene RatioBg Ratiopvaluep.adjustCount
GO:003650314Oral cavityLPERAD pathway57/4623107/187231.99e-101.08e-0857
GO:000170117Oral cavityLPin utero embryonic development142/4623367/187231.48e-096.75e-08142
GO:003252713Oral cavityLPprotein exit from endoplasmic reticulum28/462348/187236.99e-071.86e-0528
GO:003097013Oral cavityLPretrograde protein transport, ER to cytosol18/462329/187232.15e-053.51e-0418
GO:190351313Oral cavityLPendoplasmic reticulum to cytosol transport18/462329/187232.15e-053.51e-0418
GO:001648513Oral cavityLPprotein processing83/4623225/187232.87e-054.52e-0483
GO:000646514Oral cavityLPsignal peptide processing10/462314/187233.05e-043.12e-0310
GO:003361913Oral cavityLPmembrane protein proteolysis25/462357/187231.19e-039.62e-0325
GO:001049825Oral cavityEOLPproteasomal protein catabolic process108/2218490/187237.79e-119.51e-09108
GO:003497624Oral cavityEOLPresponse to endoplasmic reticulum stress66/2218256/187235.33e-104.31e-0866
GO:003252721Oral cavityEOLPprotein exit from endoplasmic reticulum20/221848/187231.68e-075.43e-0620
GO:003097021Oral cavityEOLPretrograde protein transport, ER to cytosol13/221829/187239.41e-061.74e-0413
GO:190351321Oral cavityEOLPendoplasmic reticulum to cytosol transport13/221829/187239.41e-061.74e-0413
GO:000170123Oral cavityEOLPin utero embryonic development72/2218367/187231.02e-051.83e-0472
GO:003650321Oral cavityEOLPERAD pathway25/2218107/187236.07e-045.08e-0325
GO:003361921Oral cavityEOLPmembrane protein proteolysis16/221857/187237.07e-045.78e-0316
GO:005160423Oral cavityEOLPprotein maturation50/2218294/187235.32e-032.77e-0250
GO:001049831Oral cavityNEOLPproteasomal protein catabolic process103/2005490/187231.08e-111.65e-09103
GO:000170132Oral cavityNEOLPin utero embryonic development76/2005367/187231.11e-085.44e-0776
GO:003497632Oral cavityNEOLPresponse to endoplasmic reticulum stress56/2005256/187231.39e-074.84e-0656
Page: 1 2 3 4 5 6 7 8 9 10 

check button Enriched KEGG pathways.
Pathway IDTissueDisease StageDescriptionGene RatioBg Ratiopvaluep.adjustqvalueCount
Page: 1 

Top

Cell-cell communication analysis

check buttonIdentification of potential cell-cell interactions between two cell types and their ligand-receptor pairs for different disease states
LigandReceptorLRpairPathwayTissueDisease Stage
Page: 1 

Top

Single-cell gene regulatory network inference analysis

check buttonFind out the significant the regulons (TFs) and the target genes of each regulon across cell types for different disease states
TFCell TypeTissueDisease StageTarget GeneRSSRegulon Activity
∗The dot plots of a searched regulon are shown for all cell subpopulations in each disease state of each tissue based on the regulon specific score inferred using pySCENIC and by calculating the average expression.
Page: 1 

Top

Somatic mutation of malignant transformation related genes

check buttonAnnotation of somatic variants for genes involved in malignant transformation
Hugo SymbolVariant ClassVariant ClassificationdbSNP RSHGVScHGVSpHGVSp ShortSWISSPROTBIOTYPESIFTPolyPhenTumor Sample BarcodeTissueHistologySexAgeStageTherapy TypesDrugsOutcome
HM13SNVMissense_Mutationnovelc.220N>Ap.Asp74Asnp.D74NQ8TCT9protein_codingdeleterious(0)possibly_damaging(0.661)TCGA-AR-A2LR-01Breastbreast invasive carcinomaFemale<65I/IIChemotherapyadriamycinSD
HM13SNVMissense_Mutationc.808N>Ap.Gly270Argp.G270RQ8TCT9protein_codingdeleterious(0)probably_damaging(0.999)TCGA-BH-A0HF-01Breastbreast invasive carcinomaFemale>=65I/IIHormone TherapyarimidexSD
HM13insertionFrame_Shift_Insnovelc.643_644insAGCTATCAAATTTGTACTCAGTGGCGCAAATATTATGTGTCCAGGTp.Leu215GlnfsTer81p.L215Qfs*81Q8TCT9protein_codingTCGA-A8-A08H-01Breastbreast invasive carcinomaFemale>=65I/IIUnknownUnknownSD
HM13SNVMissense_Mutationnovelc.1075N>Tp.Leu359Phep.L359FQ8TCT9protein_codingtolerated(0.07)benign(0.435)TCGA-2W-A8YY-01Cervixcervical & endocervical cancerFemale<65I/IIChemotherapycisplatinCR
HM13SNVMissense_Mutationc.1253C>Tp.Ser418Leup.S418LQ8TCT9protein_codingdeleterious_low_confidence(0.02)benign(0)TCGA-AA-A00N-01Colorectumcolon adenocarcinomaMale>=65I/IIUnknownUnknownPD
HM13SNVMissense_Mutationc.776N>Tp.Ala259Valp.A259VQ8TCT9protein_codingdeleterious(0)benign(0.358)TCGA-F4-6703-01Colorectumcolon adenocarcinomaMale<65I/IIUnknownUnknownSD
HM13SNVMissense_Mutationnovelc.196N>Cp.Met66Leup.M66LQ8TCT9protein_codingtolerated(0.2)benign(0.01)TCGA-AG-A032-01Colorectumrectum adenocarcinomaMale>=65III/IVTargeted Molecular therapybevacizumabPD
HM13SNVMissense_Mutationnovelc.197N>Ap.Met66Lysp.M66KQ8TCT9protein_codingtolerated(0.65)benign(0.003)TCGA-AG-A032-01Colorectumrectum adenocarcinomaMale>=65III/IVTargeted Molecular therapybevacizumabPD
HM13SNVMissense_Mutationnovelc.1244C>Tp.Ala415Valp.A415VQ8TCT9protein_codingdeleterious_low_confidence(0)possibly_damaging(0.682)TCGA-EI-6917-01Colorectumrectum adenocarcinomaMale<65III/IVChemotherapy5fluorouracil+oxaciplatina+l-folinianSD
HM13SNVMissense_Mutationnovelc.706T>Cp.Phe236Leup.F236LQ8TCT9protein_codingdeleterious(0.05)benign(0.051)TCGA-F5-6814-01Colorectumrectum adenocarcinomaMale<65I/IIUnknownUnknownSD
Page: 1 2 3 4 

Top

Related drugs of malignant transformation related genes

check buttonIdentification of chemicals and drugs interact with genes involved in malignant transfromation
(DGIdb 4.0)
Entrez IDSymbolCategoryInteraction TypesDrug Claim NameDrug NamePMIDs
Page: 1