
|
|||||
|
 | |
| |
| |
| |
| |
| |
|
Gene: FTH1 |
Gene summary for FTH1 |
| Gene information | Species | Human | Gene symbol | FTH1 | Gene ID | 2495 |
| Gene name | ferritin heavy chain 1 | |
| Gene Alias | FHC | |
| Cytomap | 11q12.3 | |
| Gene Type | protein-coding | GO ID | GO:0000041 | UniProtAcc | A0A024R525 |
Top |
Malignant transformation analysis |
| Identification of the aberrant gene expression in precancerous and cancerous lesions by comparing the gene expression of stem-like cells in diseased tissues with normal stem cells |
| Entrez ID | Symbol | Replicates | Species | Organ | Tissue | Adj P-value | Log2FC | Malignancy |
| 2495 | FTH1 | GSM4909280 | Human | Breast | Precancer | 5.07e-08 | -5.53e-01 | 0.0305 |
| 2495 | FTH1 | GSM4909282 | Human | Breast | IDC | 7.02e-25 | -2.86e-01 | -0.0288 |
| 2495 | FTH1 | GSM4909285 | Human | Breast | IDC | 2.34e-11 | -1.74e-01 | 0.21 |
| 2495 | FTH1 | GSM4909286 | Human | Breast | IDC | 6.67e-59 | -4.54e-01 | 0.1081 |
| 2495 | FTH1 | GSM4909293 | Human | Breast | IDC | 3.57e-23 | -2.29e-01 | 0.1581 |
| 2495 | FTH1 | GSM4909297 | Human | Breast | IDC | 8.23e-22 | -2.88e-01 | 0.1517 |
| 2495 | FTH1 | GSM4909298 | Human | Breast | IDC | 7.87e-15 | -1.97e-01 | 0.1551 |
| 2495 | FTH1 | GSM4909299 | Human | Breast | IDC | 7.54e-05 | -1.24e-01 | 0.035 |
| 2495 | FTH1 | GSM4909304 | Human | Breast | IDC | 1.76e-27 | -2.90e-01 | 0.1636 |
| 2495 | FTH1 | GSM4909306 | Human | Breast | IDC | 3.16e-03 | -1.05e-01 | 0.1564 |
| 2495 | FTH1 | GSM4909307 | Human | Breast | IDC | 8.62e-23 | 2.76e-01 | 0.1569 |
| 2495 | FTH1 | GSM4909308 | Human | Breast | IDC | 2.65e-43 | 3.68e-01 | 0.158 |
| 2495 | FTH1 | GSM4909311 | Human | Breast | IDC | 1.23e-06 | -1.65e-01 | 0.1534 |
| 2495 | FTH1 | GSM4909317 | Human | Breast | IDC | 2.76e-26 | -3.99e-01 | 0.1355 |
| 2495 | FTH1 | brca1 | Human | Breast | Precancer | 5.37e-12 | 2.08e-01 | -0.0338 |
| 2495 | FTH1 | brca2 | Human | Breast | Precancer | 1.27e-18 | 2.54e-01 | -0.024 |
| 2495 | FTH1 | brca3 | Human | Breast | Precancer | 6.97e-10 | 2.04e-01 | -0.0263 |
| 2495 | FTH1 | M1 | Human | Breast | IDC | 2.56e-32 | -5.65e-01 | 0.1577 |
| 2495 | FTH1 | NCCBC11 | Human | Breast | DCIS | 3.62e-02 | -2.96e-01 | 0.1232 |
| 2495 | FTH1 | NCCBC3 | Human | Breast | DCIS | 9.09e-18 | -2.16e-01 | 0.1198 |
| Page: 1 2 3 4 5 6 7 8 9 10 11 12 13 14 15 16 17 18 19 20 21 |
| Tissue | Expression Dynamics | Abbreviation |
| Breast | 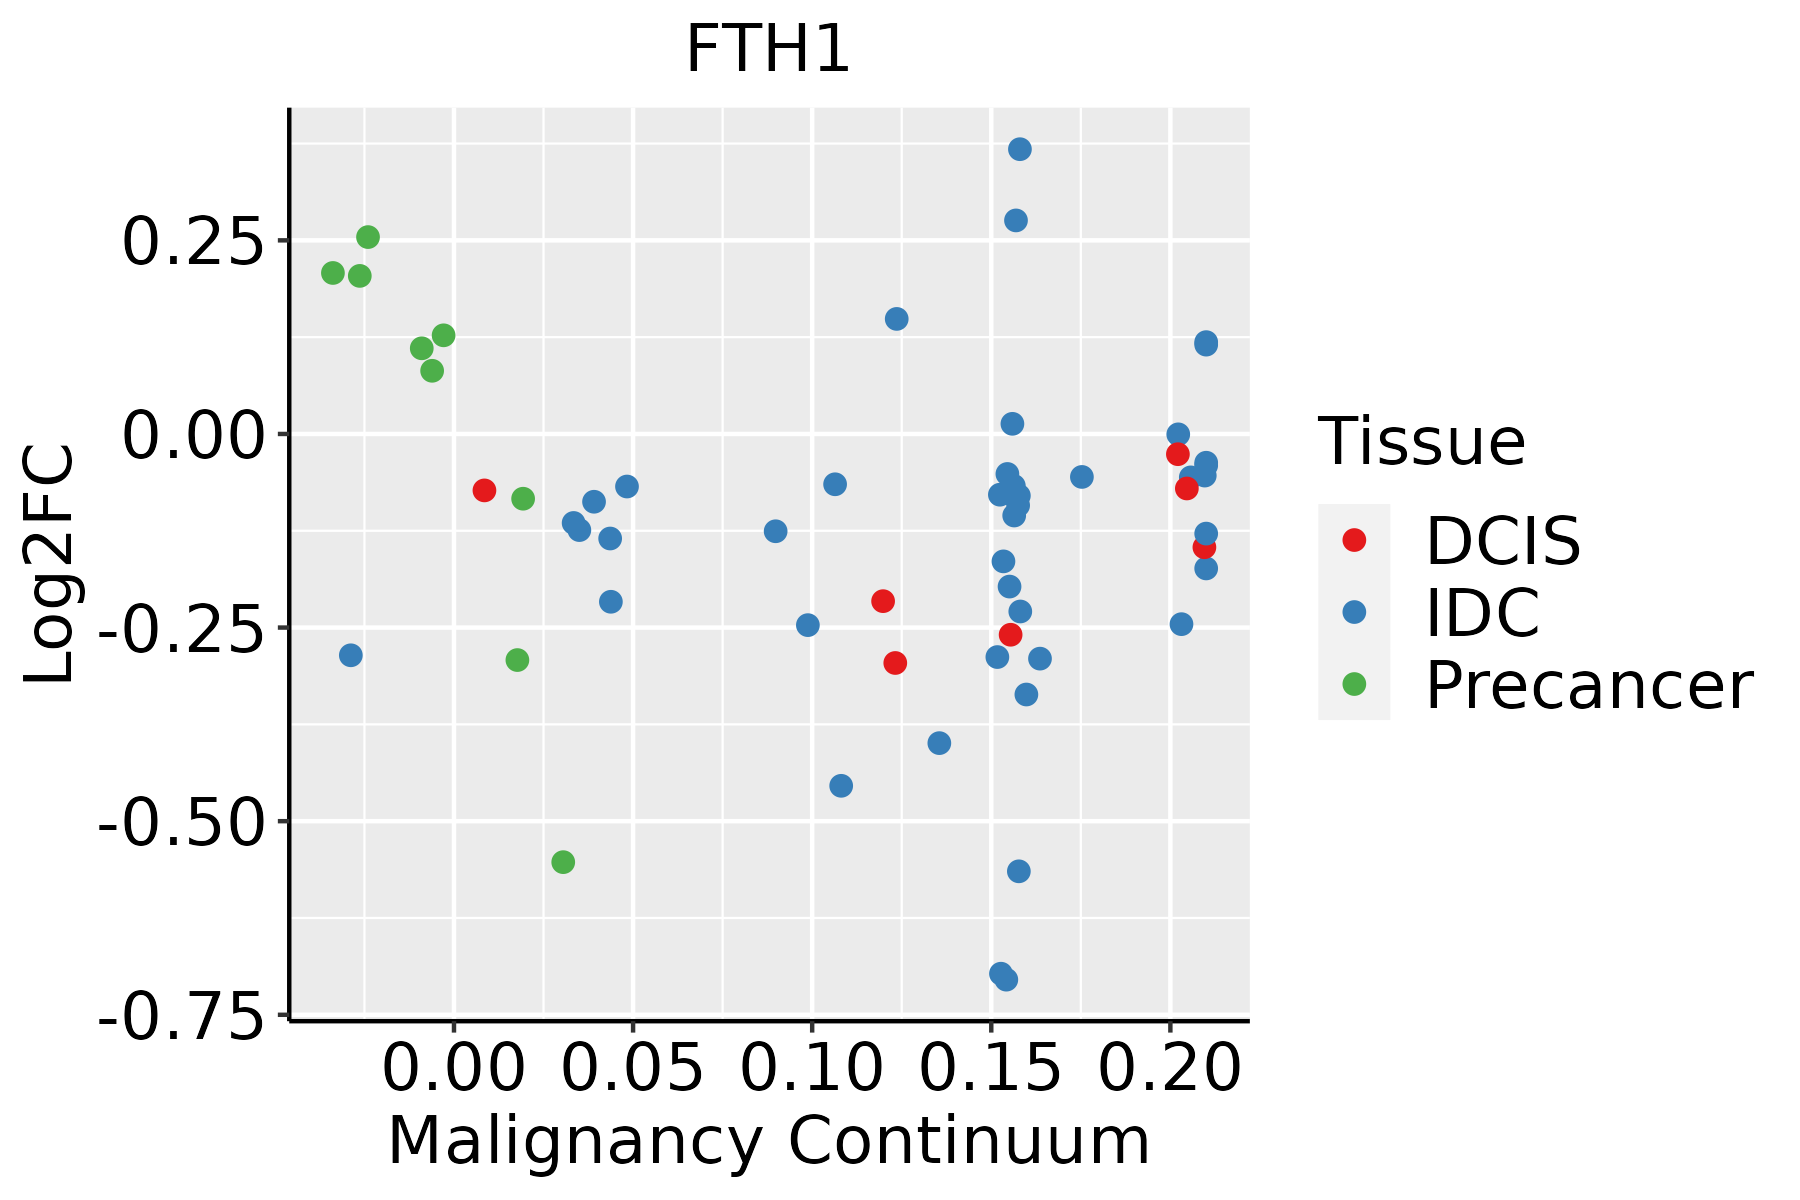 | IDC: Invasive ductal carcinoma |
| DCIS: Ductal carcinoma in situ | ||
| Precancer(BRCA1-mut): Precancerous lesion from BRCA1 mutation carriers | ||
| Cervix | 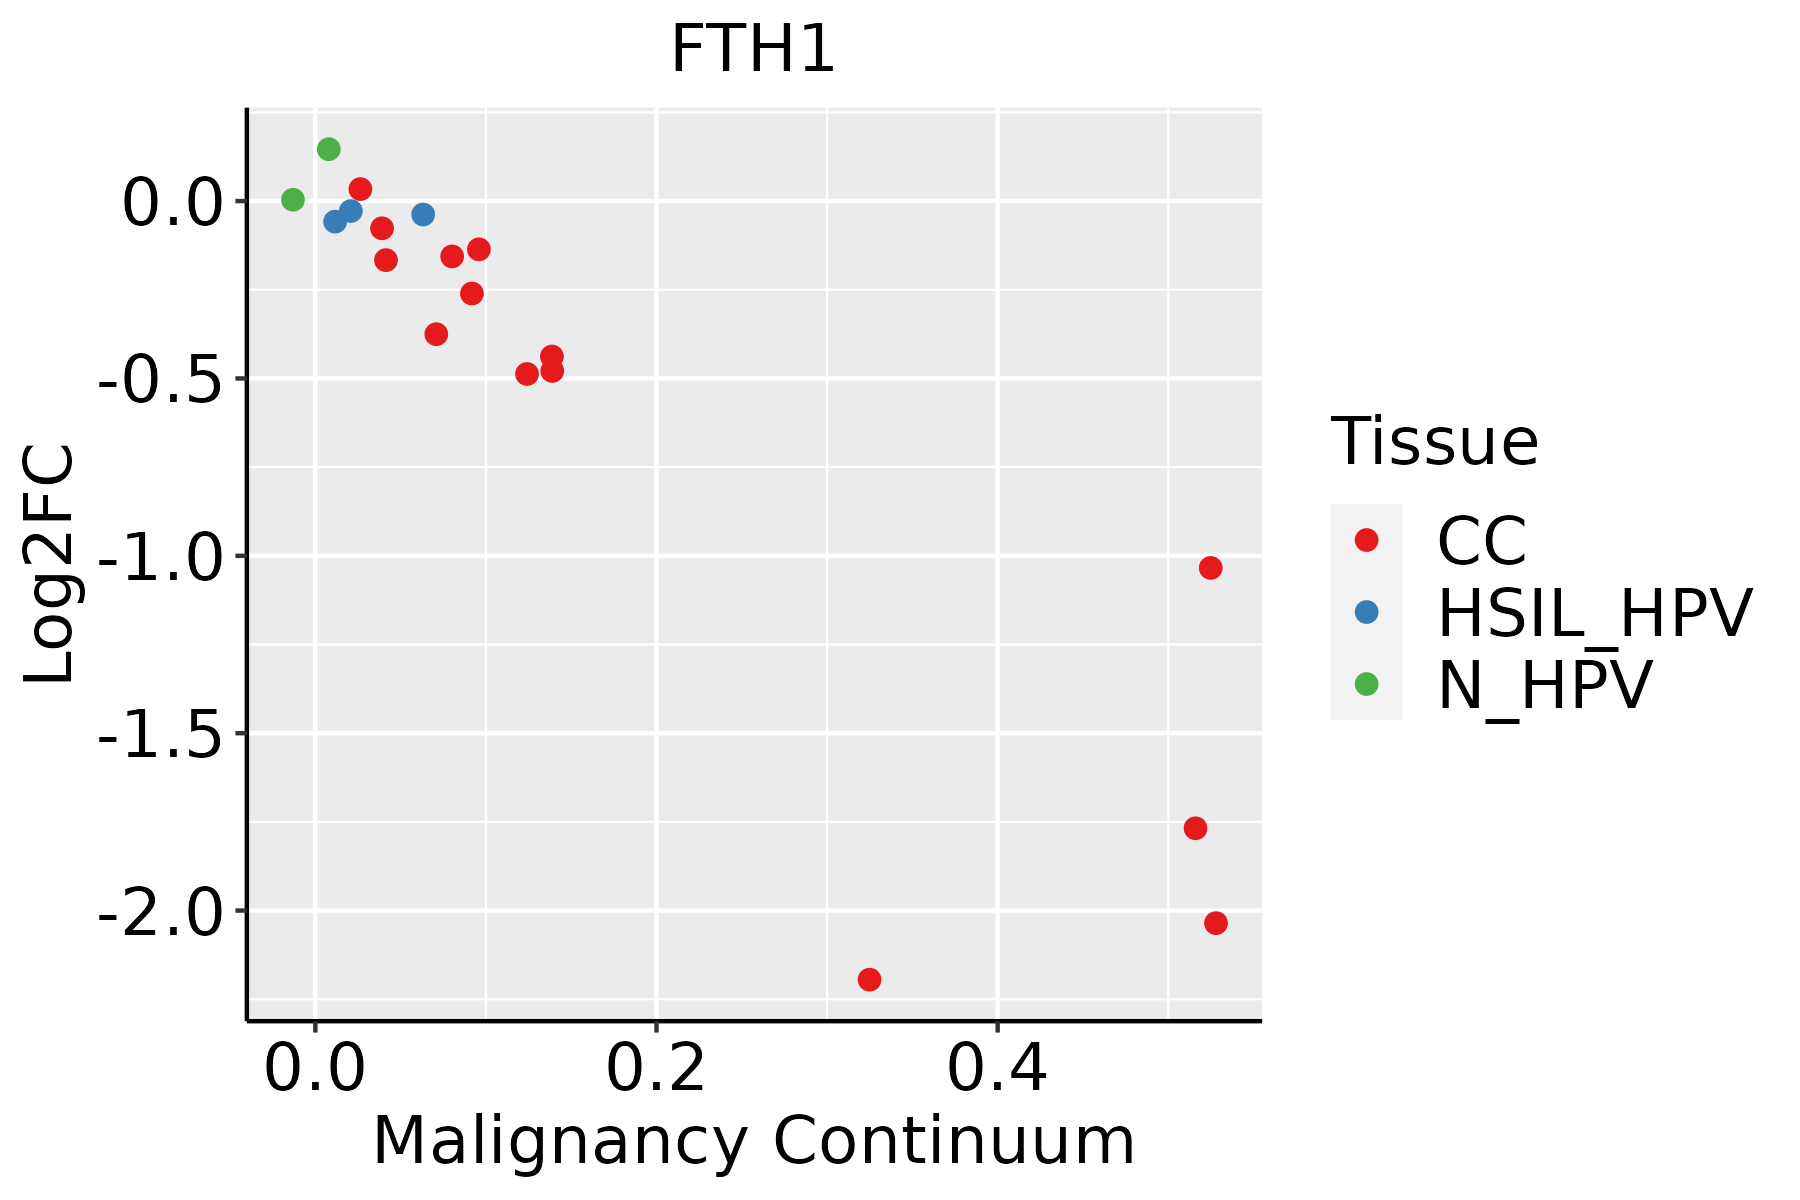 | CC: Cervix cancer |
| HSIL_HPV: HPV-infected high-grade squamous intraepithelial lesions | ||
| N_HPV: HPV-infected normal cervix | ||
| Colorectum (GSE201348) |  | FAP: Familial adenomatous polyposis |
| CRC: Colorectal cancer | ||
| Colorectum (HTA11) |  | AD: Adenomas |
| SER: Sessile serrated lesions | ||
| MSI-H: Microsatellite-high colorectal cancer | ||
| MSS: Microsatellite stable colorectal cancer | ||
| Endometrium | 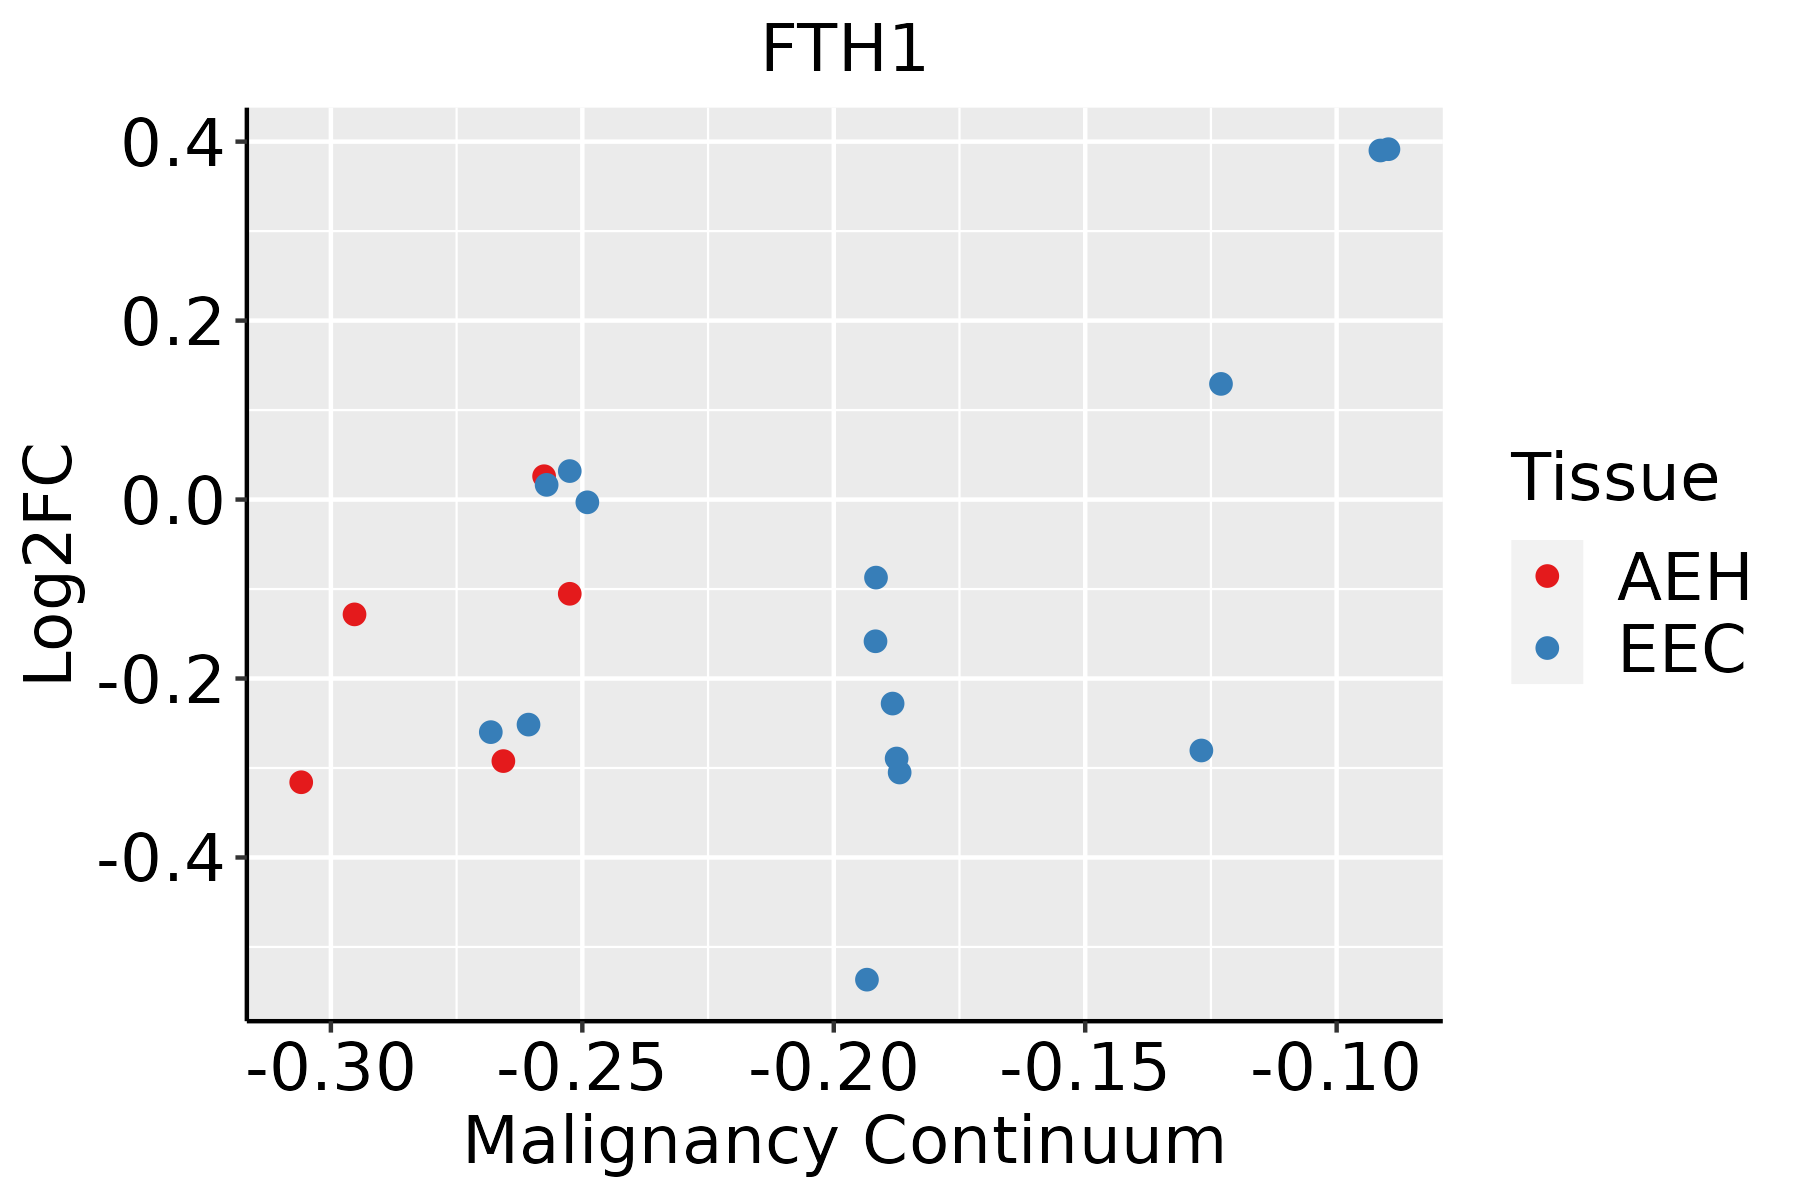 | AEH: Atypical endometrial hyperplasia |
| EEC: Endometrioid Cancer | ||
| Esophagus | 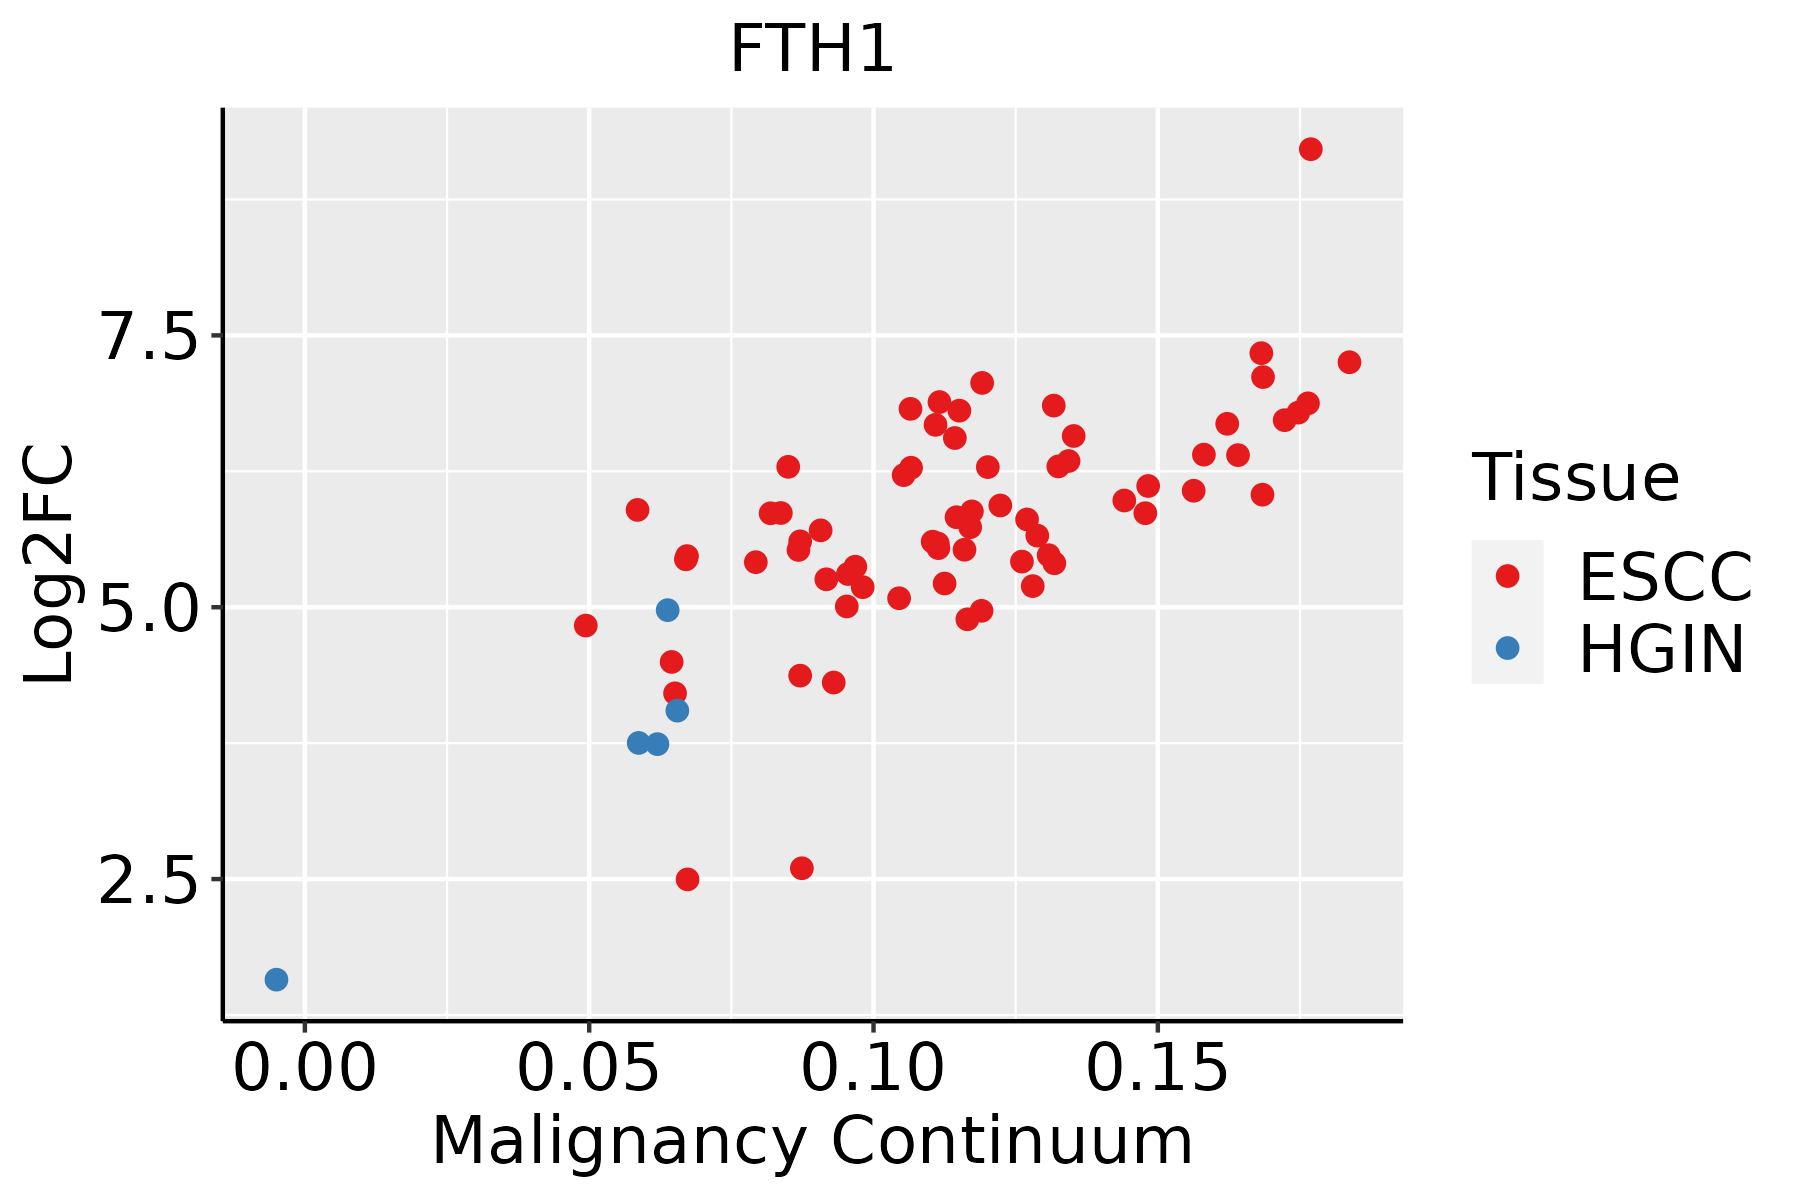 | ESCC: Esophageal squamous cell carcinoma |
| HGIN: High-grade intraepithelial neoplasias | ||
| LGIN: Low-grade intraepithelial neoplasias | ||
| GC | 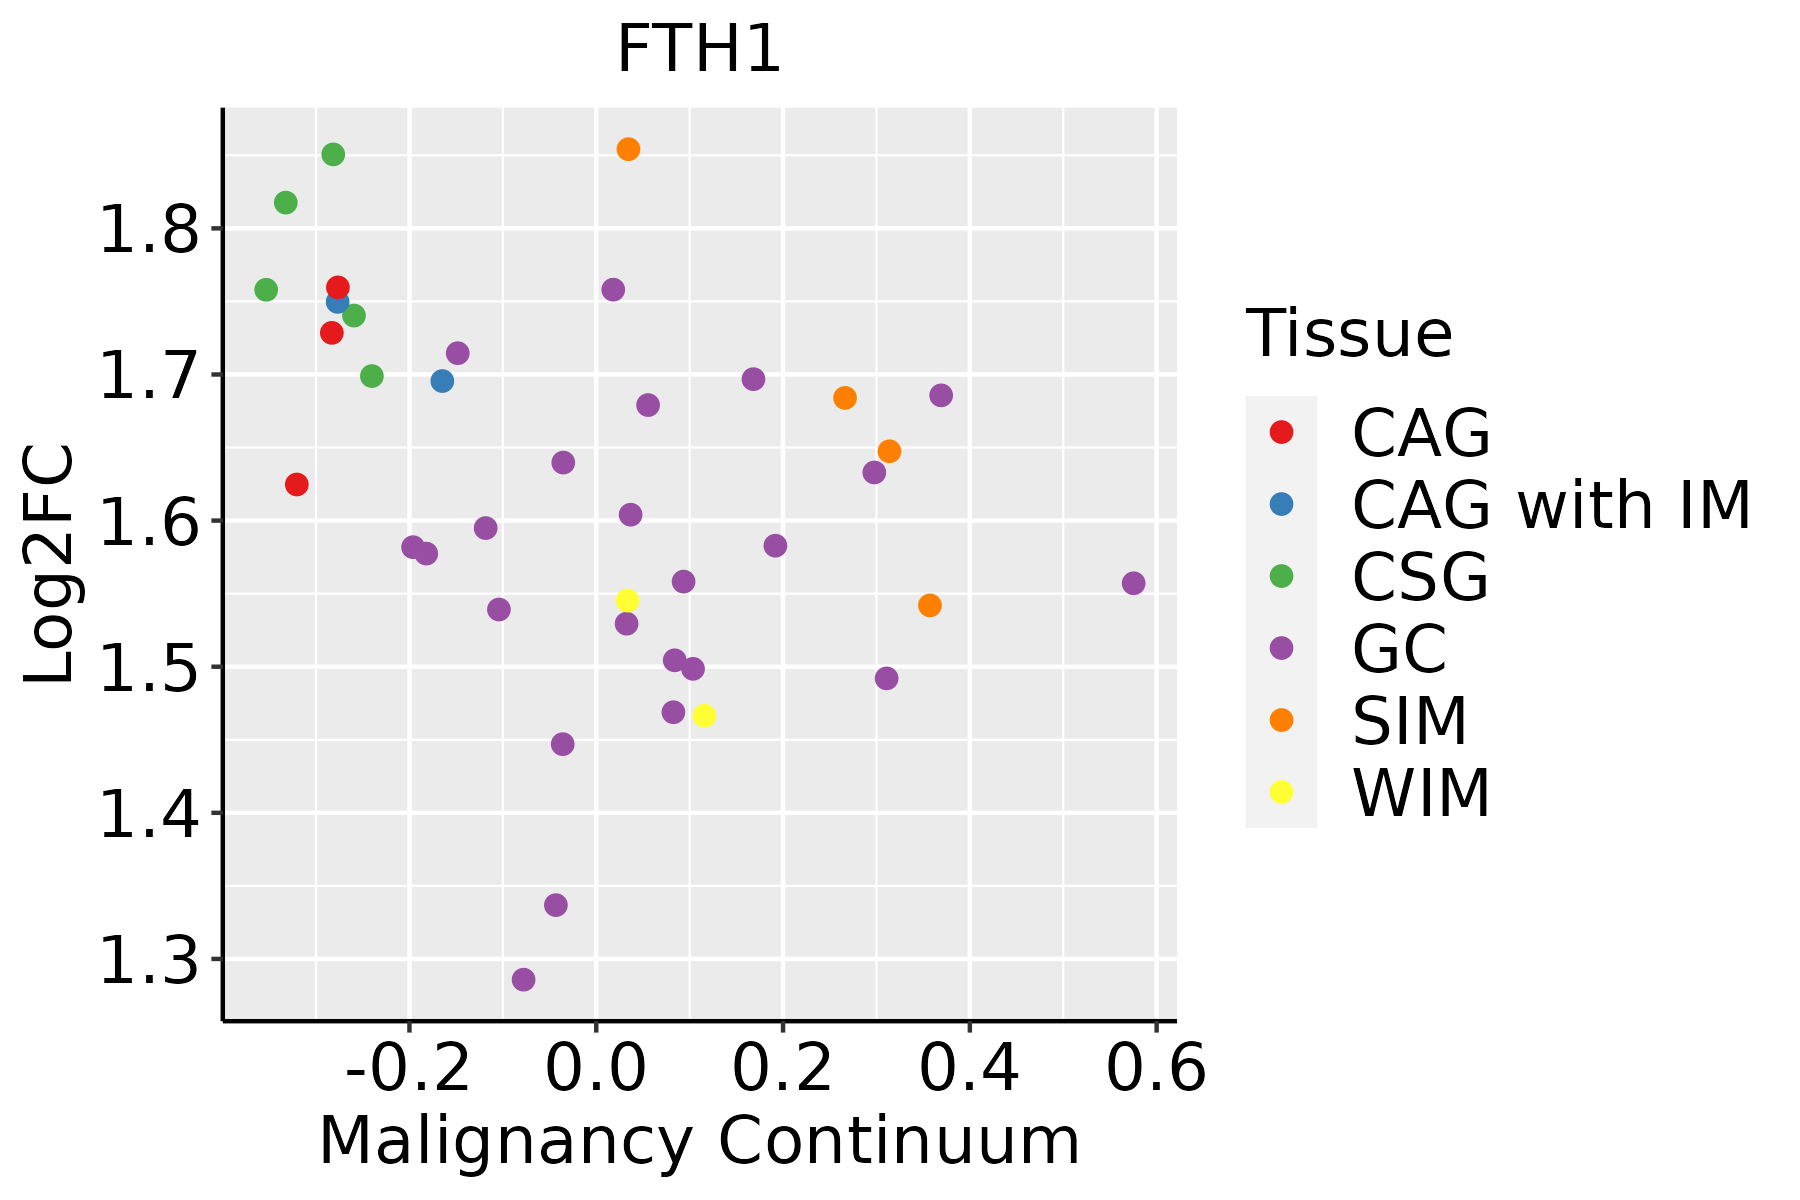 | CAG: Chronic atrophic gastritis |
| CAG with IM: Chronic atrophic gastritis with intestinal metaplasia | ||
| CSG: Chronic superficial gastritis | ||
| GC: Gastric cancer | ||
| SIM: Severe intestinal metaplasia | ||
| WIM: Wild intestinal metaplasia | ||
| Liver | 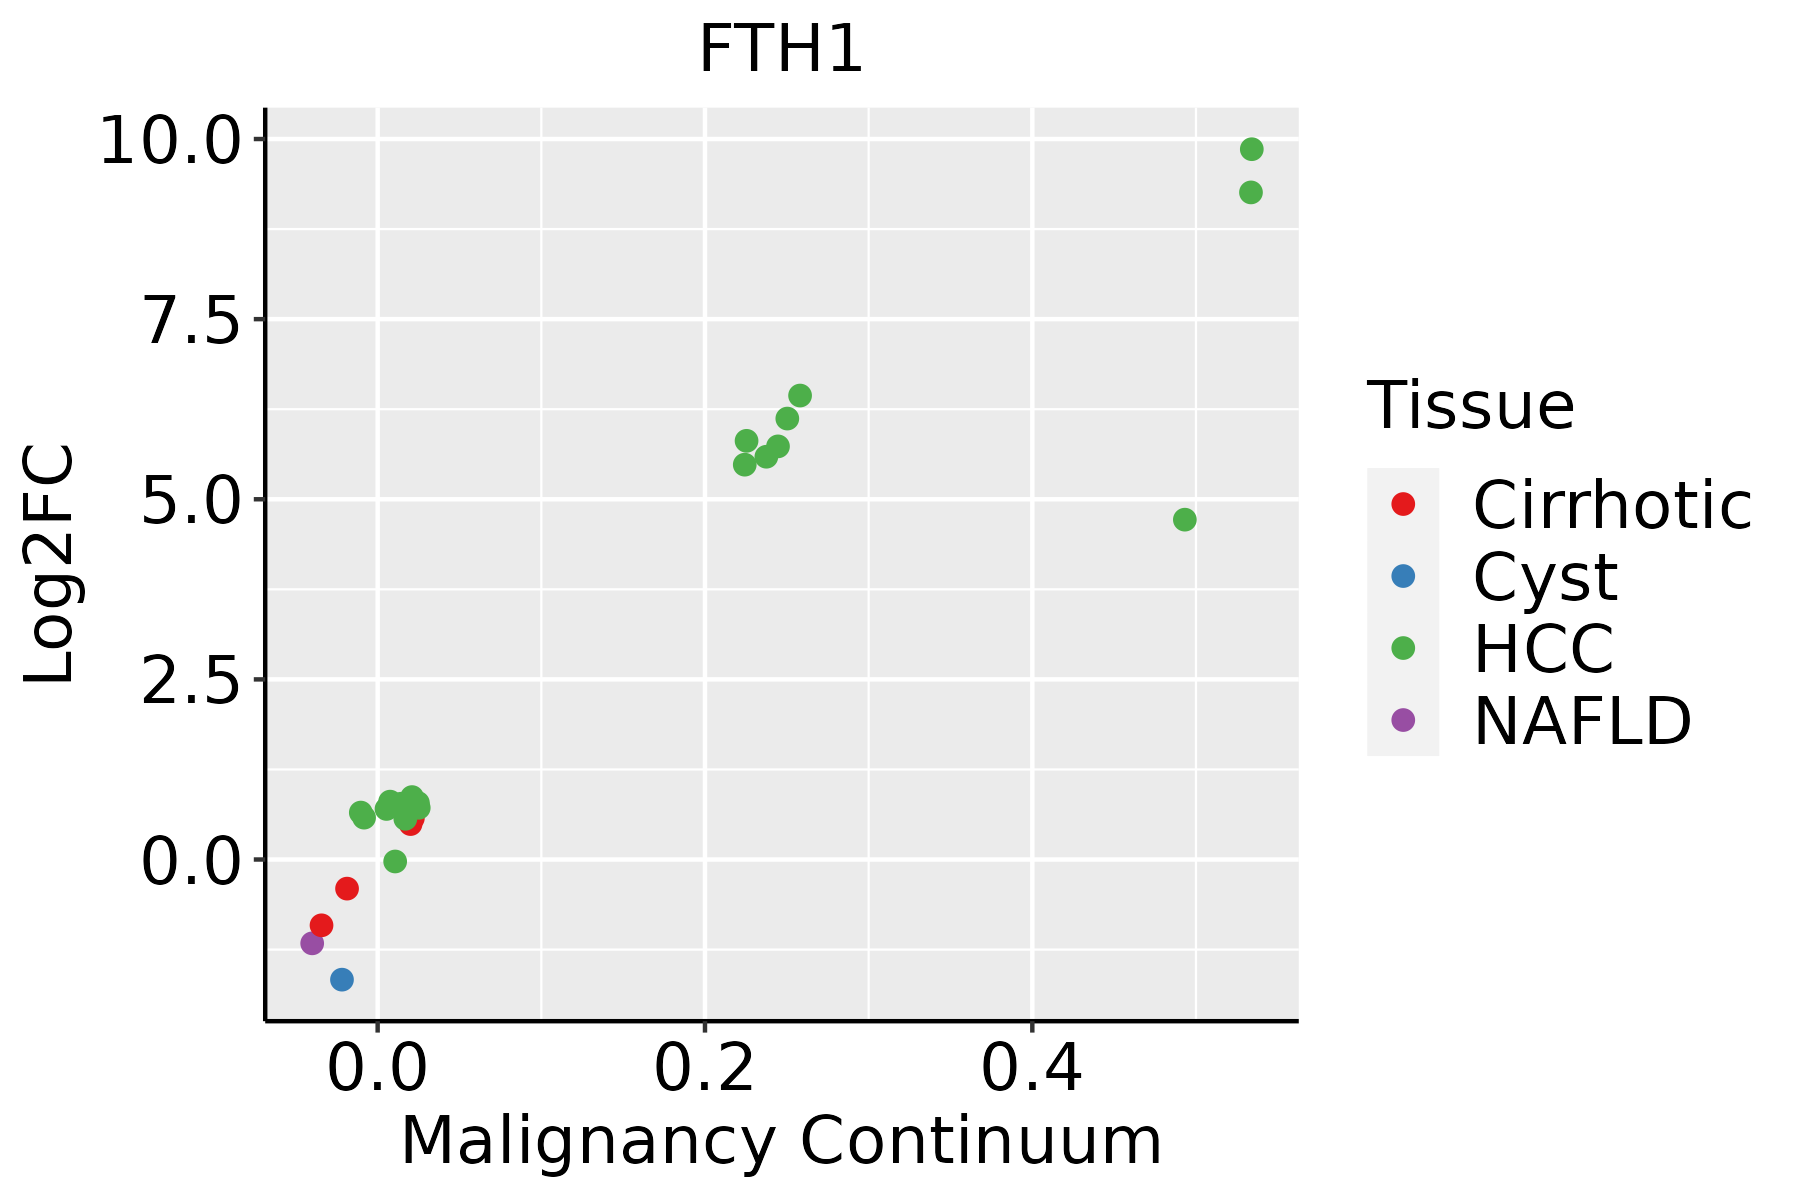 | HCC: Hepatocellular carcinoma |
| NAFLD: Non-alcoholic fatty liver disease | ||
| Lung |  | AAH: Atypical adenomatous hyperplasia |
| AIS: Adenocarcinoma in situ | ||
| IAC: Invasive lung adenocarcinoma | ||
| MIA: Minimally invasive adenocarcinoma | ||
| Oral Cavity | 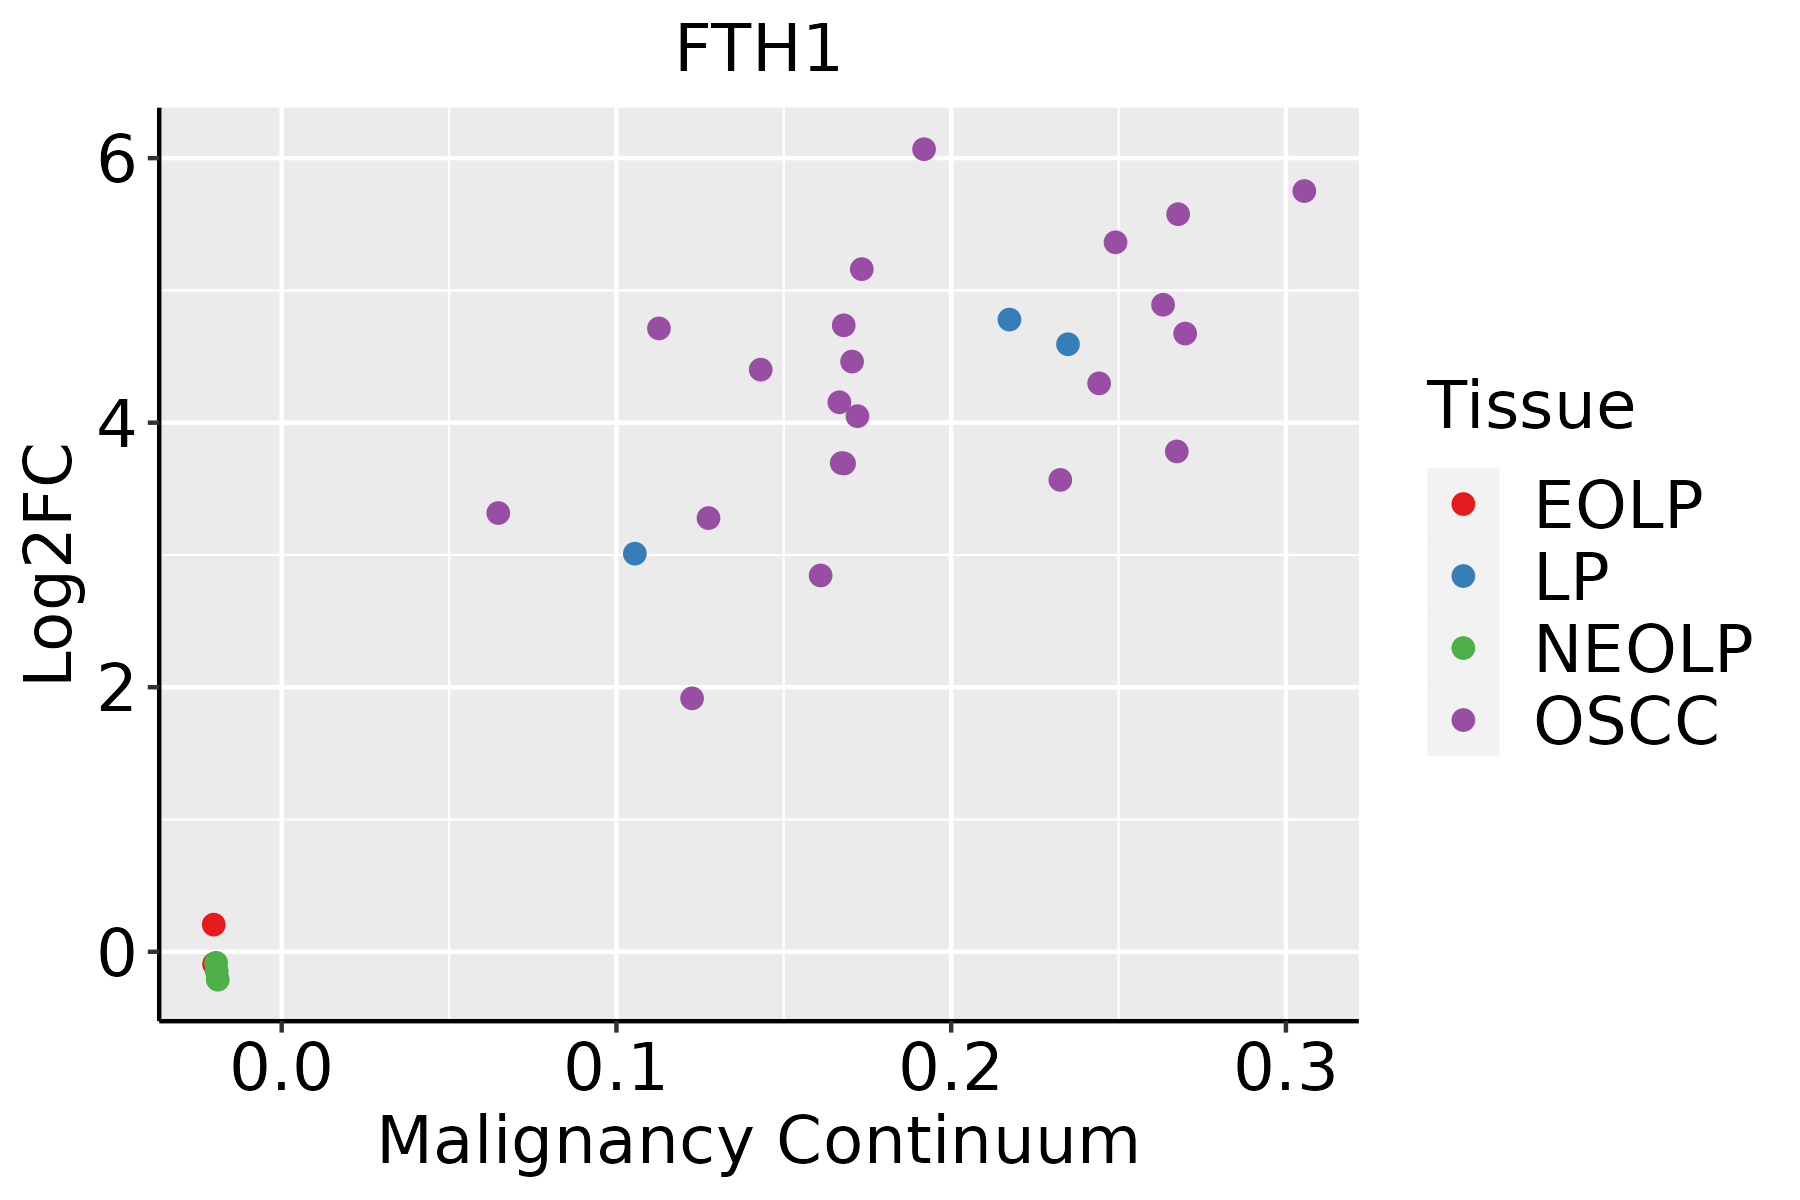 | EOLP: Erosive Oral lichen planus |
| LP: leukoplakia | ||
| NEOLP: Non-erosive oral lichen planus | ||
| OSCC: Oral squamous cell carcinoma | ||
| Prostate | 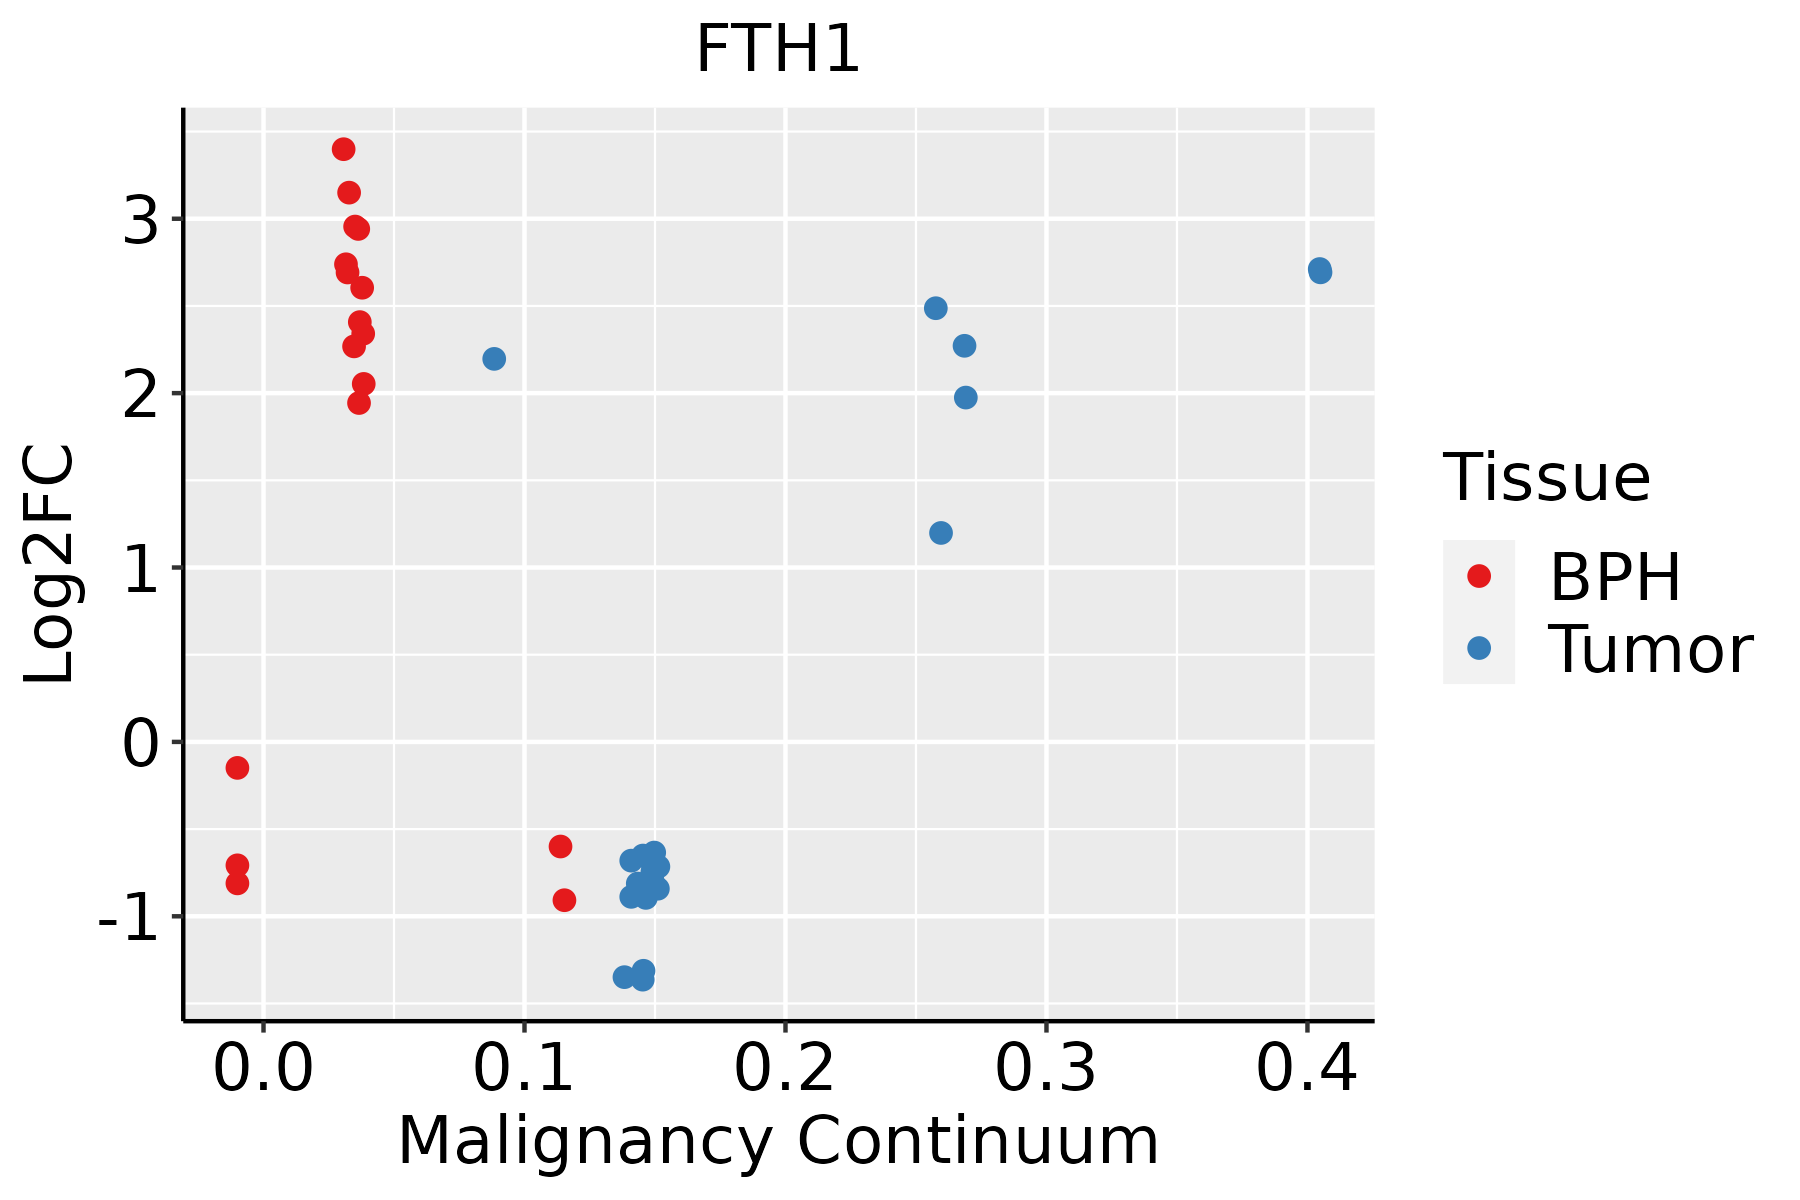 | BPH: Benign Prostatic Hyperplasia |
| Skin | 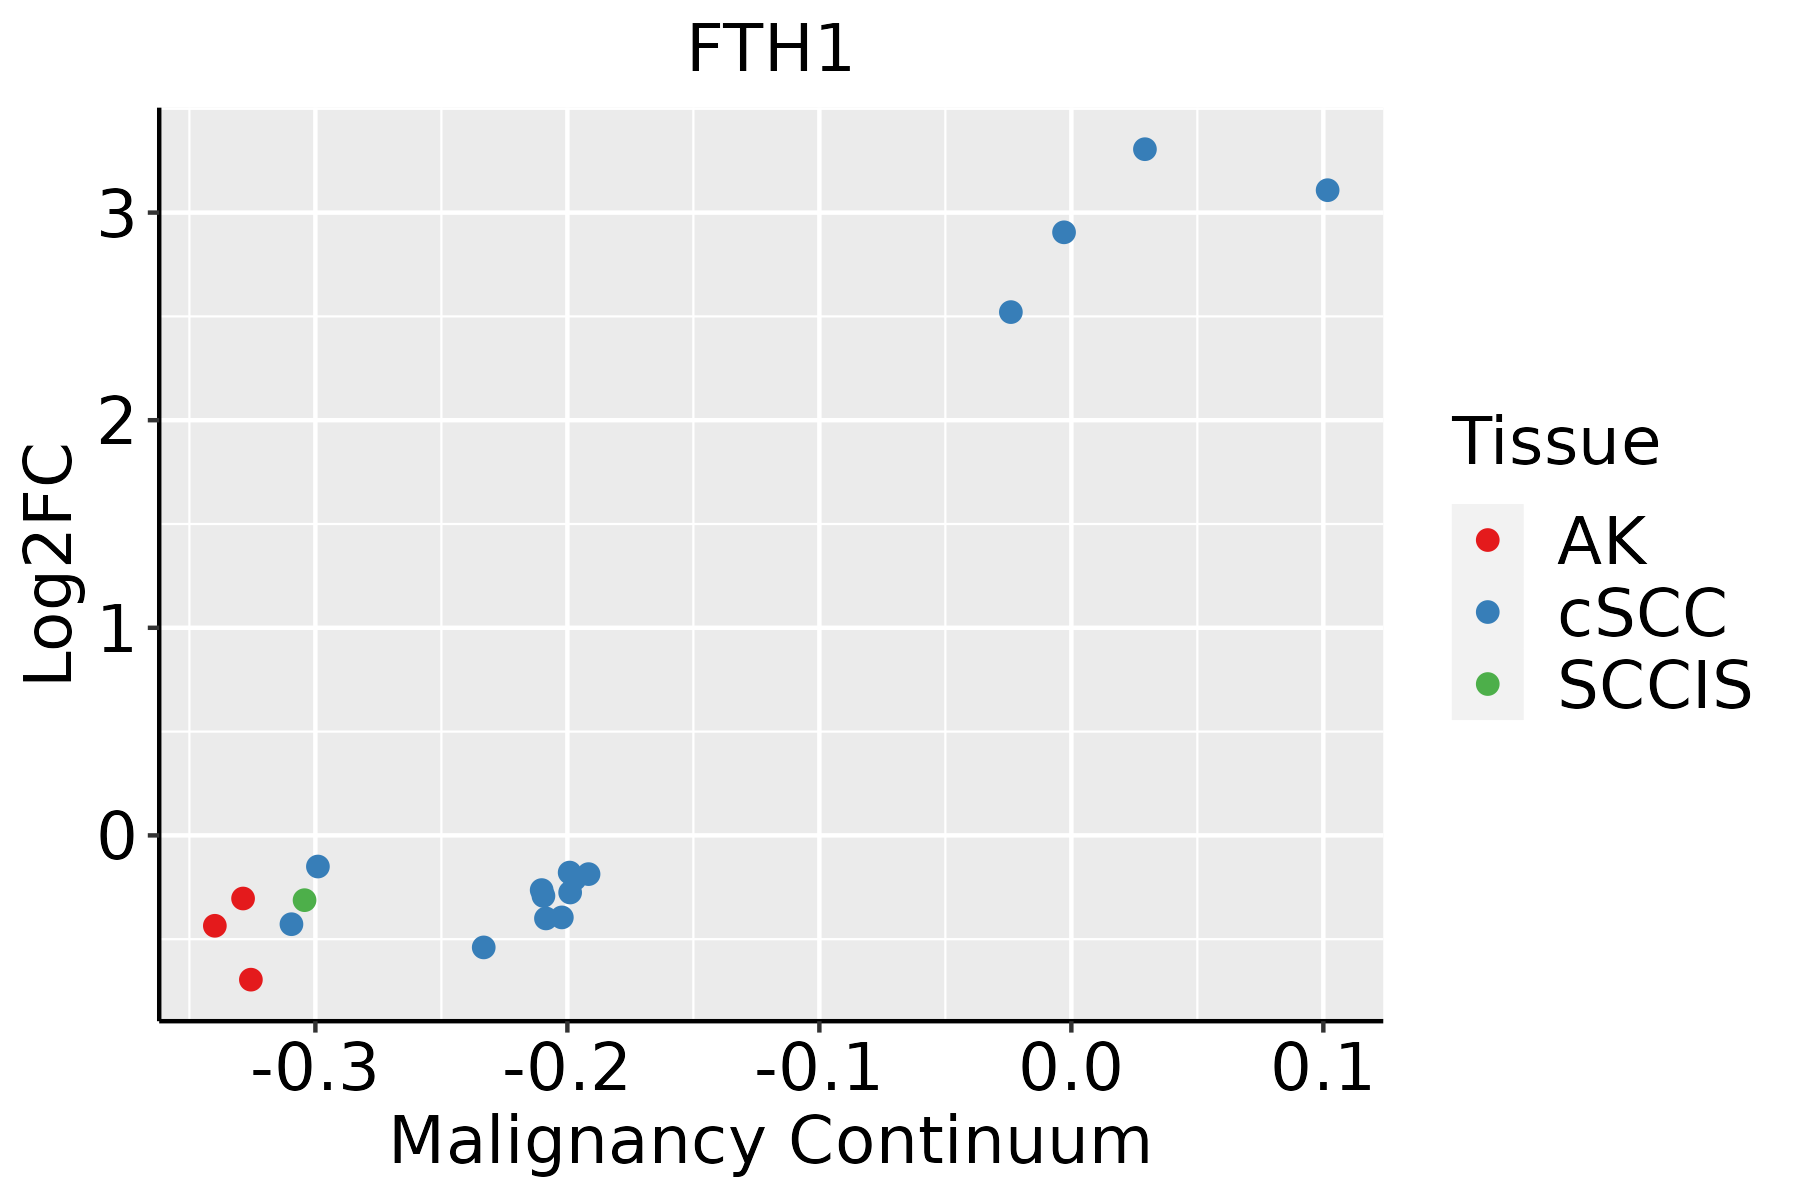 | AK: Actinic keratosis |
| cSCC: Cutaneous squamous cell carcinoma | ||
| SCCIS:squamous cell carcinoma in situ | ||
| Thyroid | 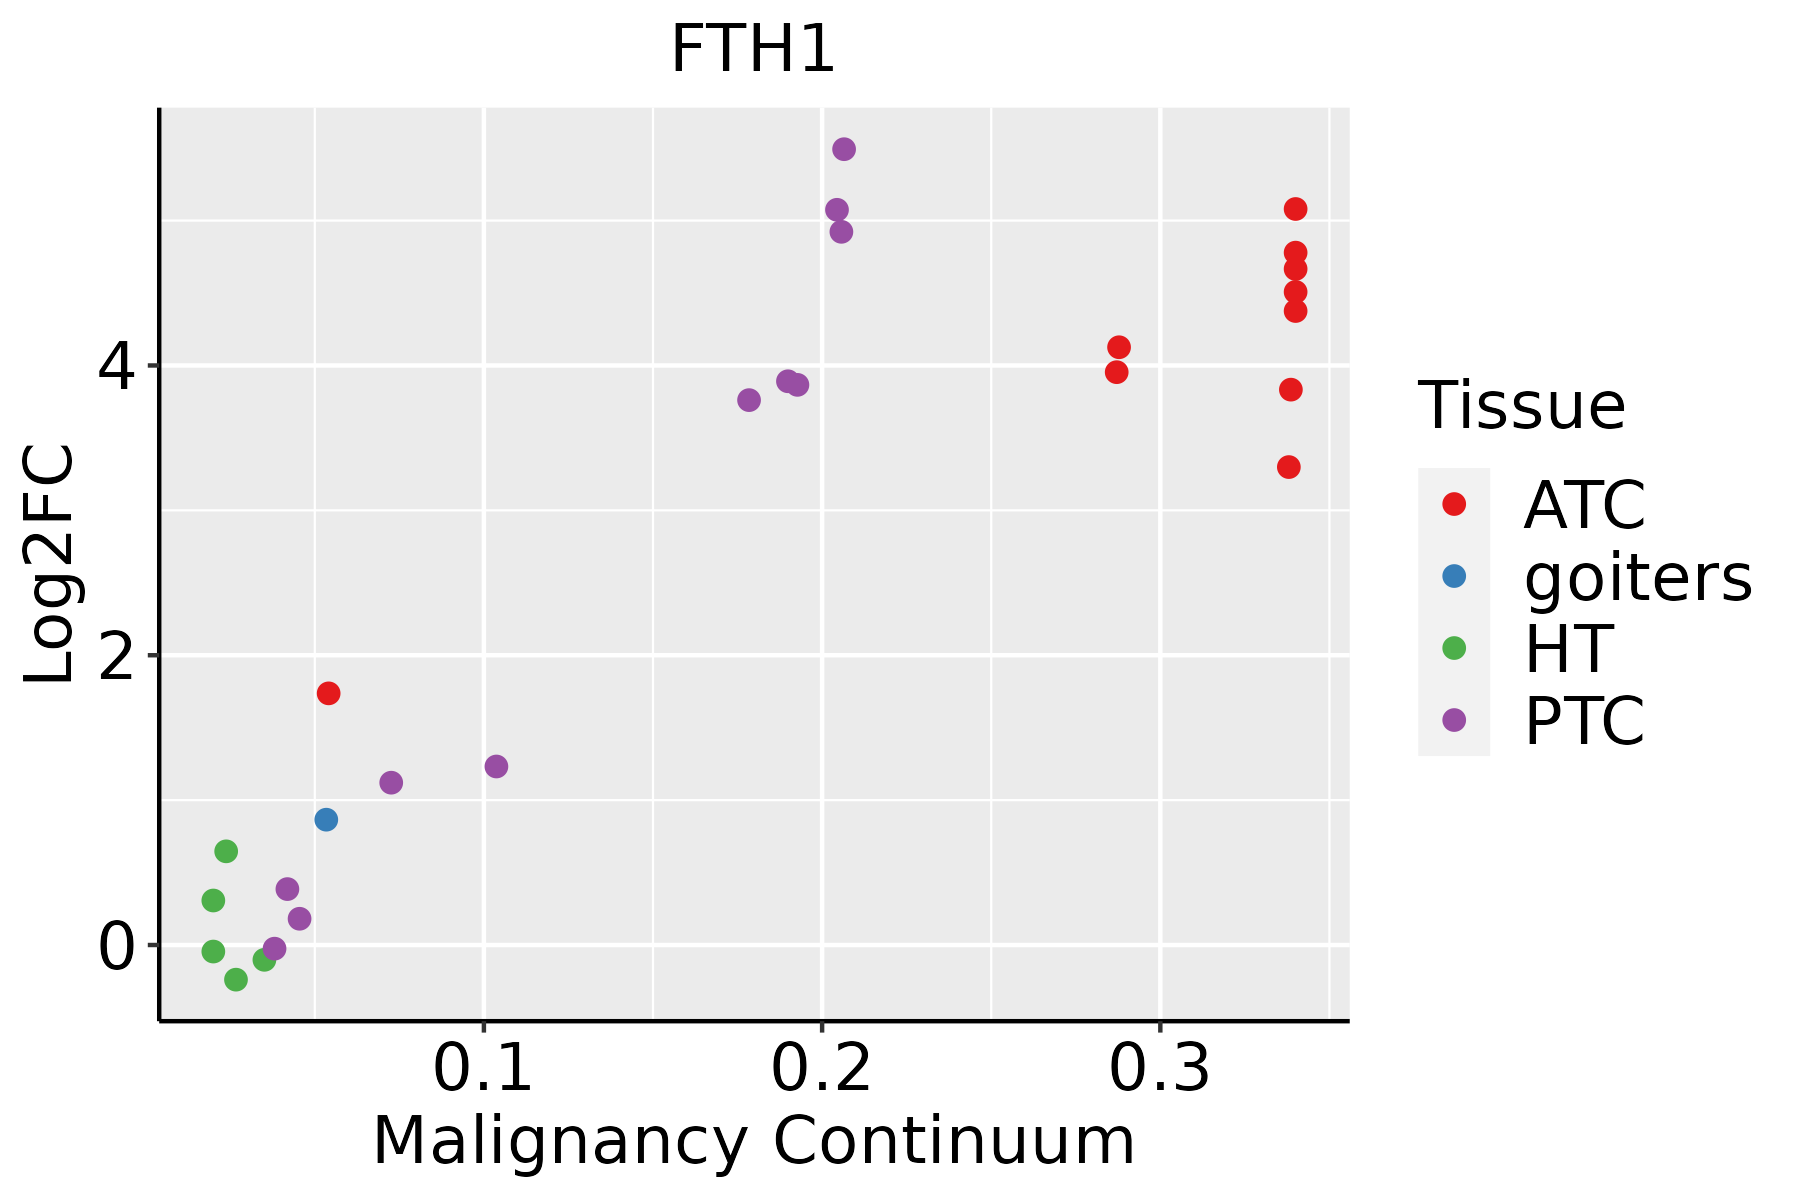 | ATC: Anaplastic thyroid cancer |
| HT: Hashimoto's thyroiditis | ||
| PTC: Papillary thyroid cancer |
| ∗log2FC in expression of this searched gene in stem-like cells from each diseased tissue sample relative to stem-like cells in normal samples in each tissue plotted against the malignancy continuum. Samples are colored based on if they are from different disease stage. |
Top |
Malignant transformation related pathway analysis |
| Find out the enriched GO biological processes and KEGG pathways involved in transition from healthy to precancer to cancer |
| Tissue | Disease Stage | Enriched GO biological Processes |
| Colorectum | AD |  |
| Colorectum | SER |  |
| Colorectum | MSS |  |
| Colorectum | MSI-H |  |
| Colorectum | FAP |  |
| ∗Top 15 enriched GO BP terms are showed in the bar plot of each disease state in each tissue. Each row represents a significant GO biological process which is colored according to the -log10(p.adjust). |
| Page: 1 2 3 4 5 6 7 8 9 |
| GO ID | Tissue | Disease Stage | Description | Gene Ratio | Bg Ratio | pvalue | p.adjust | Count |
| GO:005123531 | Oral cavity | NEOLP | maintenance of location | 62/2005 | 327/18723 | 5.41e-06 | 1.12e-04 | 62 |
| GO:005165132 | Oral cavity | NEOLP | maintenance of location in cell | 41/2005 | 214/18723 | 1.57e-04 | 1.77e-03 | 41 |
| GO:004814531 | Oral cavity | NEOLP | regulation of fibroblast proliferation | 17/2005 | 80/18723 | 4.25e-03 | 2.40e-02 | 17 |
| GO:004814431 | Oral cavity | NEOLP | fibroblast proliferation | 17/2005 | 81/18723 | 4.85e-03 | 2.64e-02 | 17 |
| GO:00550769 | Prostate | BPH | transition metal ion homeostasis | 43/3107 | 138/18723 | 1.66e-05 | 2.07e-04 | 43 |
| GO:00550727 | Prostate | BPH | iron ion homeostasis | 29/3107 | 85/18723 | 6.22e-05 | 6.23e-04 | 29 |
| GO:005165118 | Prostate | BPH | maintenance of location in cell | 58/3107 | 214/18723 | 6.67e-05 | 6.61e-04 | 58 |
| GO:005123516 | Prostate | BPH | maintenance of location | 80/3107 | 327/18723 | 1.55e-04 | 1.36e-03 | 80 |
| GO:00469167 | Prostate | BPH | cellular transition metal ion homeostasis | 35/3107 | 115/18723 | 1.64e-04 | 1.42e-03 | 35 |
| GO:00068793 | Prostate | BPH | cellular iron ion homeostasis | 21/3107 | 67/18723 | 2.09e-03 | 1.17e-02 | 21 |
| GO:00481456 | Prostate | BPH | regulation of fibroblast proliferation | 22/3107 | 80/18723 | 9.50e-03 | 4.03e-02 | 22 |
| GO:00481445 | Prostate | BPH | fibroblast proliferation | 22/3107 | 81/18723 | 1.10e-02 | 4.53e-02 | 22 |
| GO:005507615 | Prostate | Tumor | transition metal ion homeostasis | 45/3246 | 138/18723 | 9.11e-06 | 1.33e-04 | 45 |
| GO:005507213 | Prostate | Tumor | iron ion homeostasis | 31/3246 | 85/18723 | 1.89e-05 | 2.47e-04 | 31 |
| GO:004691614 | Prostate | Tumor | cellular transition metal ion homeostasis | 37/3246 | 115/18723 | 7.56e-05 | 7.88e-04 | 37 |
| GO:000687911 | Prostate | Tumor | cellular iron ion homeostasis | 23/3246 | 67/18723 | 5.95e-04 | 4.27e-03 | 23 |
| GO:005165119 | Prostate | Tumor | maintenance of location in cell | 56/3246 | 214/18723 | 7.31e-04 | 5.08e-03 | 56 |
| GO:005123517 | Prostate | Tumor | maintenance of location | 78/3246 | 327/18723 | 1.56e-03 | 9.55e-03 | 78 |
| GO:004814512 | Prostate | Tumor | regulation of fibroblast proliferation | 24/3246 | 80/18723 | 3.69e-03 | 1.89e-02 | 24 |
| GO:004814412 | Prostate | Tumor | fibroblast proliferation | 24/3246 | 81/18723 | 4.40e-03 | 2.19e-02 | 24 |
| Page: 1 2 3 4 5 6 7 8 9 10 11 |
| Pathway ID | Tissue | Disease Stage | Description | Gene Ratio | Bg Ratio | pvalue | p.adjust | qvalue | Count |
| hsa0421610 | Breast | Precancer | Ferroptosis | 11/684 | 41/8465 | 2.95e-04 | 2.45e-03 | 1.88e-03 | 11 |
| hsa0421613 | Breast | Precancer | Ferroptosis | 11/684 | 41/8465 | 2.95e-04 | 2.45e-03 | 1.88e-03 | 11 |
| hsa0421623 | Breast | IDC | Ferroptosis | 12/867 | 41/8465 | 5.87e-04 | 4.89e-03 | 3.66e-03 | 12 |
| hsa0497812 | Breast | IDC | Mineral absorption | 13/867 | 60/8465 | 6.73e-03 | 3.42e-02 | 2.56e-02 | 13 |
| hsa0421633 | Breast | IDC | Ferroptosis | 12/867 | 41/8465 | 5.87e-04 | 4.89e-03 | 3.66e-03 | 12 |
| hsa0497813 | Breast | IDC | Mineral absorption | 13/867 | 60/8465 | 6.73e-03 | 3.42e-02 | 2.56e-02 | 13 |
| hsa0497821 | Breast | DCIS | Mineral absorption | 13/846 | 60/8465 | 5.48e-03 | 2.81e-02 | 2.07e-02 | 13 |
| hsa0497831 | Breast | DCIS | Mineral absorption | 13/846 | 60/8465 | 5.48e-03 | 2.81e-02 | 2.07e-02 | 13 |
| hsa0421614 | Cervix | CC | Ferroptosis | 14/1267 | 41/8465 | 1.75e-03 | 7.21e-03 | 4.26e-03 | 14 |
| hsa0421615 | Cervix | CC | Ferroptosis | 14/1267 | 41/8465 | 1.75e-03 | 7.21e-03 | 4.26e-03 | 14 |
| hsa0421624 | Cervix | N_HPV | Ferroptosis | 6/349 | 41/8465 | 6.24e-03 | 3.24e-02 | 2.54e-02 | 6 |
| hsa0421634 | Cervix | N_HPV | Ferroptosis | 6/349 | 41/8465 | 6.24e-03 | 3.24e-02 | 2.54e-02 | 6 |
| hsa04216 | Colorectum | AD | Ferroptosis | 21/2092 | 41/8465 | 2.23e-04 | 1.78e-03 | 1.13e-03 | 21 |
| hsa042161 | Colorectum | AD | Ferroptosis | 21/2092 | 41/8465 | 2.23e-04 | 1.78e-03 | 1.13e-03 | 21 |
| hsa04217 | Colorectum | SER | Necroptosis | 47/1580 | 159/8465 | 5.21e-04 | 4.44e-03 | 3.22e-03 | 47 |
| hsa042171 | Colorectum | SER | Necroptosis | 47/1580 | 159/8465 | 5.21e-04 | 4.44e-03 | 3.22e-03 | 47 |
| hsa042162 | Colorectum | MSS | Ferroptosis | 18/1875 | 41/8465 | 1.53e-03 | 8.53e-03 | 5.23e-03 | 18 |
| hsa042163 | Colorectum | MSS | Ferroptosis | 18/1875 | 41/8465 | 1.53e-03 | 8.53e-03 | 5.23e-03 | 18 |
| hsa042164 | Colorectum | FAP | Ferroptosis | 18/1404 | 41/8465 | 3.49e-05 | 3.65e-04 | 2.22e-04 | 18 |
| hsa042165 | Colorectum | FAP | Ferroptosis | 18/1404 | 41/8465 | 3.49e-05 | 3.65e-04 | 2.22e-04 | 18 |
| Page: 1 2 3 4 |
Top |
Cell-cell communication analysis |
| Identification of potential cell-cell interactions between two cell types and their ligand-receptor pairs for different disease states |
| Ligand | Receptor | LRpair | Pathway | Tissue | Disease Stage |
| Page: 1 |
Top |
Single-cell gene regulatory network inference analysis |
| Find out the significant the regulons (TFs) and the target genes of each regulon across cell types for different disease states |
| TF | Cell Type | Tissue | Disease Stage | Target Gene | RSS | Regulon Activity |
| ∗The dot plots of a searched regulon are shown for all cell subpopulations in each disease state of each tissue based on the regulon specific score inferred using pySCENIC and by calculating the average expression. |
| Page: 1 |
Top |
Somatic mutation of malignant transformation related genes |
| Annotation of somatic variants for genes involved in malignant transformation |
| Hugo Symbol | Variant Class | Variant Classification | dbSNP RS | HGVSc | HGVSp | HGVSp Short | SWISSPROT | BIOTYPE | SIFT | PolyPhen | Tumor Sample Barcode | Tissue | Histology | Sex | Age | Stage | Therapy Types | Drugs | Outcome |
| FTH1 | SNV | Missense_Mutation | novel | c.244T>C | p.Phe82Leu | p.F82L | P02794 | protein_coding | tolerated(0.29) | benign(0.005) | TCGA-A7-A0CJ-01 | Breast | breast invasive carcinoma | Female | <65 | I/II | Chemotherapy | cytoxan | SD |
| FTH1 | insertion | Frame_Shift_Ins | novel | c.241_242insCCCTCAGGCAGAACTCCTCAAAGCCAGCT | p.Ile81ThrfsTer28 | p.I81Tfs*28 | P02794 | protein_coding | TCGA-A7-A0CJ-01 | Breast | breast invasive carcinoma | Female | <65 | I/II | Chemotherapy | cytoxan | SD | ||
| FTH1 | insertion | Nonsense_Mutation | novel | c.337_338insTAACCATTTGATTCAGGCTGTTGTAG | p.Gln113LeufsTer4 | p.Q113Lfs*4 | P02794 | protein_coding | TCGA-BH-A0DZ-01 | Breast | breast invasive carcinoma | Female | <65 | I/II | Chemotherapy | docetaxel | SD | ||
| FTH1 | SNV | Missense_Mutation | novel | c.14N>T | p.Ser5Phe | p.S5F | P02794 | protein_coding | tolerated(0.09) | benign(0.012) | TCGA-2W-A8YY-01 | Cervix | cervical & endocervical cancer | Female | <65 | I/II | Chemotherapy | cisplatin | CR |
| FTH1 | SNV | Missense_Mutation | novel | c.196C>T | p.His66Tyr | p.H66Y | P02794 | protein_coding | deleterious(0.02) | probably_damaging(0.972) | TCGA-AA-A00O-01 | Colorectum | colon adenocarcinoma | Female | >=65 | III/IV | Unknown | Unknown | SD |
| FTH1 | SNV | Missense_Mutation | c.332N>C | p.Val111Ala | p.V111A | P02794 | protein_coding | deleterious(0.02) | possibly_damaging(0.599) | TCGA-G4-6304-01 | Colorectum | colon adenocarcinoma | Female | >=65 | I/II | Chemotherapy | fluorouracil | PD | |
| FTH1 | SNV | Missense_Mutation | novel | c.261G>T | p.Lys87Asn | p.K87N | P02794 | protein_coding | deleterious(0.02) | possibly_damaging(0.591) | TCGA-AX-A0J1-01 | Endometrium | uterine corpus endometrioid carcinoma | Female | >=65 | I/II | Unknown | Unknown | SD |
| FTH1 | SNV | Missense_Mutation | novel | c.110N>T | p.Ser37Phe | p.S37F | P02794 | protein_coding | deleterious(0.01) | possibly_damaging(0.778) | TCGA-AX-A2IN-01 | Endometrium | uterine corpus endometrioid carcinoma | Female | <65 | I/II | Unknown | Unknown | PD |
| FTH1 | SNV | Missense_Mutation | c.484N>T | p.Pro162Ser | p.P162S | P02794 | protein_coding | tolerated(0.06) | benign(0.007) | TCGA-BS-A0UV-01 | Endometrium | uterine corpus endometrioid carcinoma | Female | <65 | III/IV | Unknown | Unknown | SD | |
| FTH1 | SNV | Missense_Mutation | rs755508306 | c.500N>T | p.Ala167Val | p.A167V | P02794 | protein_coding | deleterious(0.01) | benign(0.063) | TCGA-D1-A17Q-01 | Endometrium | uterine corpus endometrioid carcinoma | Female | <65 | I/II | Unknown | Unknown | SD |
| Page: 1 2 |
Top |
Related drugs of malignant transformation related genes |
| Identification of chemicals and drugs interact with genes involved in malignant transfromation |
| (DGIdb 4.0) |
| Entrez ID | Symbol | Category | Interaction Types | Drug Claim Name | Drug Name | PMIDs |
| 2495 | FTH1 | NA | Ferritarg P |
| Page: 1 |

Copyright 2023-Present -The University of Texas Health Science Center at Houston |