
|
|||||
|
 | |
| |
| |
| |
| |
| |
|
Gene: FBXO32 |
Gene summary for FBXO32 |
| Gene information | Species | Human | Gene symbol | FBXO32 | Gene ID | 114907 |
| Gene name | F-box protein 32 | |
| Gene Alias | Fbx32 | |
| Cytomap | 8q24.13 | |
| Gene Type | protein-coding | GO ID | GO:0003008 | UniProtAcc | Q969P5 |
Top |
Malignant transformation analysis |
| Identification of the aberrant gene expression in precancerous and cancerous lesions by comparing the gene expression of stem-like cells in diseased tissues with normal stem cells |
| Entrez ID | Symbol | Replicates | Species | Organ | Tissue | Adj P-value | Log2FC | Malignancy |
| 114907 | FBXO32 | GSM4909281 | Human | Breast | IDC | 1.29e-11 | 5.24e-01 | 0.21 |
| 114907 | FBXO32 | GSM4909285 | Human | Breast | IDC | 2.22e-08 | -4.06e-01 | 0.21 |
| 114907 | FBXO32 | GSM4909286 | Human | Breast | IDC | 9.38e-04 | -3.21e-01 | 0.1081 |
| 114907 | FBXO32 | GSM4909290 | Human | Breast | IDC | 2.94e-12 | -4.96e-01 | 0.2096 |
| 114907 | FBXO32 | GSM4909291 | Human | Breast | IDC | 9.19e-14 | -5.42e-01 | 0.1753 |
| 114907 | FBXO32 | GSM4909293 | Human | Breast | IDC | 6.34e-03 | -8.48e-02 | 0.1581 |
| 114907 | FBXO32 | GSM4909294 | Human | Breast | IDC | 8.48e-04 | -3.52e-01 | 0.2022 |
| 114907 | FBXO32 | GSM4909295 | Human | Breast | IDC | 1.43e-04 | 5.86e-01 | 0.0898 |
| 114907 | FBXO32 | GSM4909296 | Human | Breast | IDC | 1.08e-03 | -3.40e-01 | 0.1524 |
| 114907 | FBXO32 | GSM4909297 | Human | Breast | IDC | 1.17e-10 | -4.15e-01 | 0.1517 |
| 114907 | FBXO32 | GSM4909298 | Human | Breast | IDC | 3.87e-04 | -3.55e-01 | 0.1551 |
| 114907 | FBXO32 | GSM4909301 | Human | Breast | IDC | 3.15e-16 | -5.32e-01 | 0.1577 |
| 114907 | FBXO32 | GSM4909302 | Human | Breast | IDC | 1.92e-05 | -3.46e-01 | 0.1545 |
| 114907 | FBXO32 | GSM4909308 | Human | Breast | IDC | 7.60e-04 | -2.97e-01 | 0.158 |
| 114907 | FBXO32 | GSM4909311 | Human | Breast | IDC | 1.85e-13 | -4.06e-01 | 0.1534 |
| 114907 | FBXO32 | GSM4909315 | Human | Breast | IDC | 7.53e-08 | -4.52e-01 | 0.21 |
| 114907 | FBXO32 | GSM4909316 | Human | Breast | IDC | 3.97e-09 | -5.62e-01 | 0.21 |
| 114907 | FBXO32 | GSM4909319 | Human | Breast | IDC | 1.01e-20 | -5.06e-01 | 0.1563 |
| 114907 | FBXO32 | GSM4909320 | Human | Breast | IDC | 2.51e-05 | -4.25e-01 | 0.1575 |
| 114907 | FBXO32 | GSM4909321 | Human | Breast | IDC | 2.73e-16 | -4.93e-01 | 0.1559 |
| Page: 1 2 3 4 5 6 7 8 |
| Tissue | Expression Dynamics | Abbreviation |
| Breast | 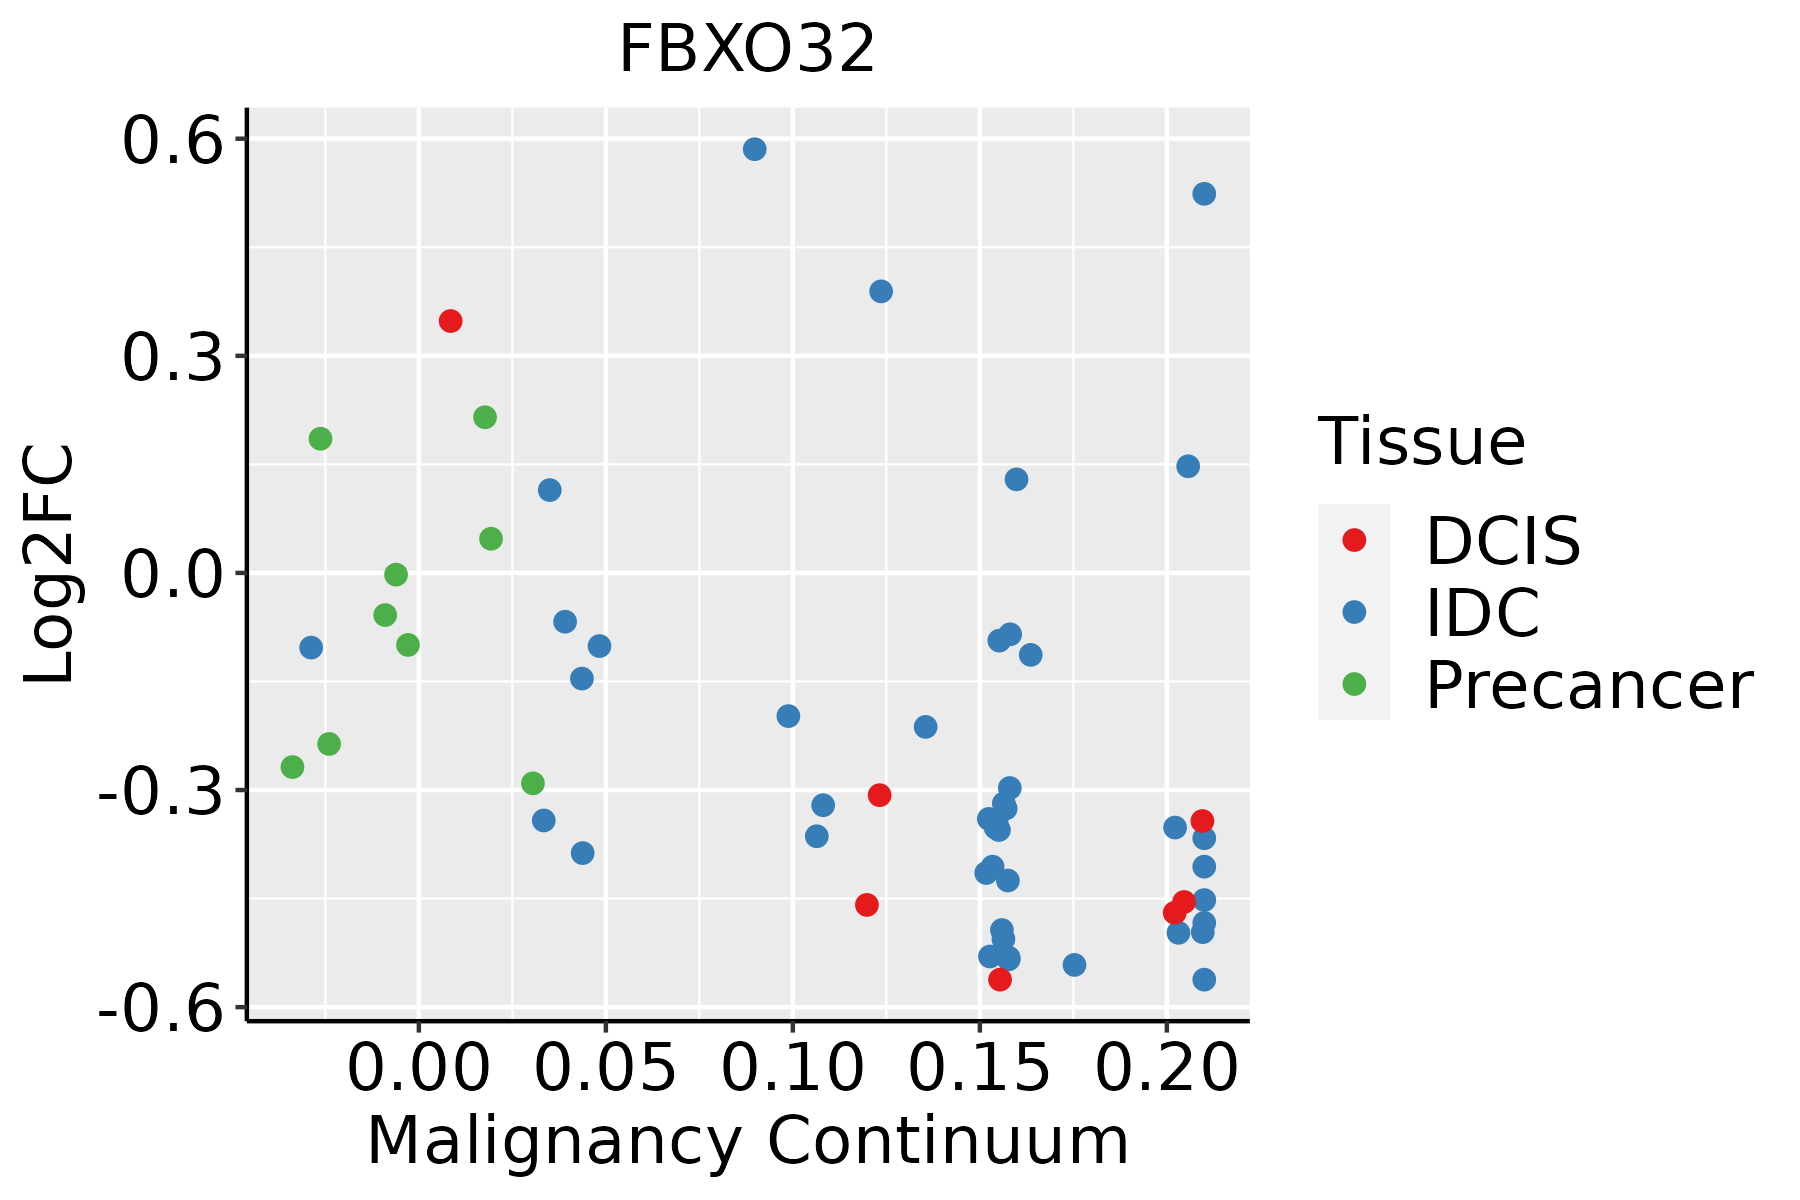 | IDC: Invasive ductal carcinoma |
| DCIS: Ductal carcinoma in situ | ||
| Precancer(BRCA1-mut): Precancerous lesion from BRCA1 mutation carriers | ||
| Colorectum (GSE201348) |  | FAP: Familial adenomatous polyposis |
| CRC: Colorectal cancer | ||
| Colorectum (HTA11) |  | AD: Adenomas |
| SER: Sessile serrated lesions | ||
| MSI-H: Microsatellite-high colorectal cancer | ||
| MSS: Microsatellite stable colorectal cancer | ||
| Esophagus | 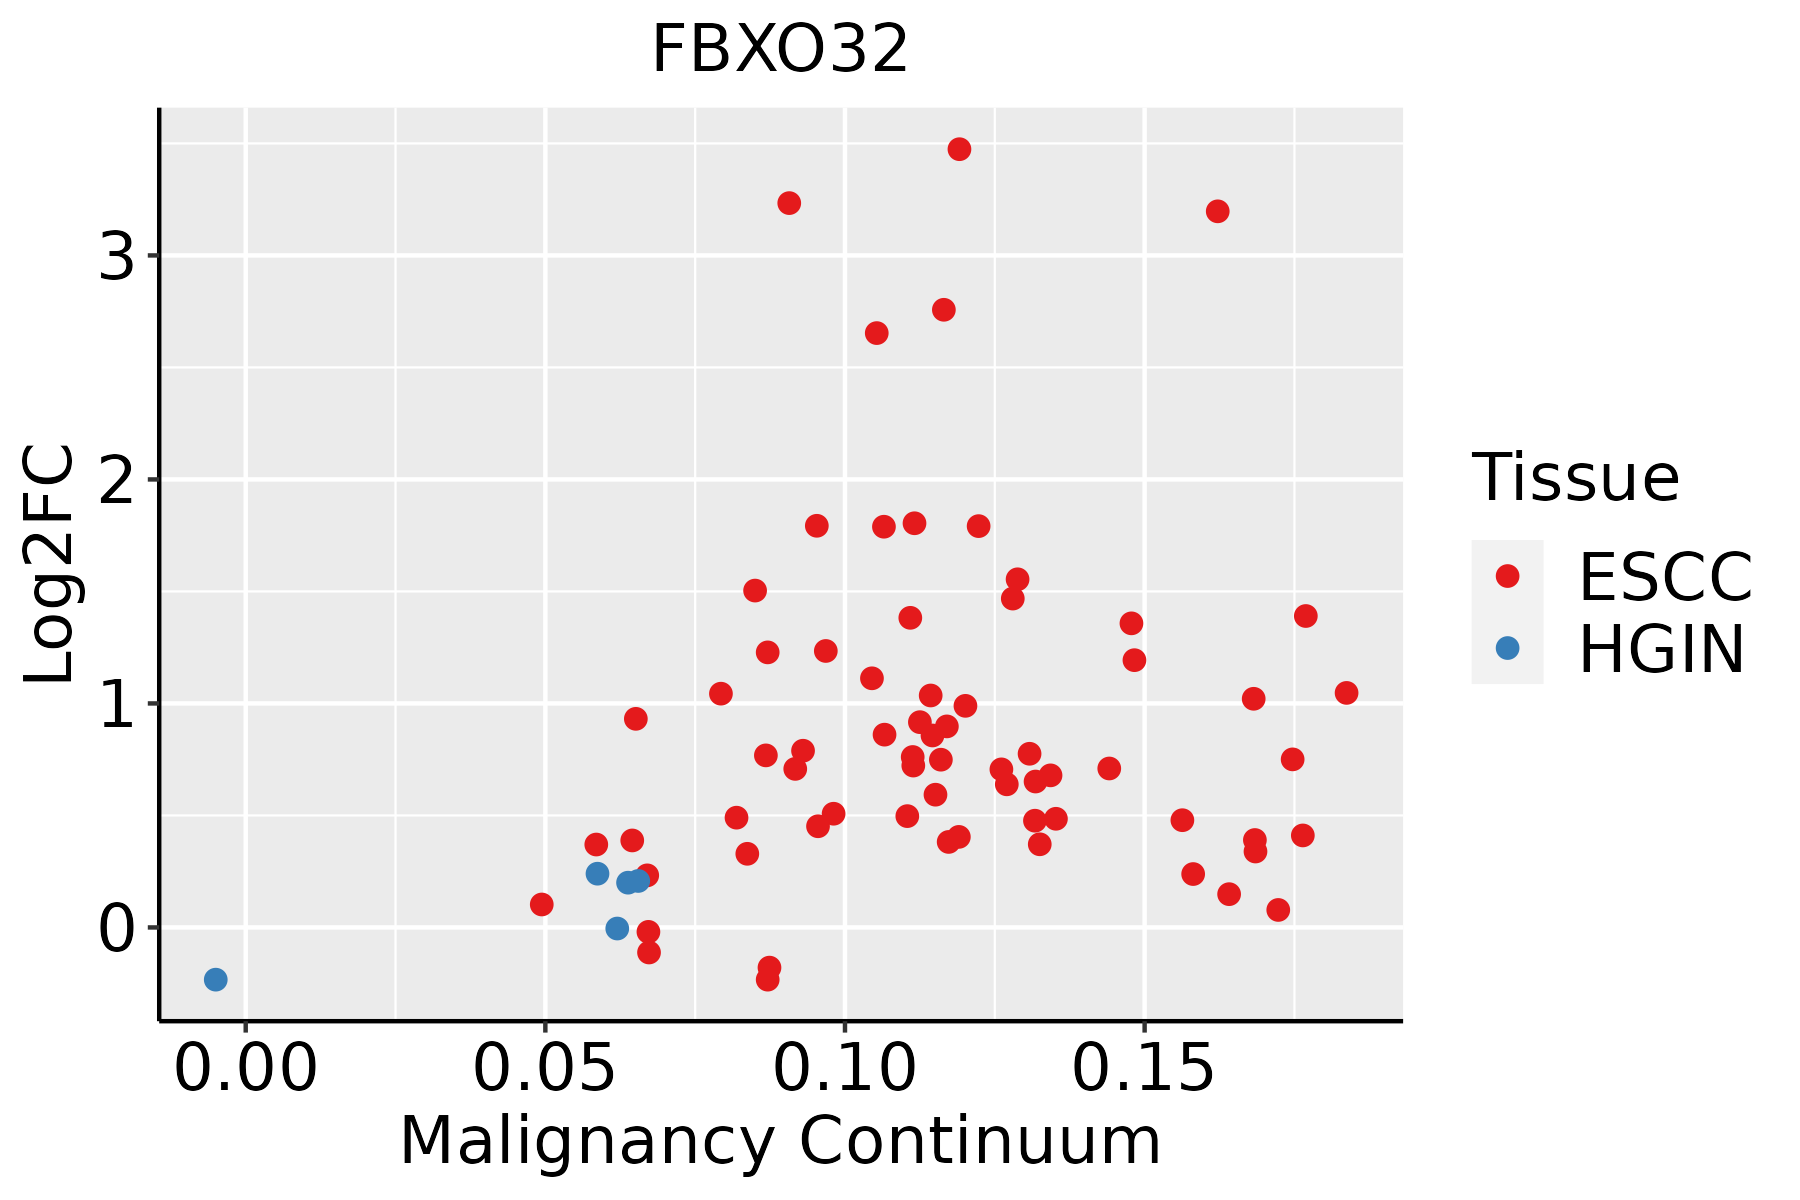 | ESCC: Esophageal squamous cell carcinoma |
| HGIN: High-grade intraepithelial neoplasias | ||
| LGIN: Low-grade intraepithelial neoplasias | ||
| Liver | 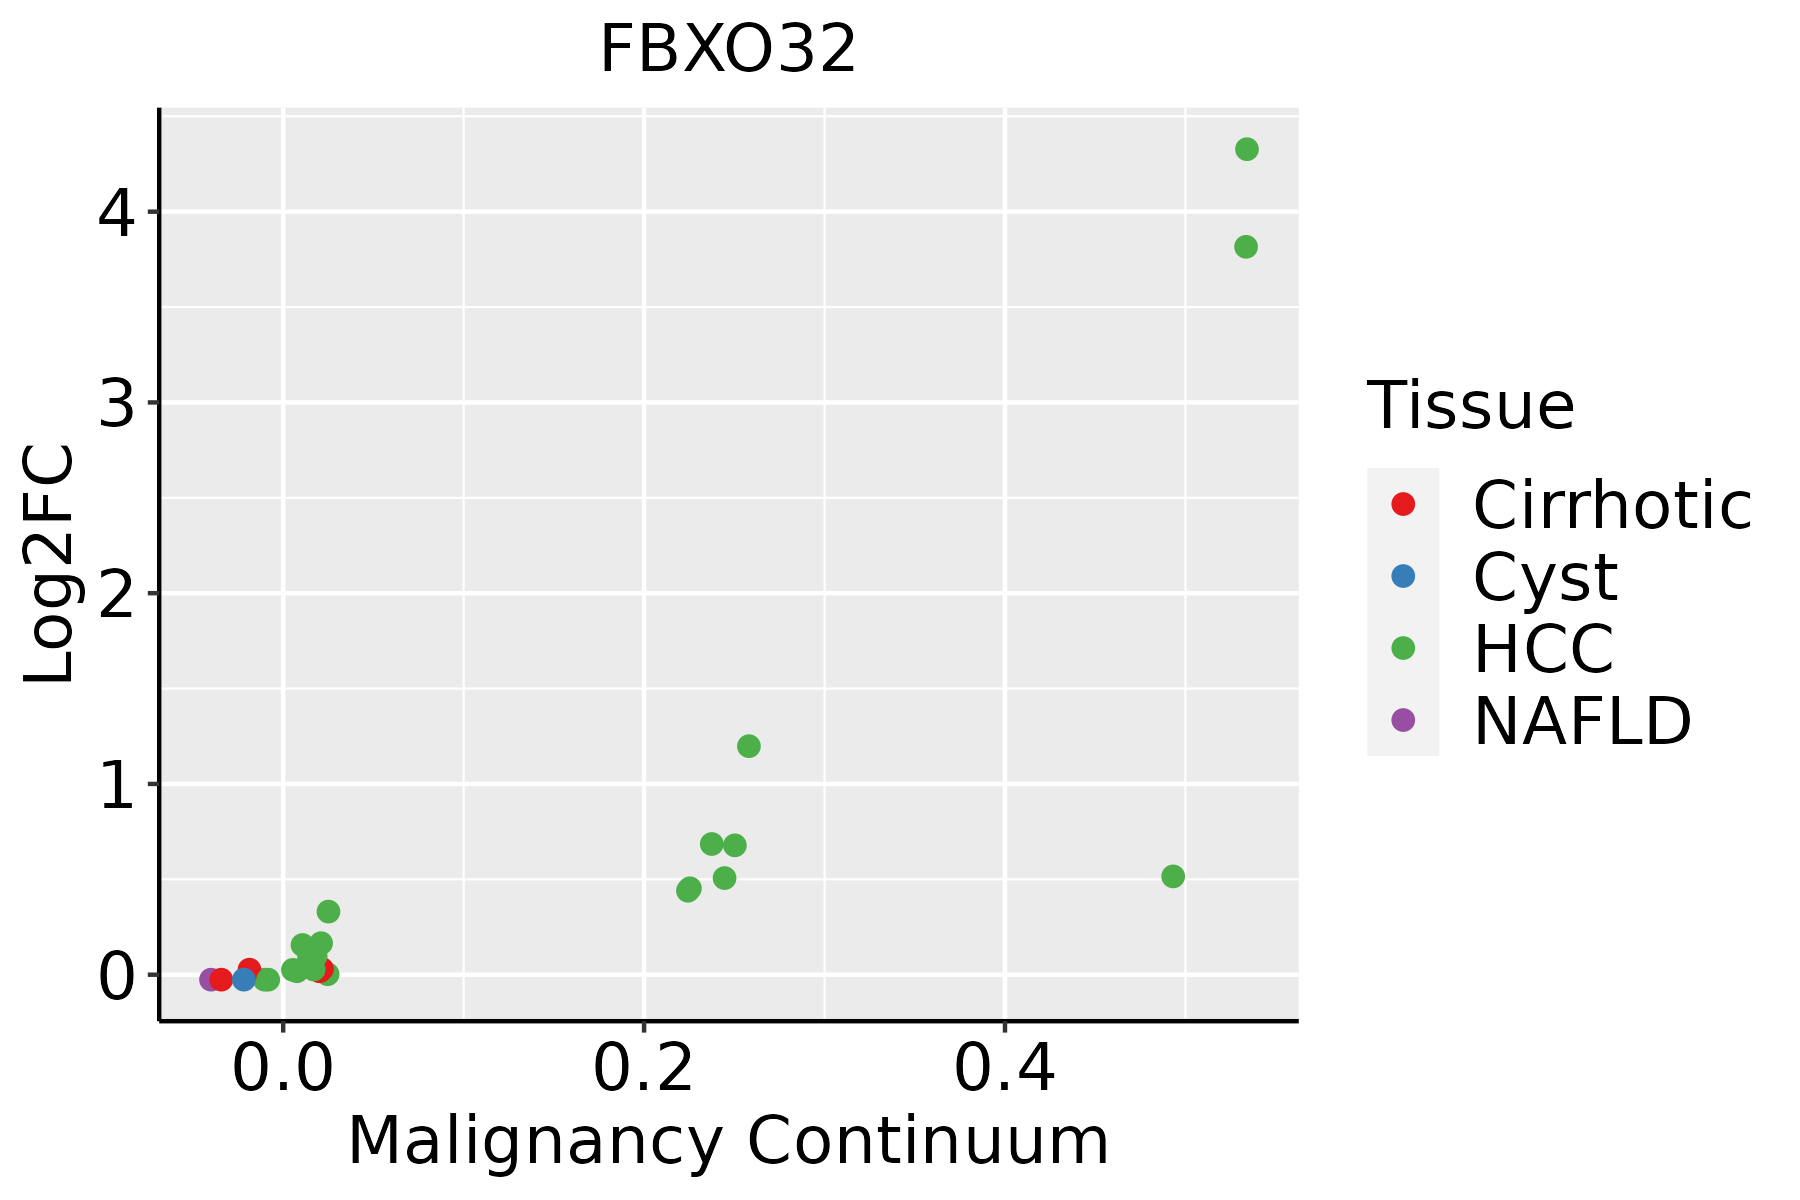 | HCC: Hepatocellular carcinoma |
| NAFLD: Non-alcoholic fatty liver disease | ||
| Lung |  | AAH: Atypical adenomatous hyperplasia |
| AIS: Adenocarcinoma in situ | ||
| IAC: Invasive lung adenocarcinoma | ||
| MIA: Minimally invasive adenocarcinoma | ||
| Oral Cavity | 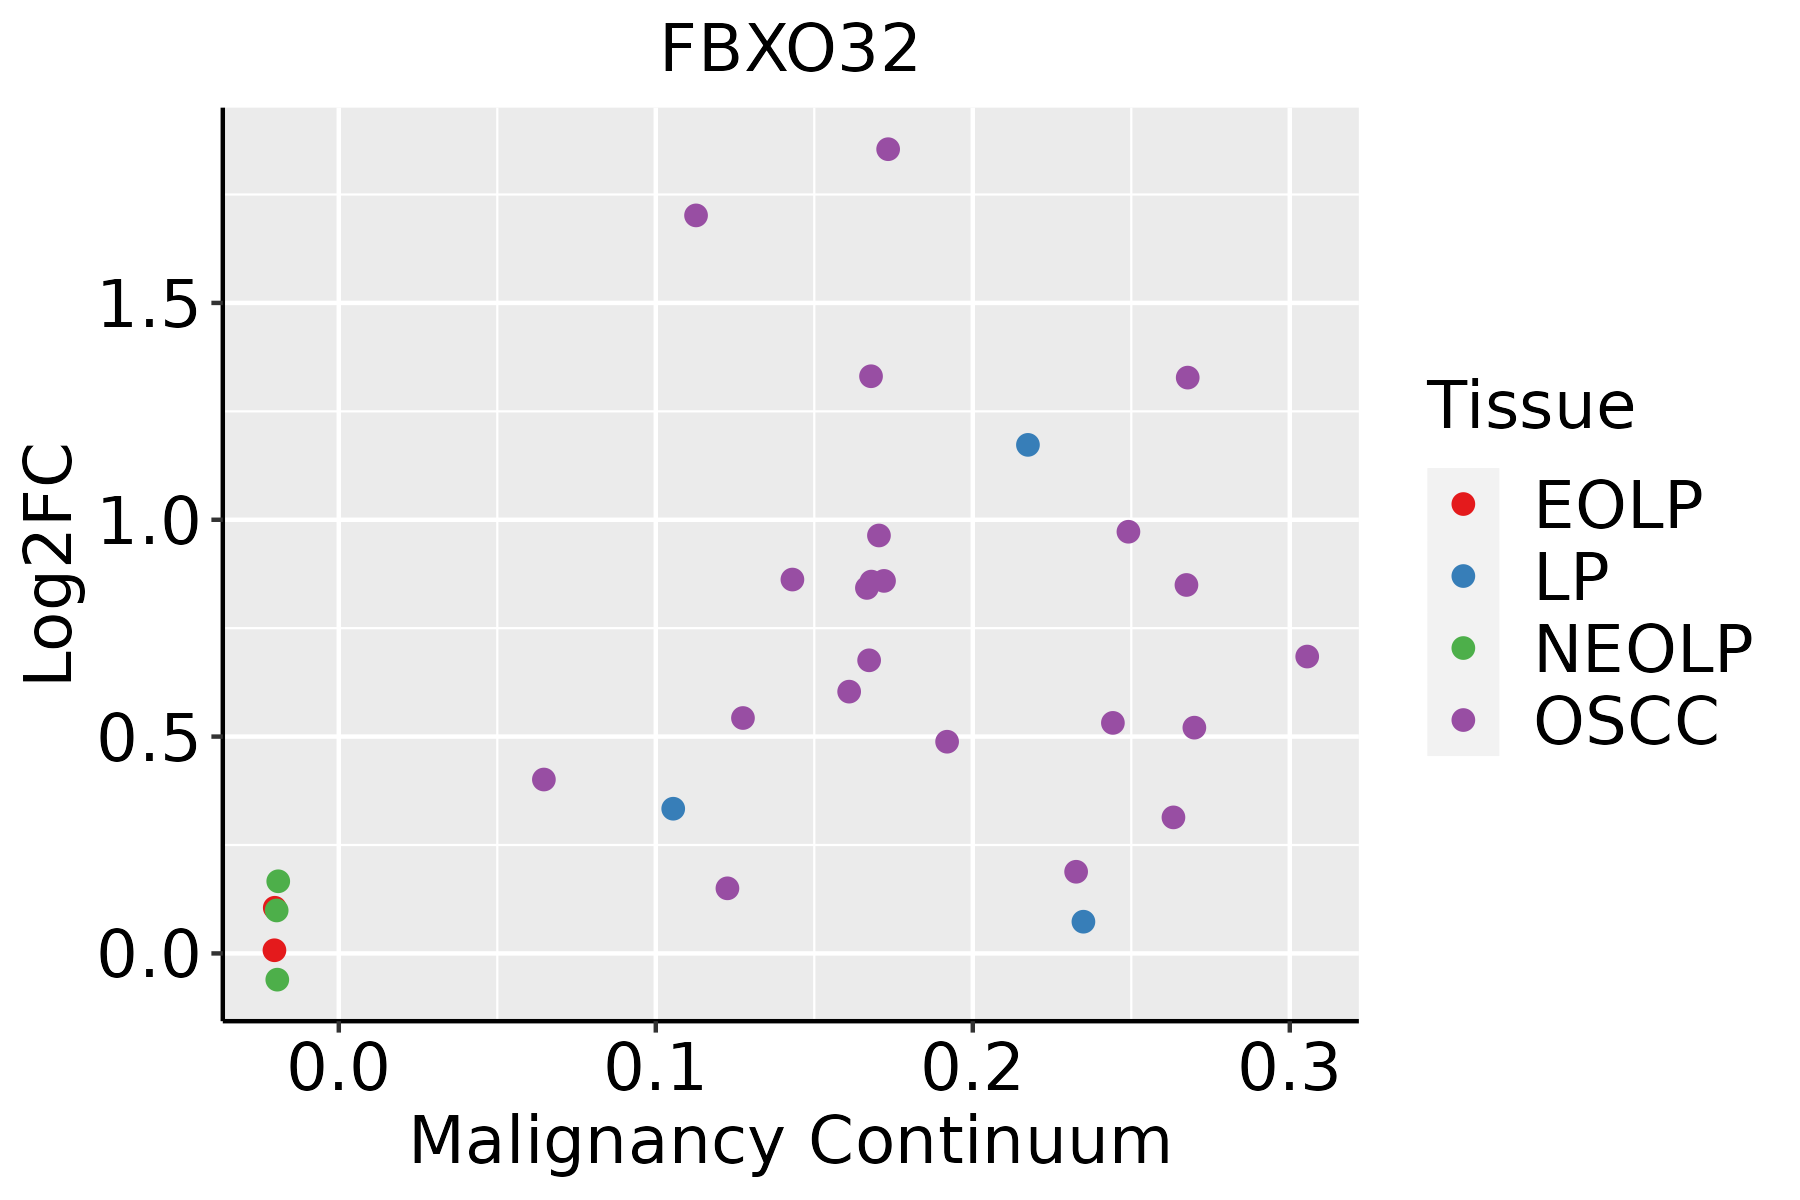 | EOLP: Erosive Oral lichen planus |
| LP: leukoplakia | ||
| NEOLP: Non-erosive oral lichen planus | ||
| OSCC: Oral squamous cell carcinoma | ||
| Prostate | 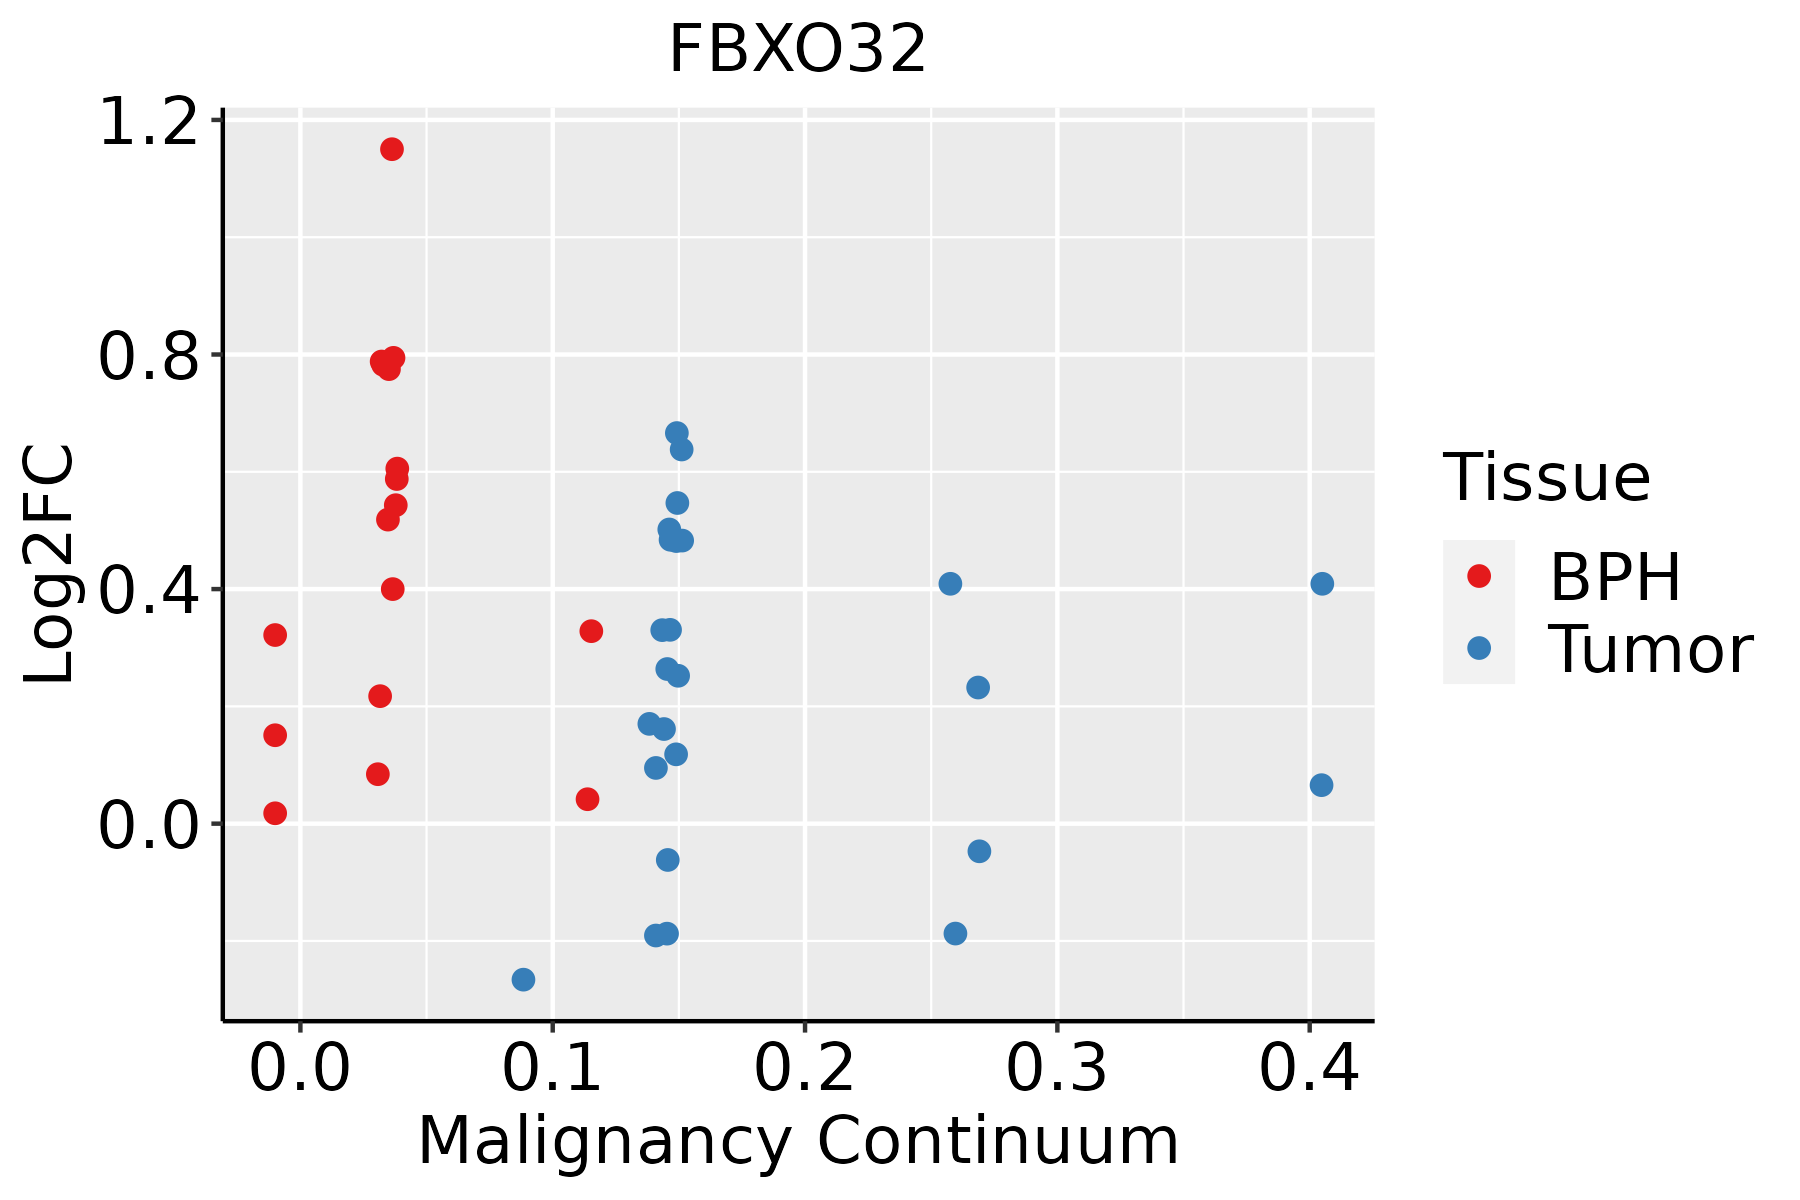 | BPH: Benign Prostatic Hyperplasia |
| Skin | 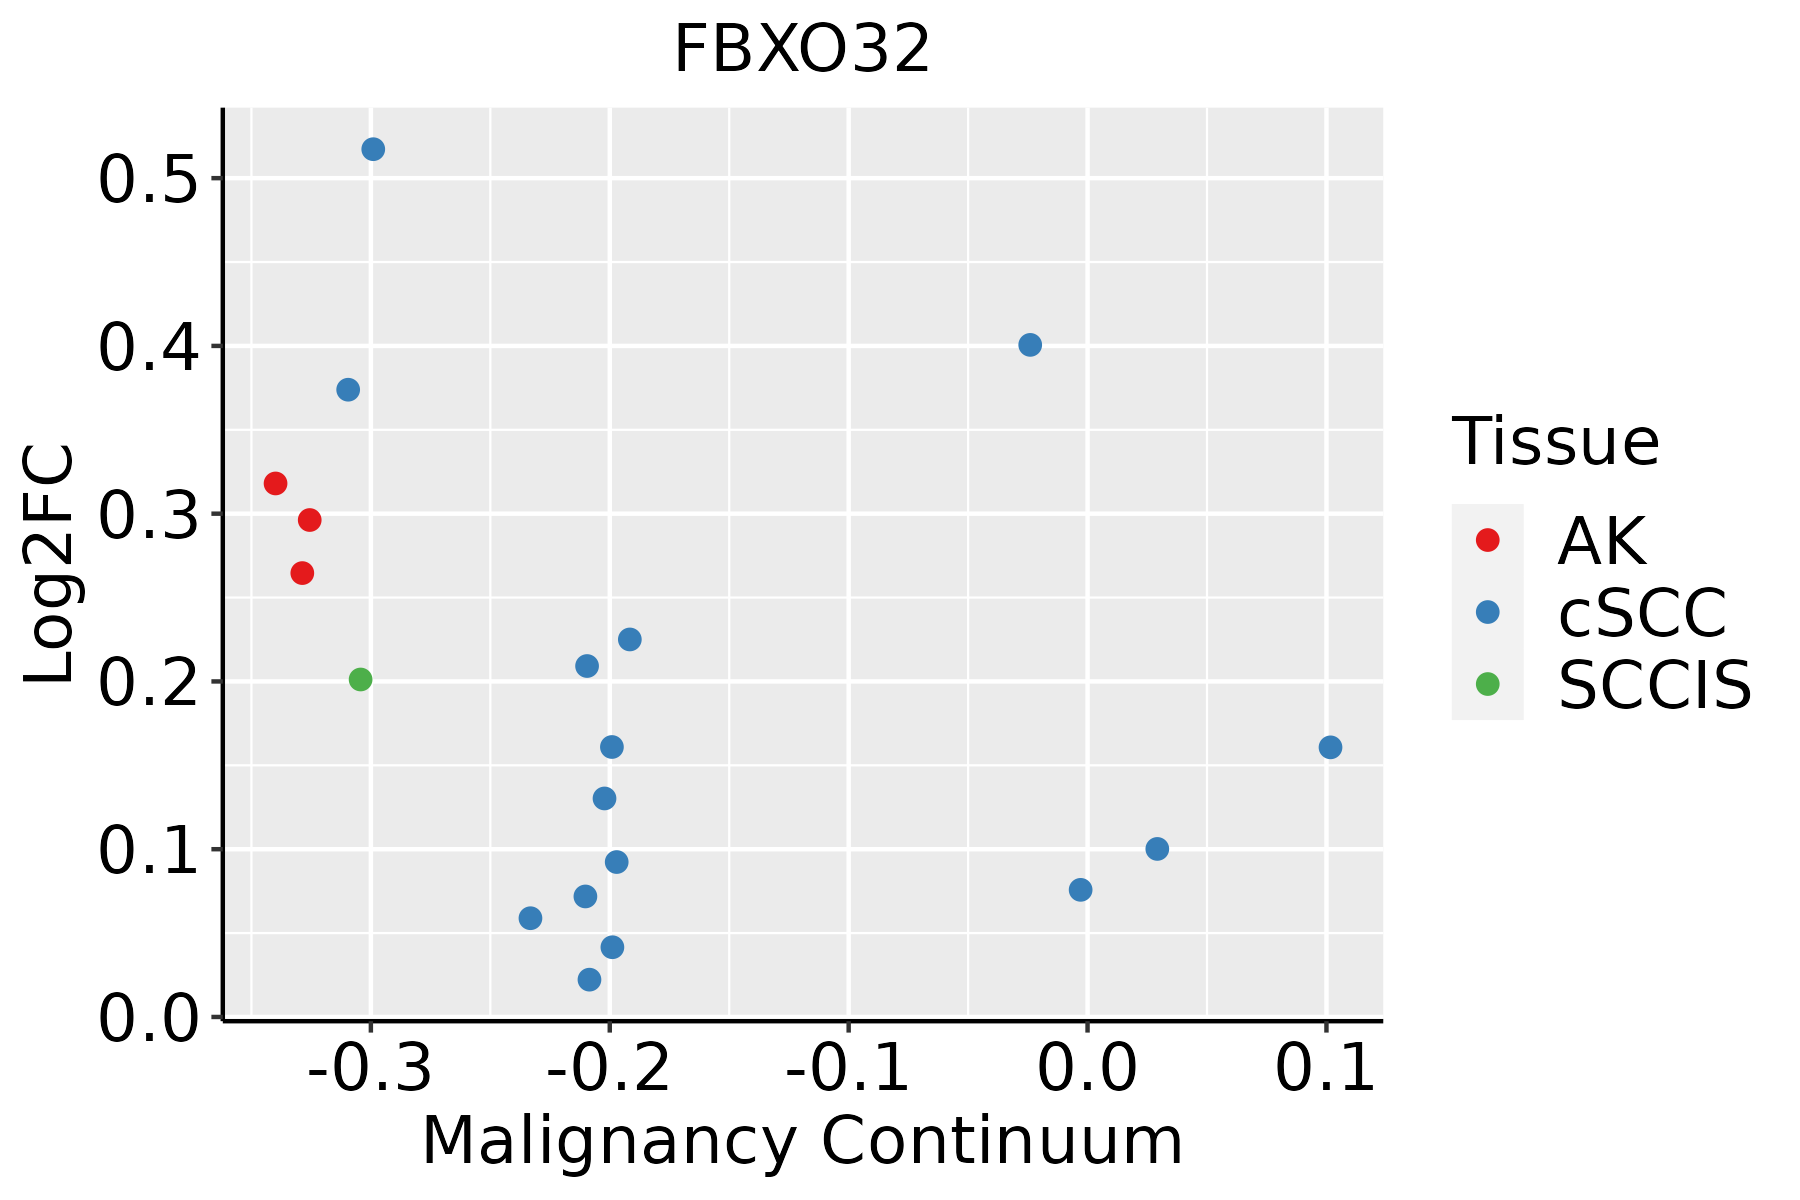 | AK: Actinic keratosis |
| cSCC: Cutaneous squamous cell carcinoma | ||
| SCCIS:squamous cell carcinoma in situ |
| ∗log2FC in expression of this searched gene in stem-like cells from each diseased tissue sample relative to stem-like cells in normal samples in each tissue plotted against the malignancy continuum. Samples are colored based on if they are from different disease stage. |
Top |
Malignant transformation related pathway analysis |
| Find out the enriched GO biological processes and KEGG pathways involved in transition from healthy to precancer to cancer |
| Tissue | Disease Stage | Enriched GO biological Processes |
| Colorectum | AD |  |
| Colorectum | SER |  |
| Colorectum | MSS |  |
| Colorectum | MSI-H |  |
| Colorectum | FAP |  |
| ∗Top 15 enriched GO BP terms are showed in the bar plot of each disease state in each tissue. Each row represents a significant GO biological process which is colored according to the -log10(p.adjust). |
| Page: 1 2 3 4 5 6 7 8 9 |
| GO ID | Tissue | Disease Stage | Description | Gene Ratio | Bg Ratio | pvalue | p.adjust | Count |
| GO:007154912 | Prostate | Tumor | cellular response to dexamethasone stimulus | 12/3246 | 29/18723 | 2.02e-03 | 1.16e-02 | 12 |
| GO:004854528 | Skin | AK | response to steroid hormone | 73/1910 | 339/18723 | 4.51e-10 | 5.24e-08 | 73 |
| GO:007138326 | Skin | AK | cellular response to steroid hormone stimulus | 46/1910 | 204/18723 | 1.79e-07 | 7.37e-06 | 46 |
| GO:190165425 | Skin | AK | response to ketone | 43/1910 | 194/18723 | 7.32e-07 | 2.49e-05 | 43 |
| GO:003196025 | Skin | AK | response to corticosteroid | 37/1910 | 167/18723 | 4.28e-06 | 1.05e-04 | 37 |
| GO:005138425 | Skin | AK | response to glucocorticoid | 33/1910 | 148/18723 | 1.20e-05 | 2.46e-04 | 33 |
| GO:007138510 | Skin | AK | cellular response to glucocorticoid stimulus | 16/1910 | 56/18723 | 1.02e-04 | 1.34e-03 | 16 |
| GO:007138410 | Skin | AK | cellular response to corticosteroid stimulus | 16/1910 | 61/18723 | 3.03e-04 | 3.12e-03 | 16 |
| GO:00715497 | Skin | AK | cellular response to dexamethasone stimulus | 10/1910 | 29/18723 | 3.86e-04 | 3.70e-03 | 10 |
| GO:00715488 | Skin | AK | response to dexamethasone | 11/1910 | 39/18723 | 1.36e-03 | 1.01e-02 | 11 |
| GO:19016557 | Skin | AK | cellular response to ketone | 20/1910 | 96/18723 | 1.46e-03 | 1.06e-02 | 20 |
| GO:00030129 | Skin | AK | muscle system process | 64/1910 | 452/18723 | 4.32e-03 | 2.52e-02 | 64 |
| GO:009025714 | Skin | AK | regulation of muscle system process | 38/1910 | 252/18723 | 9.21e-03 | 4.52e-02 | 38 |
| GO:00435026 | Skin | AK | regulation of muscle adaptation | 18/1910 | 98/18723 | 9.72e-03 | 4.72e-02 | 18 |
| GO:004854529 | Skin | cSCC | response to steroid hormone | 135/4864 | 339/18723 | 1.34e-08 | 4.09e-07 | 135 |
| GO:0071383111 | Skin | cSCC | cellular response to steroid hormone stimulus | 84/4864 | 204/18723 | 1.44e-06 | 2.48e-05 | 84 |
| GO:1901654112 | Skin | cSCC | response to ketone | 79/4864 | 194/18723 | 4.82e-06 | 7.06e-05 | 79 |
| GO:0051384110 | Skin | cSCC | response to glucocorticoid | 57/4864 | 148/18723 | 5.30e-04 | 3.97e-03 | 57 |
| GO:0031960110 | Skin | cSCC | response to corticosteroid | 63/4864 | 167/18723 | 5.35e-04 | 3.97e-03 | 63 |
| GO:190165514 | Skin | cSCC | cellular response to ketone | 38/4864 | 96/18723 | 2.38e-03 | 1.38e-02 | 38 |
| Page: 1 2 3 4 5 6 7 |
| Pathway ID | Tissue | Disease Stage | Description | Gene Ratio | Bg Ratio | pvalue | p.adjust | qvalue | Count |
| hsa040689 | Esophagus | ESCC | FoxO signaling pathway | 89/4205 | 131/8465 | 1.56e-05 | 7.98e-05 | 4.09e-05 | 89 |
| hsa0406814 | Esophagus | ESCC | FoxO signaling pathway | 89/4205 | 131/8465 | 1.56e-05 | 7.98e-05 | 4.09e-05 | 89 |
| hsa040684 | Liver | HCC | FoxO signaling pathway | 85/4020 | 131/8465 | 3.99e-05 | 2.16e-04 | 1.20e-04 | 85 |
| hsa040685 | Liver | HCC | FoxO signaling pathway | 85/4020 | 131/8465 | 3.99e-05 | 2.16e-04 | 1.20e-04 | 85 |
| hsa040688 | Oral cavity | OSCC | FoxO signaling pathway | 85/3704 | 131/8465 | 7.50e-07 | 4.33e-06 | 2.21e-06 | 85 |
| hsa0406813 | Oral cavity | OSCC | FoxO signaling pathway | 85/3704 | 131/8465 | 7.50e-07 | 4.33e-06 | 2.21e-06 | 85 |
| hsa040687 | Prostate | BPH | FoxO signaling pathway | 54/1718 | 131/8465 | 3.05e-08 | 3.59e-07 | 2.22e-07 | 54 |
| hsa0406812 | Prostate | BPH | FoxO signaling pathway | 54/1718 | 131/8465 | 3.05e-08 | 3.59e-07 | 2.22e-07 | 54 |
| hsa0406822 | Prostate | Tumor | FoxO signaling pathway | 54/1791 | 131/8465 | 1.32e-07 | 1.51e-06 | 9.36e-07 | 54 |
| hsa0406832 | Prostate | Tumor | FoxO signaling pathway | 54/1791 | 131/8465 | 1.32e-07 | 1.51e-06 | 9.36e-07 | 54 |
| Page: 1 |
Top |
Cell-cell communication analysis |
| Identification of potential cell-cell interactions between two cell types and their ligand-receptor pairs for different disease states |
| Ligand | Receptor | LRpair | Pathway | Tissue | Disease Stage |
| Page: 1 |
Top |
Single-cell gene regulatory network inference analysis |
| Find out the significant the regulons (TFs) and the target genes of each regulon across cell types for different disease states |
| TF | Cell Type | Tissue | Disease Stage | Target Gene | RSS | Regulon Activity |
| ∗The dot plots of a searched regulon are shown for all cell subpopulations in each disease state of each tissue based on the regulon specific score inferred using pySCENIC and by calculating the average expression. |
| Page: 1 |
Top |
Somatic mutation of malignant transformation related genes |
| Annotation of somatic variants for genes involved in malignant transformation |
| Hugo Symbol | Variant Class | Variant Classification | dbSNP RS | HGVSc | HGVSp | HGVSp Short | SWISSPROT | BIOTYPE | SIFT | PolyPhen | Tumor Sample Barcode | Tissue | Histology | Sex | Age | Stage | Therapy Types | Drugs | Outcome |
| FBXO32 | SNV | Missense_Mutation | c.340N>G | p.Leu114Val | p.L114V | Q969P5 | protein_coding | deleterious(0.05) | benign(0.173) | TCGA-EW-A1J5-01 | Breast | breast invasive carcinoma | Female | <65 | I/II | Chemotherapy | adriamycin | SD | |
| FBXO32 | insertion | Frame_Shift_Ins | novel | c.687_688insGAGTTTTTAAATAGAGATGTTGTGTGTGTGTGTGTTTCAG | p.Leu230GlufsTer113 | p.L230Efs*113 | Q969P5 | protein_coding | TCGA-B6-A0IE-01 | Breast | breast invasive carcinoma | Female | <65 | III/IV | Unknown | Unknown | PD | ||
| FBXO32 | SNV | Missense_Mutation | c.894C>G | p.Phe298Leu | p.F298L | Q969P5 | protein_coding | tolerated(0.06) | benign(0.125) | TCGA-WL-A834-01 | Cervix | cervical & endocervical cancer | Female | <65 | I/II | Chemotherapy | paclitaxel | SD | |
| FBXO32 | SNV | Missense_Mutation | rs370398489 | c.1024N>A | p.Val342Ile | p.V342I | Q969P5 | protein_coding | tolerated(0.41) | benign(0.001) | TCGA-AA-3672-01 | Colorectum | colon adenocarcinoma | Female | >=65 | III/IV | Unknown | Unknown | SD |
| FBXO32 | SNV | Missense_Mutation | c.364G>A | p.Val122Met | p.V122M | Q969P5 | protein_coding | deleterious(0) | probably_damaging(0.996) | TCGA-AA-3966-01 | Colorectum | colon adenocarcinoma | Female | >=65 | I/II | Unknown | Unknown | SD | |
| FBXO32 | SNV | Missense_Mutation | novel | c.595N>T | p.Arg199Trp | p.R199W | Q969P5 | protein_coding | deleterious(0) | probably_damaging(0.997) | TCGA-AA-3984-01 | Colorectum | colon adenocarcinoma | Female | <65 | I/II | Unknown | Unknown | SD |
| FBXO32 | SNV | Missense_Mutation | c.610C>A | p.Leu204Ile | p.L204I | Q969P5 | protein_coding | tolerated(0.2) | benign(0.192) | TCGA-AA-A010-01 | Colorectum | colon adenocarcinoma | Female | <65 | I/II | Chemotherapy | folinic | CR | |
| FBXO32 | SNV | Missense_Mutation | novel | c.707N>C | p.Ile236Thr | p.I236T | Q969P5 | protein_coding | deleterious(0) | probably_damaging(0.995) | TCGA-CA-6717-01 | Colorectum | colon adenocarcinoma | Male | <65 | I/II | Chemotherapy | oxaliplatin | CR |
| FBXO32 | SNV | Missense_Mutation | novel | c.853N>A | p.Leu285Met | p.L285M | Q969P5 | protein_coding | tolerated(0.05) | possibly_damaging(0.73) | TCGA-AG-A002-01 | Colorectum | rectum adenocarcinoma | Male | <65 | I/II | Unknown | Unknown | SD |
| FBXO32 | SNV | Missense_Mutation | novel | c.1061N>C | p.Lys354Thr | p.K354T | Q969P5 | protein_coding | deleterious(0.01) | possibly_damaging(0.501) | TCGA-F5-6814-01 | Colorectum | rectum adenocarcinoma | Male | <65 | I/II | Unknown | Unknown | SD |
| Page: 1 2 3 4 5 |
Top |
Related drugs of malignant transformation related genes |
| Identification of chemicals and drugs interact with genes involved in malignant transfromation |
| (DGIdb 4.0) |
| Entrez ID | Symbol | Category | Interaction Types | Drug Claim Name | Drug Name | PMIDs |
| Page: 1 |

Copyright 2023-Present -The University of Texas Health Science Center at Houston |