| Tissue | Expression Dynamics | Abbreviation |
| Cervix | 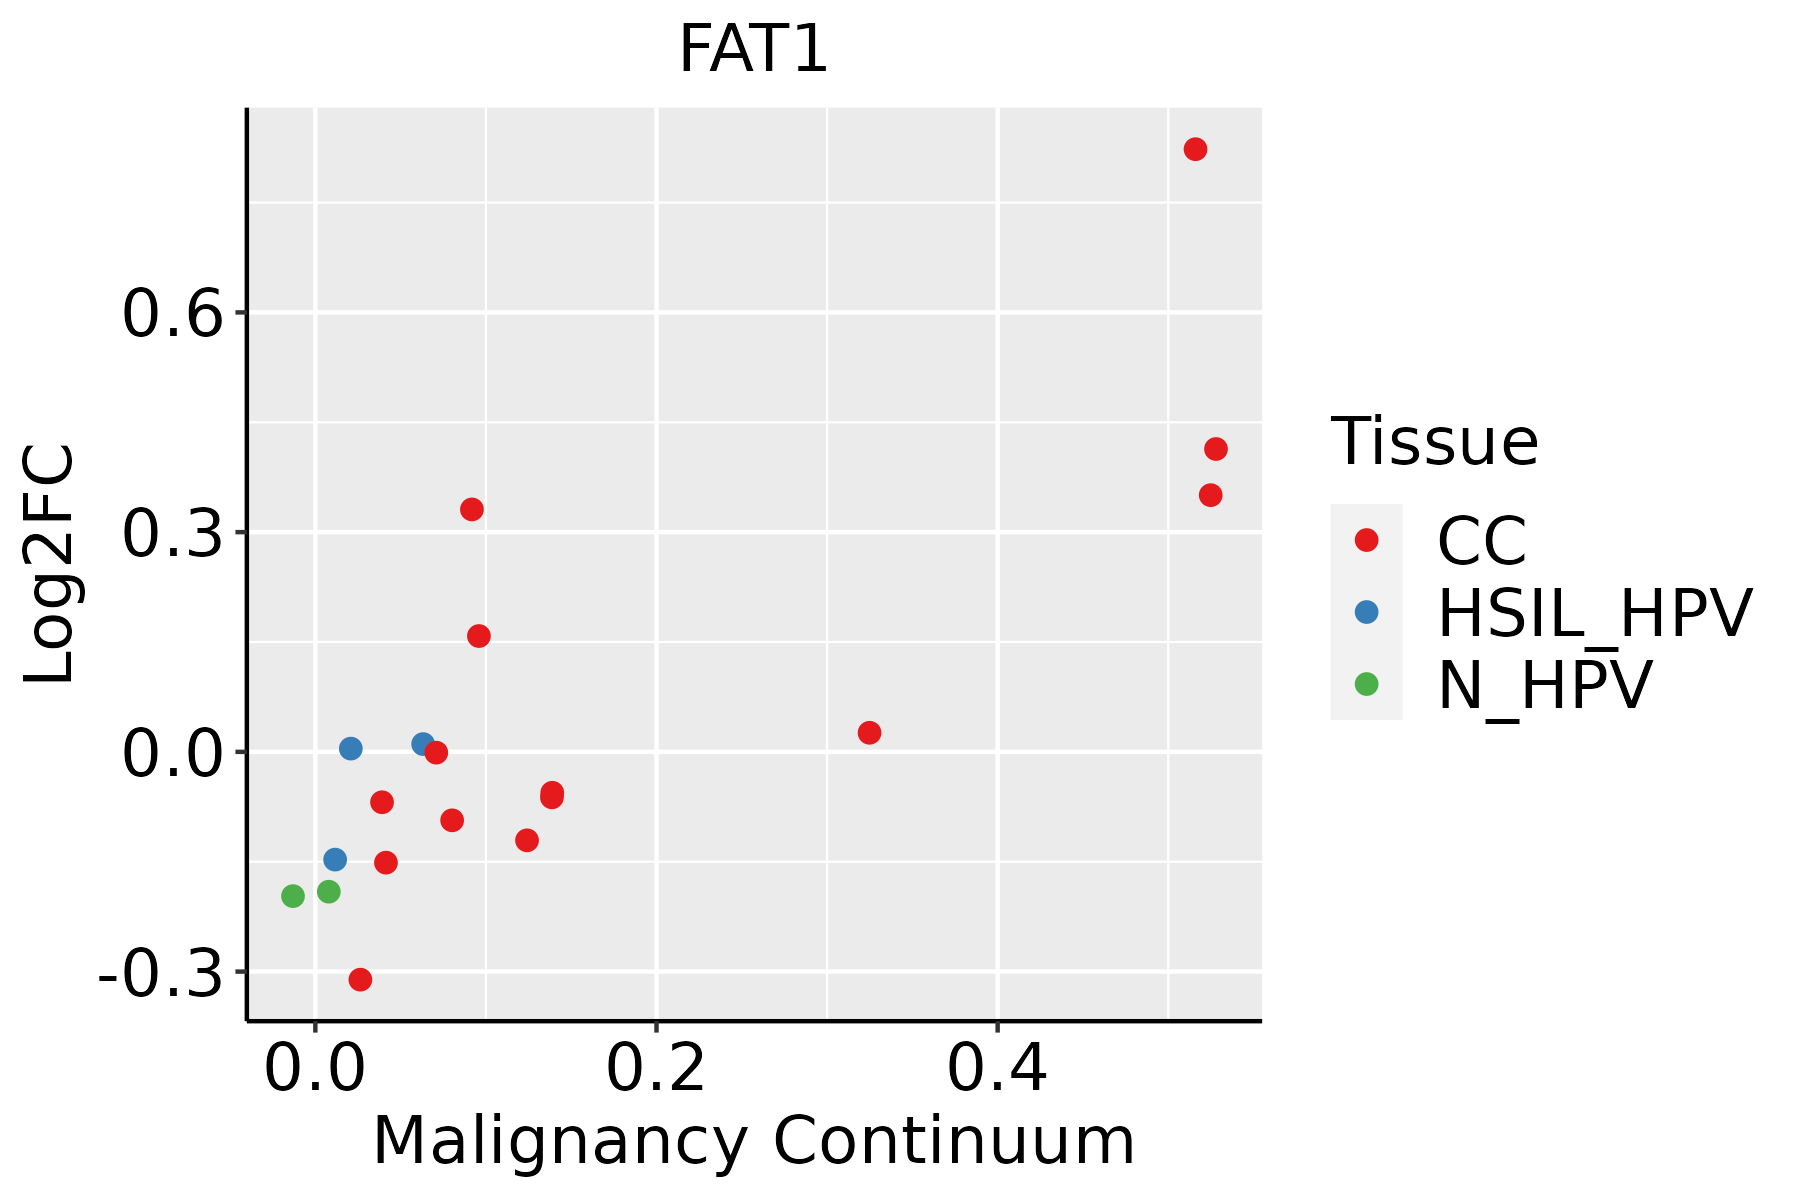 | CC: Cervix cancer |
| HSIL_HPV: HPV-infected high-grade squamous intraepithelial lesions |
| N_HPV: HPV-infected normal cervix |
| Colorectum (GSE201348) |  | FAP: Familial adenomatous polyposis |
| CRC: Colorectal cancer |
| Colorectum (HTA11) |  | AD: Adenomas |
| SER: Sessile serrated lesions |
| MSI-H: Microsatellite-high colorectal cancer |
| MSS: Microsatellite stable colorectal cancer |
| Esophagus | 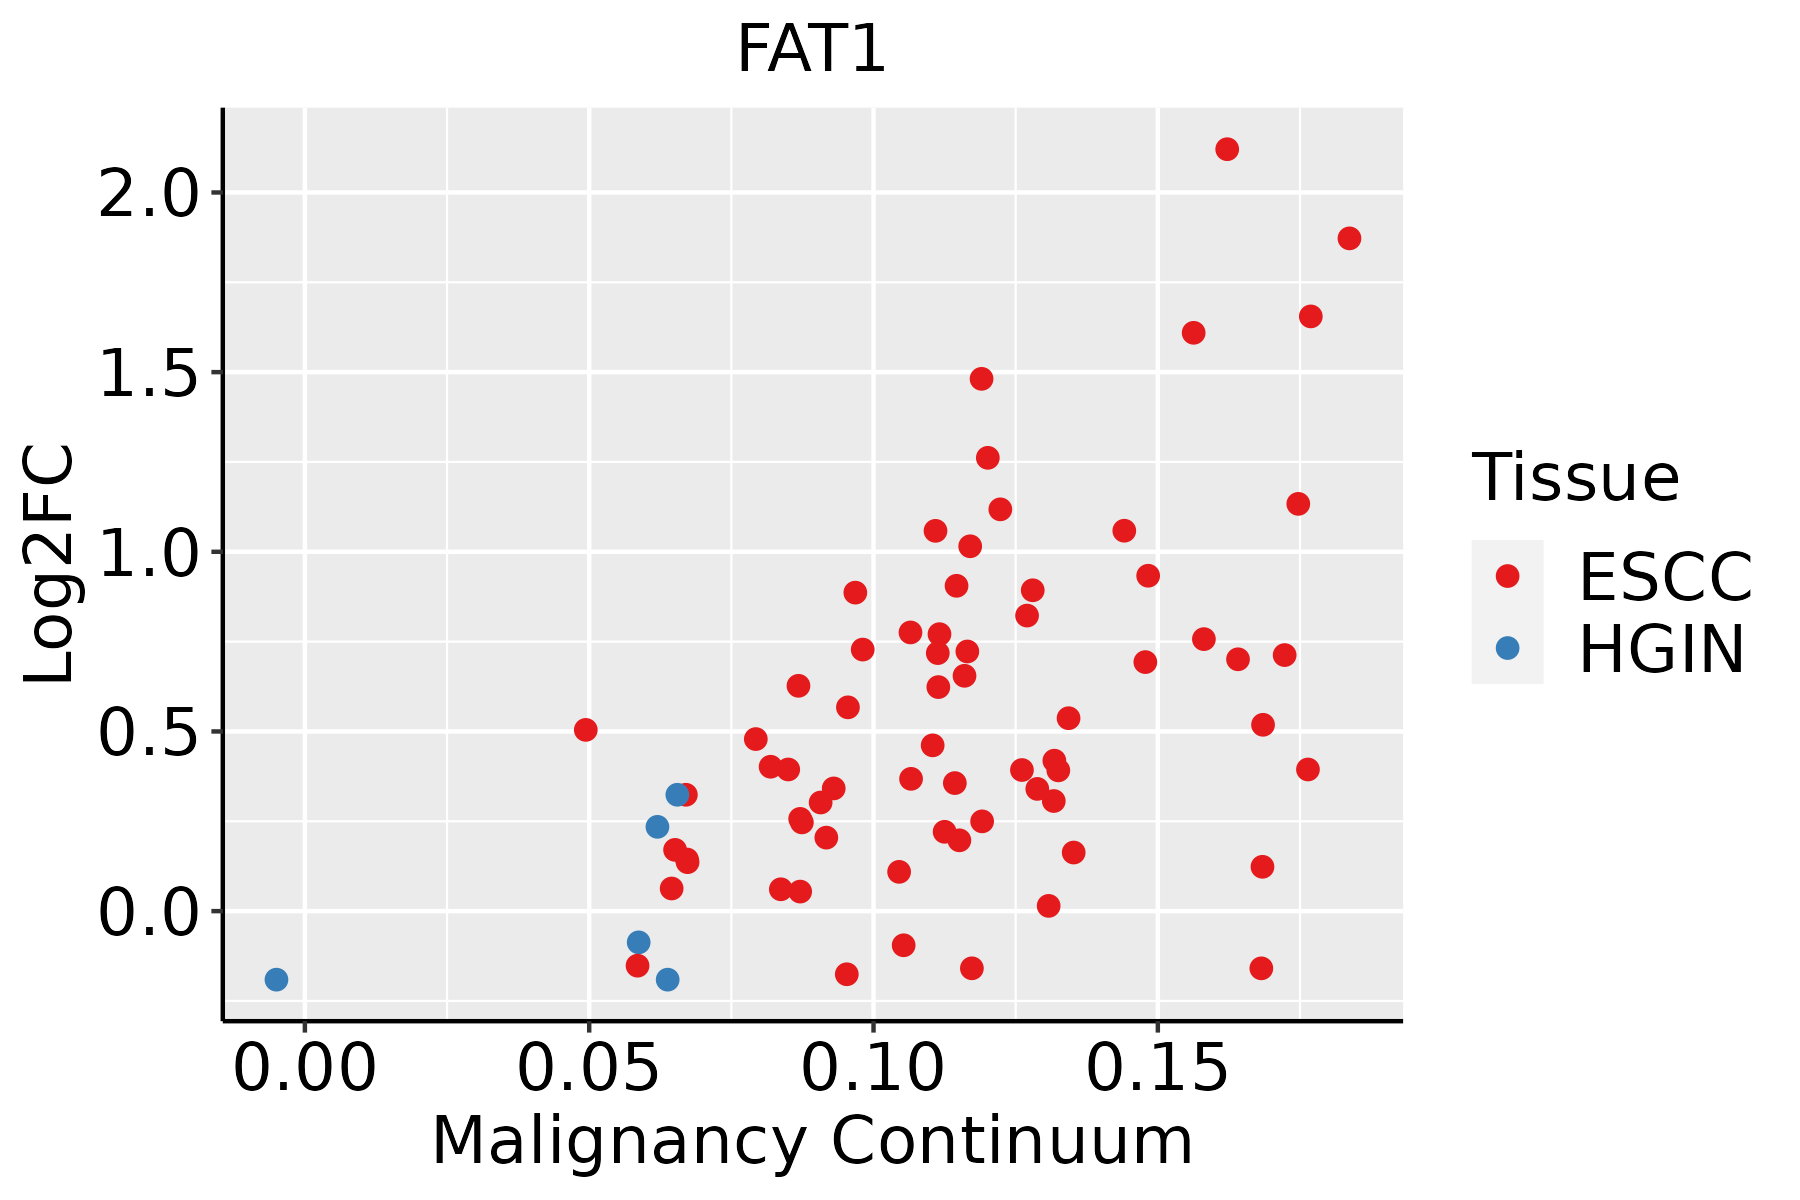 | ESCC: Esophageal squamous cell carcinoma |
| HGIN: High-grade intraepithelial neoplasias |
| LGIN: Low-grade intraepithelial neoplasias |
| GC |  | CAG: Chronic atrophic gastritis |
| CAG with IM: Chronic atrophic gastritis with intestinal metaplasia |
| CSG: Chronic superficial gastritis |
| GC: Gastric cancer |
| SIM: Severe intestinal metaplasia |
| WIM: Wild intestinal metaplasia |
| Liver | 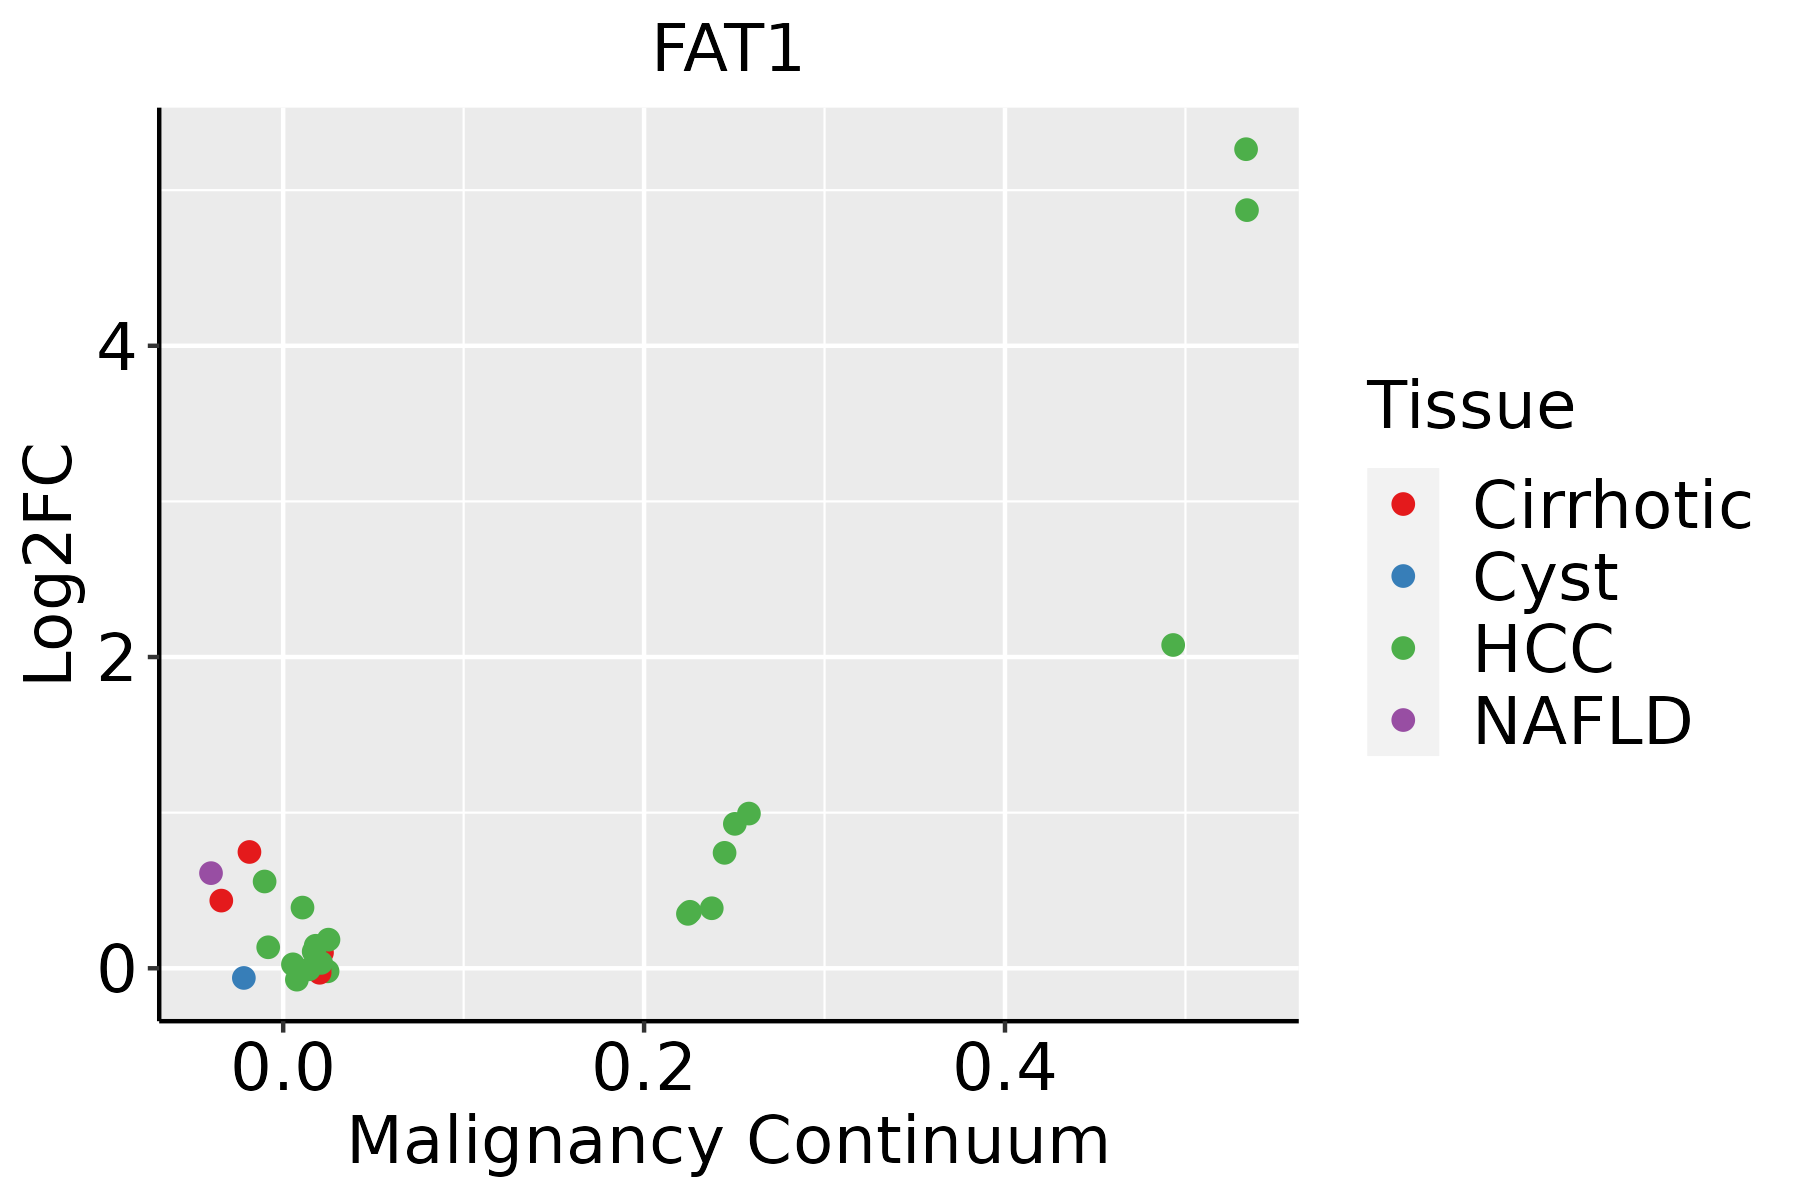 | HCC: Hepatocellular carcinoma |
| NAFLD: Non-alcoholic fatty liver disease |
| Oral Cavity | 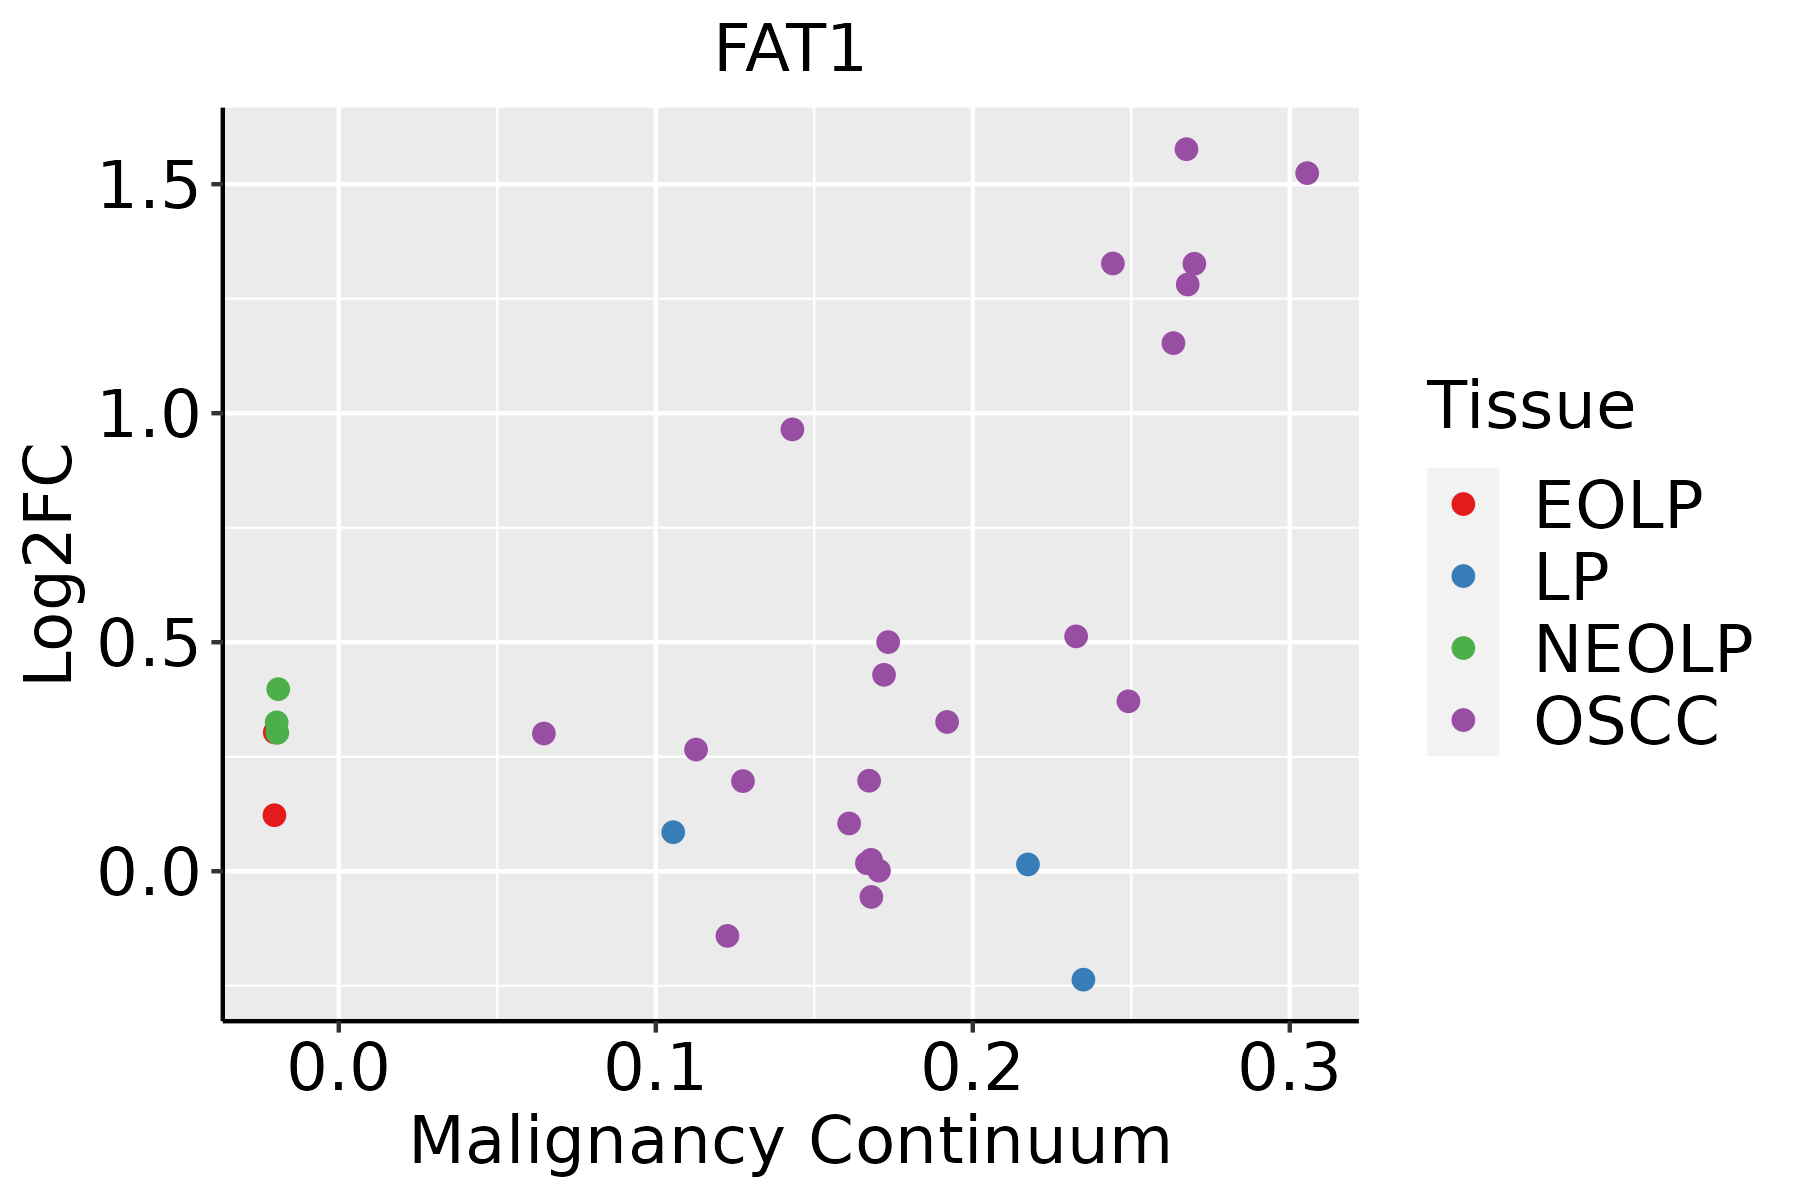 | EOLP: Erosive Oral lichen planus |
| LP: leukoplakia |
| NEOLP: Non-erosive oral lichen planus |
| OSCC: Oral squamous cell carcinoma |
| Prostate |  | BPH: Benign Prostatic Hyperplasia |
| Skin | 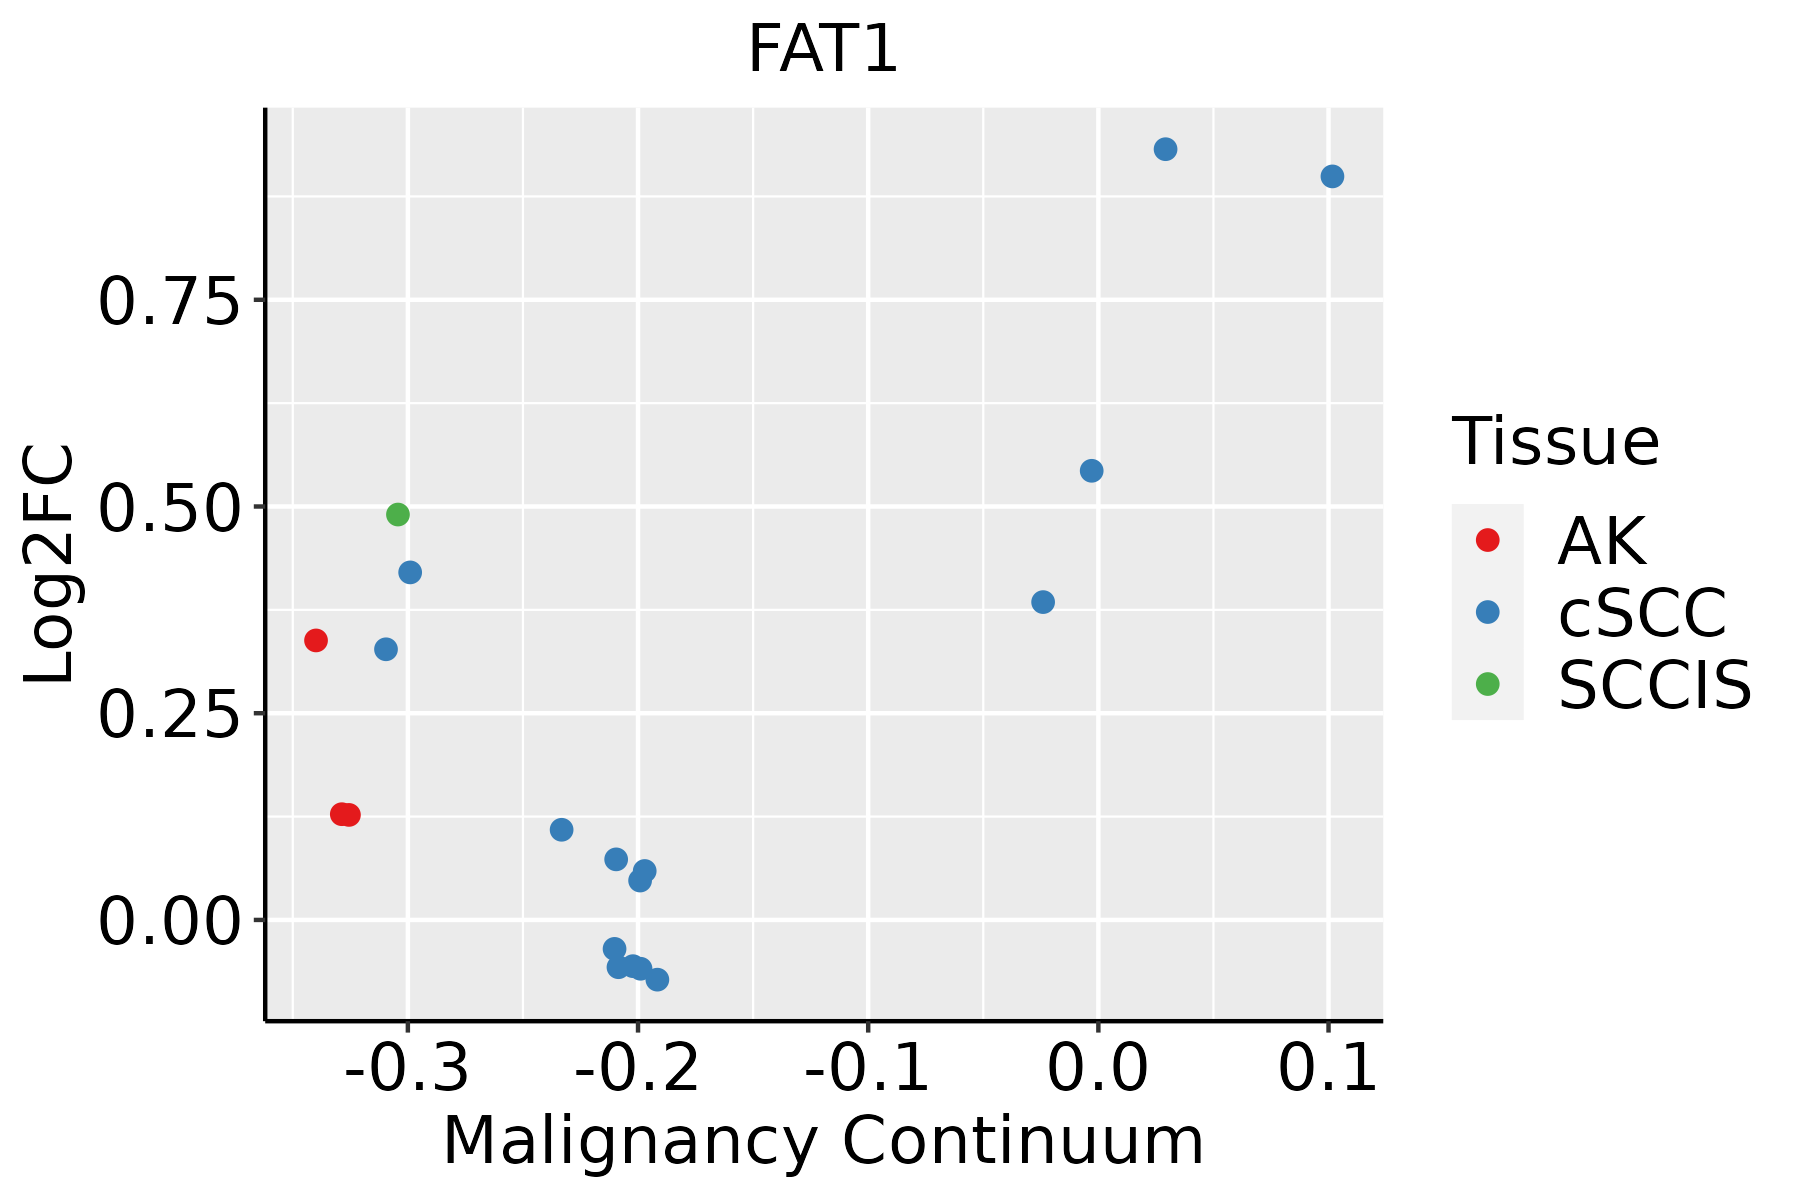 | AK: Actinic keratosis |
| cSCC: Cutaneous squamous cell carcinoma |
| SCCIS:squamous cell carcinoma in situ |
| Thyroid |  | ATC: Anaplastic thyroid cancer |
| HT: Hashimoto's thyroiditis |
| PTC: Papillary thyroid cancer |
| GO ID | Tissue | Disease Stage | Description | Gene Ratio | Bg Ratio | pvalue | p.adjust | Count |
| GO:00350891 | Prostate | Tumor | establishment of apical/basal cell polarity | 9/3246 | 22/18723 | 7.96e-03 | 3.52e-02 | 9 |
| GO:00016541 | Prostate | Tumor | eye development | 82/3246 | 371/18723 | 1.02e-02 | 4.27e-02 | 82 |
| GO:000716326 | Skin | AK | establishment or maintenance of cell polarity | 53/1910 | 218/18723 | 1.32e-09 | 1.26e-07 | 53 |
| GO:000701528 | Skin | AK | actin filament organization | 85/1910 | 442/18723 | 5.94e-09 | 4.14e-07 | 85 |
| GO:000206425 | Skin | AK | epithelial cell development | 51/1910 | 220/18723 | 1.50e-08 | 9.13e-07 | 51 |
| GO:003001019 | Skin | AK | establishment of cell polarity | 36/1910 | 143/18723 | 2.24e-07 | 9.02e-06 | 36 |
| GO:00017388 | Skin | AK | morphogenesis of a polarized epithelium | 22/1910 | 94/18723 | 1.55e-04 | 1.84e-03 | 22 |
| GO:00350889 | Skin | AK | establishment or maintenance of apical/basal cell polarity | 14/1910 | 49/18723 | 2.72e-04 | 2.89e-03 | 14 |
| GO:00612459 | Skin | AK | establishment or maintenance of bipolar cell polarity | 14/1910 | 49/18723 | 2.72e-04 | 2.89e-03 | 14 |
| GO:00451979 | Skin | AK | establishment or maintenance of epithelial cell apical/basal polarity | 11/1910 | 44/18723 | 3.87e-03 | 2.29e-02 | 11 |
| GO:00033825 | Skin | AK | epithelial cell morphogenesis | 9/1910 | 33/18723 | 4.68e-03 | 2.69e-02 | 9 |
| GO:0007163110 | Skin | SCCIS | establishment or maintenance of cell polarity | 31/919 | 218/18723 | 9.72e-08 | 1.29e-05 | 31 |
| GO:0002064111 | Skin | SCCIS | epithelial cell development | 29/919 | 220/18723 | 1.25e-06 | 8.07e-05 | 29 |
| GO:0030010110 | Skin | SCCIS | establishment of cell polarity | 20/919 | 143/18723 | 2.28e-05 | 6.50e-04 | 20 |
| GO:0007015111 | Skin | SCCIS | actin filament organization | 40/919 | 442/18723 | 1.50e-04 | 3.04e-03 | 40 |
| GO:00987421 | Skin | SCCIS | cell-cell adhesion via plasma-membrane adhesion molecules | 26/919 | 273/18723 | 9.83e-04 | 1.23e-02 | 26 |
| GO:000173813 | Skin | SCCIS | morphogenesis of a polarized epithelium | 12/919 | 94/18723 | 2.13e-03 | 2.17e-02 | 12 |
| GO:000338212 | Skin | SCCIS | epithelial cell morphogenesis | 6/919 | 33/18723 | 4.88e-03 | 3.99e-02 | 6 |
| GO:000716327 | Skin | cSCC | establishment or maintenance of cell polarity | 103/4864 | 218/18723 | 9.44e-12 | 4.85e-10 | 103 |
| GO:003001025 | Skin | cSCC | establishment of cell polarity | 65/4864 | 143/18723 | 3.60e-07 | 7.18e-06 | 65 |
| Hugo Symbol | Variant Class | Variant Classification | dbSNP RS | HGVSc | HGVSp | HGVSp Short | SWISSPROT | BIOTYPE | SIFT | PolyPhen | Tumor Sample Barcode | Tissue | Histology | Sex | Age | Stage | Therapy Types | Drugs | Outcome |
| FAT1 | SNV | Missense_Mutation | | c.7117N>A | p.Asp2373Asn | p.D2373N | Q14517 | protein_coding | deleterious(0) | possibly_damaging(0.715) | TCGA-A2-A0CX-01 | Breast | breast invasive carcinoma | Female | <65 | I/II | Chemotherapy | adriamycin | SD |
| FAT1 | SNV | Missense_Mutation | | c.3131A>G | p.Lys1044Arg | p.K1044R | Q14517 | protein_coding | tolerated(0.15) | benign(0.052) | TCGA-A2-A0D0-01 | Breast | breast invasive carcinoma | Female | <65 | I/II | Chemotherapy | cytoxan | SD |
| FAT1 | SNV | Missense_Mutation | | c.6226G>A | p.Asp2076Asn | p.D2076N | Q14517 | protein_coding | deleterious(0) | probably_damaging(0.998) | TCGA-A7-A0CE-01 | Breast | breast invasive carcinoma | Female | <65 | I/II | Chemotherapy | adriamycin | SD |
| FAT1 | SNV | Missense_Mutation | rs200357548 | c.10478N>T | p.Pro3493Leu | p.P3493L | Q14517 | protein_coding | deleterious(0.02) | benign(0.081) | TCGA-A8-A08T-01 | Breast | breast invasive carcinoma | Female | <65 | III/IV | Unknown | Unknown | PD |
| FAT1 | SNV | Missense_Mutation | novel | c.404T>C | p.Val135Ala | p.V135A | Q14517 | protein_coding | deleterious(0) | benign(0.345) | TCGA-A8-A09Z-01 | Breast | breast invasive carcinoma | Female | >=65 | I/II | Unknown | Unknown | SD |
| FAT1 | SNV | Missense_Mutation | | c.6179N>T | p.Ser2060Phe | p.S2060F | Q14517 | protein_coding | tolerated(0.57) | possibly_damaging(0.748) | TCGA-AC-A23H-01 | Breast | breast invasive carcinoma | Female | >=65 | I/II | Unknown | Unknown | PD |
| FAT1 | SNV | Missense_Mutation | novel | c.6445G>A | p.Glu2149Lys | p.E2149K | Q14517 | protein_coding | deleterious(0.03) | benign(0.243) | TCGA-AN-A046-01 | Breast | breast invasive carcinoma | Female | >=65 | I/II | Unknown | Unknown | SD |
| FAT1 | SNV | Missense_Mutation | rs772458580 | c.1654G>A | p.Glu552Lys | p.E552K | Q14517 | protein_coding | deleterious(0.02) | possibly_damaging(0.685) | TCGA-AN-A046-01 | Breast | breast invasive carcinoma | Female | >=65 | I/II | Unknown | Unknown | SD |
| FAT1 | SNV | Missense_Mutation | | c.9619N>G | p.Pro3207Ala | p.P3207A | Q14517 | protein_coding | tolerated(0.06) | probably_damaging(0.999) | TCGA-AN-A0FV-01 | Breast | breast invasive carcinoma | Female | <65 | I/II | Unknown | Unknown | SD |
| FAT1 | SNV | Missense_Mutation | rs371394820 | c.5284N>A | p.Ala1762Thr | p.A1762T | Q14517 | protein_coding | tolerated(0.22) | benign(0.022) | TCGA-AQ-A1H2-01 | Breast | breast invasive carcinoma | Female | >=65 | III/IV | Chemotherapy | herceptin | SD |


