| Tissue | Expression Dynamics | Abbreviation |
| Cervix | 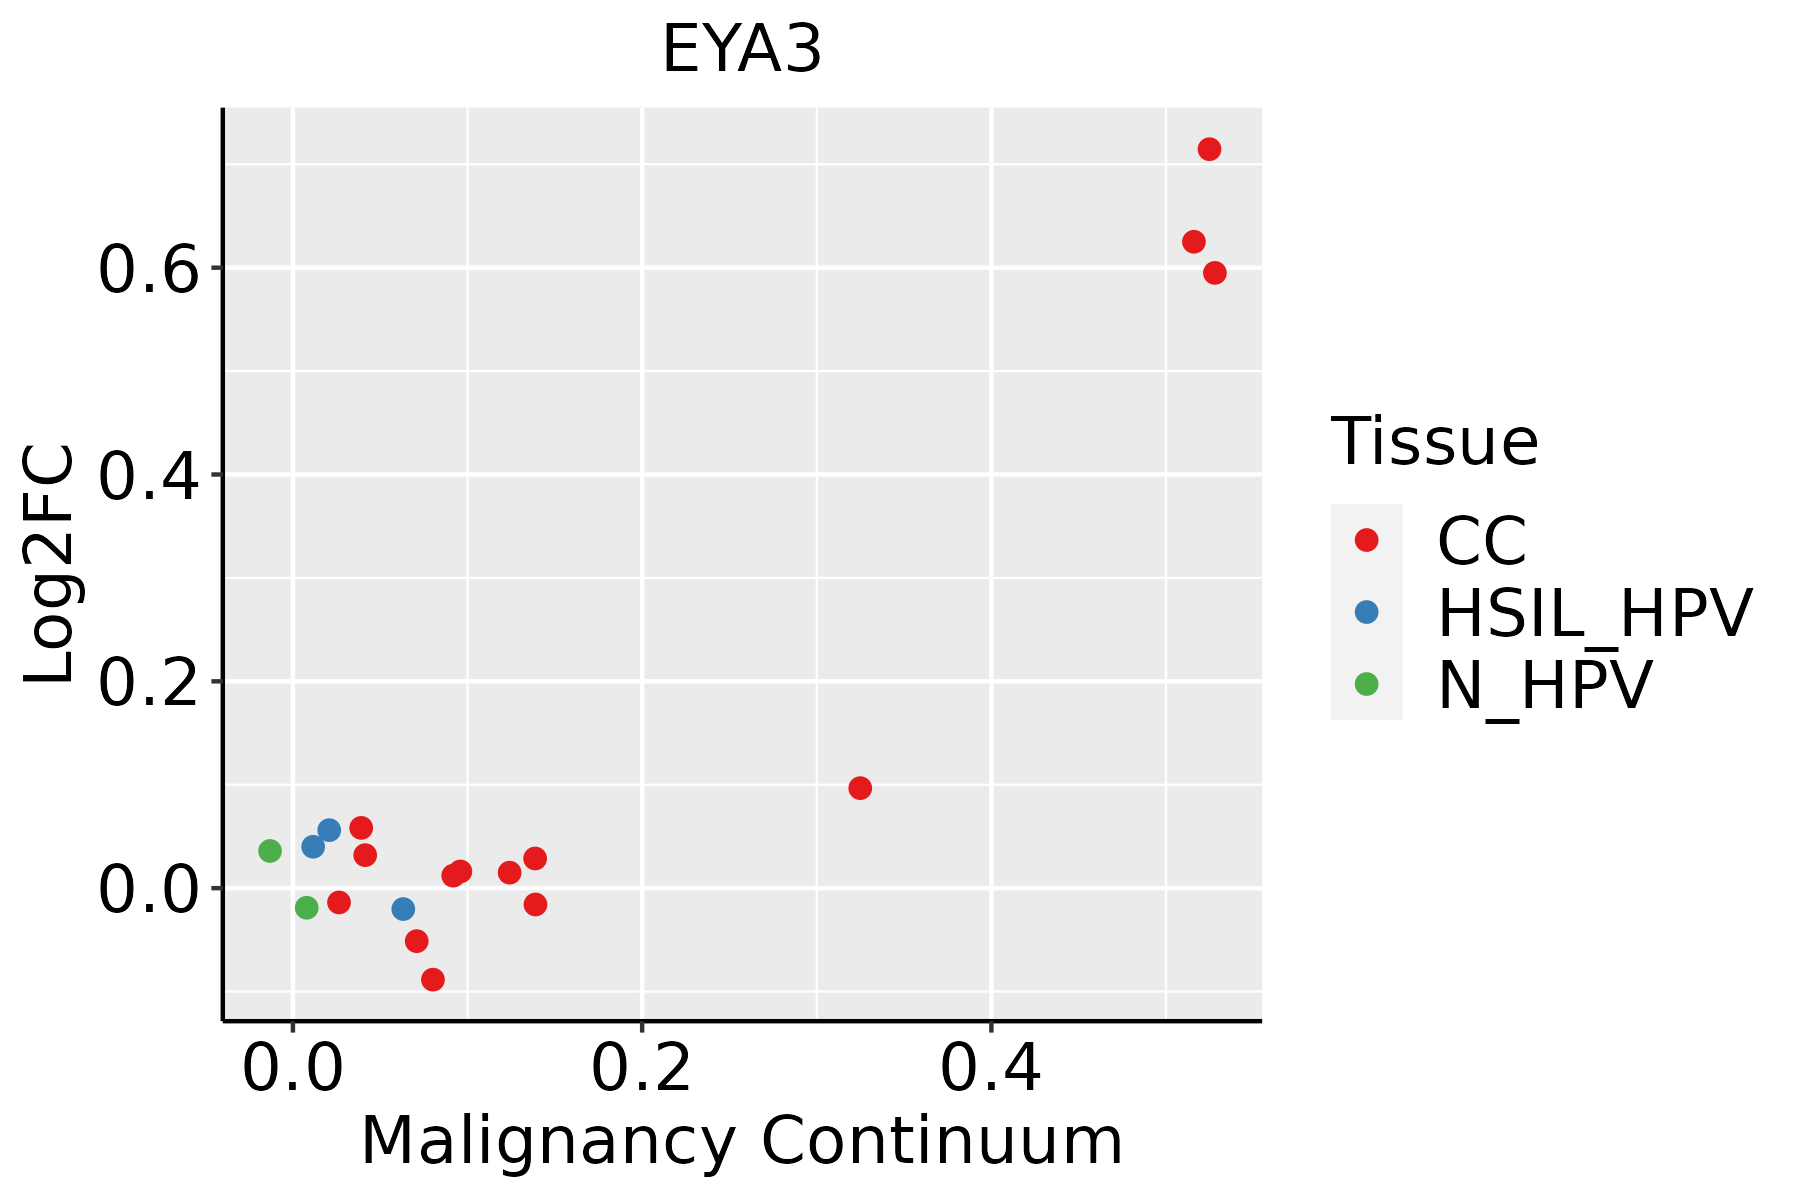 | CC: Cervix cancer |
| HSIL_HPV: HPV-infected high-grade squamous intraepithelial lesions |
| N_HPV: HPV-infected normal cervix |
| Colorectum (GSE201348) | 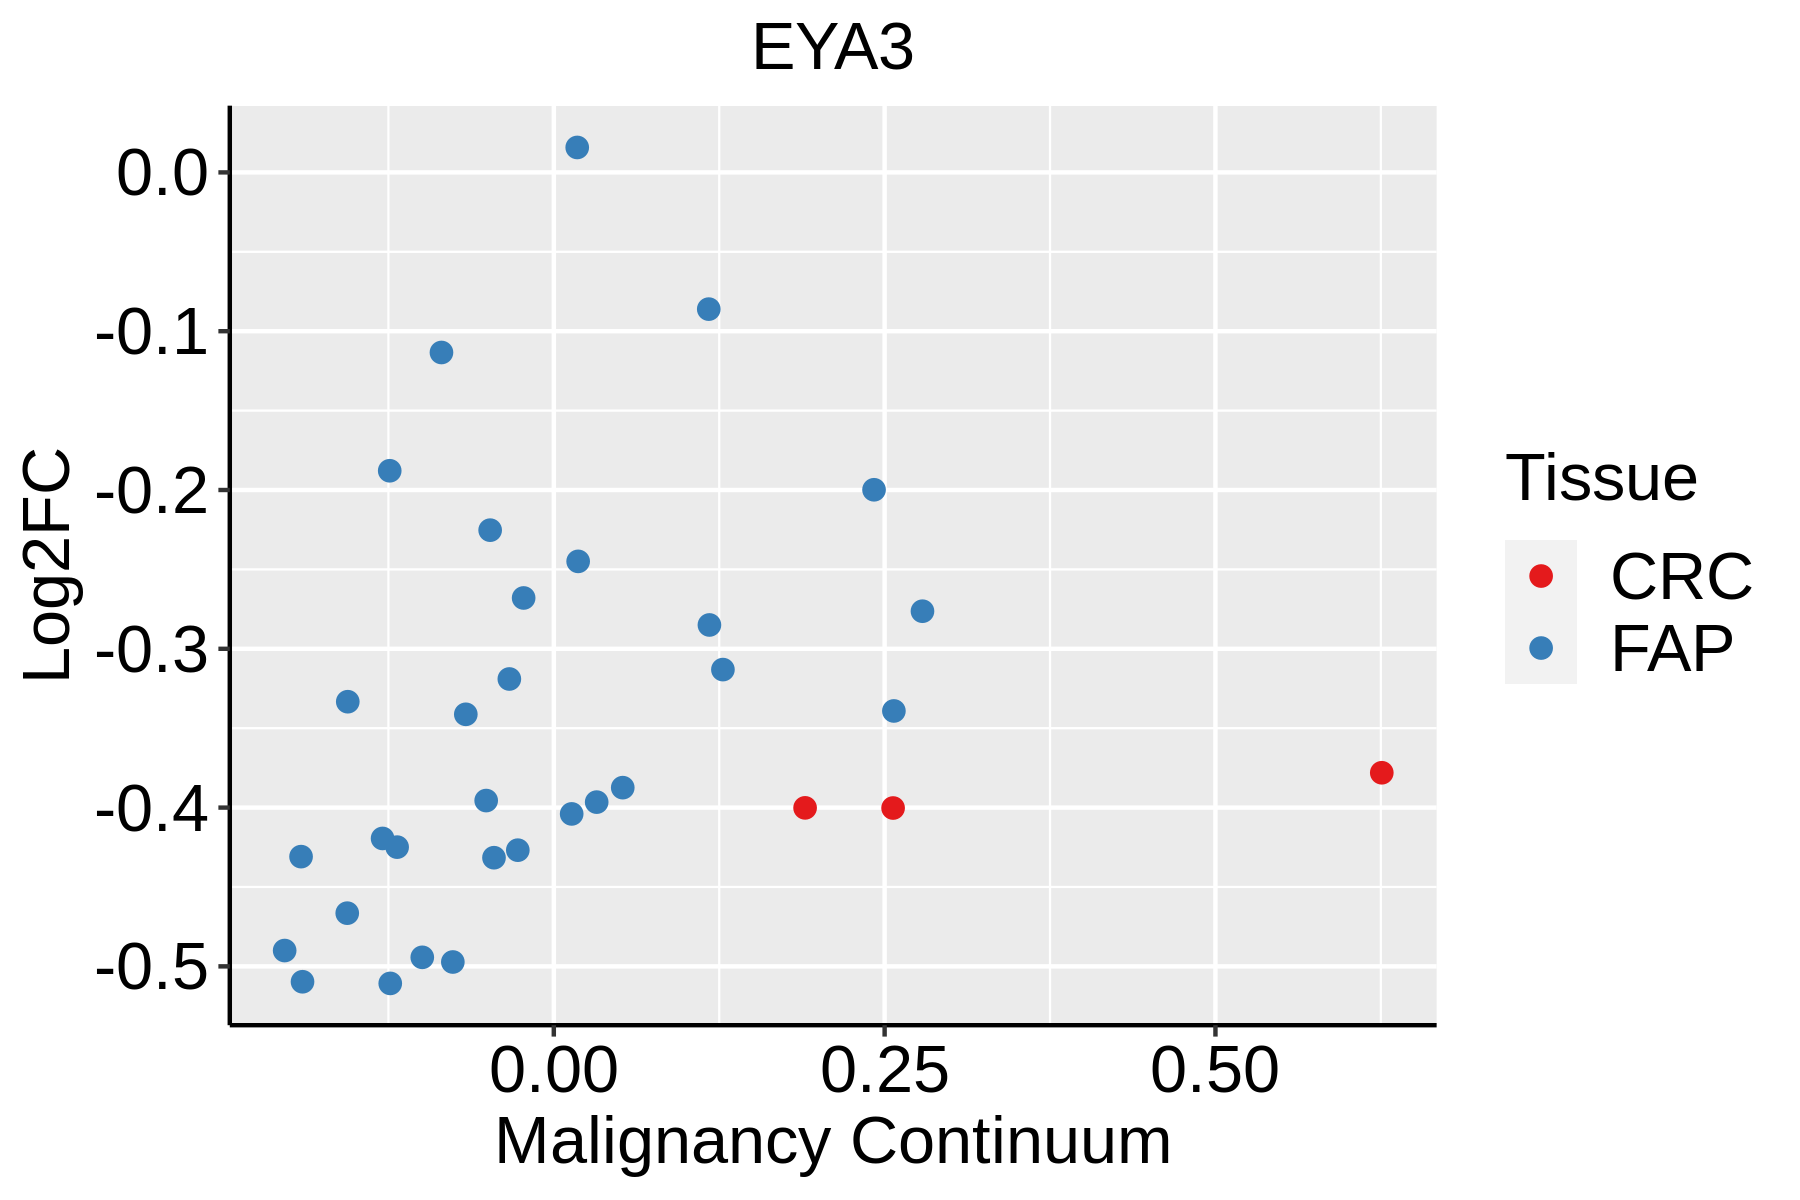 | FAP: Familial adenomatous polyposis |
| CRC: Colorectal cancer |
| Colorectum (HTA11) | 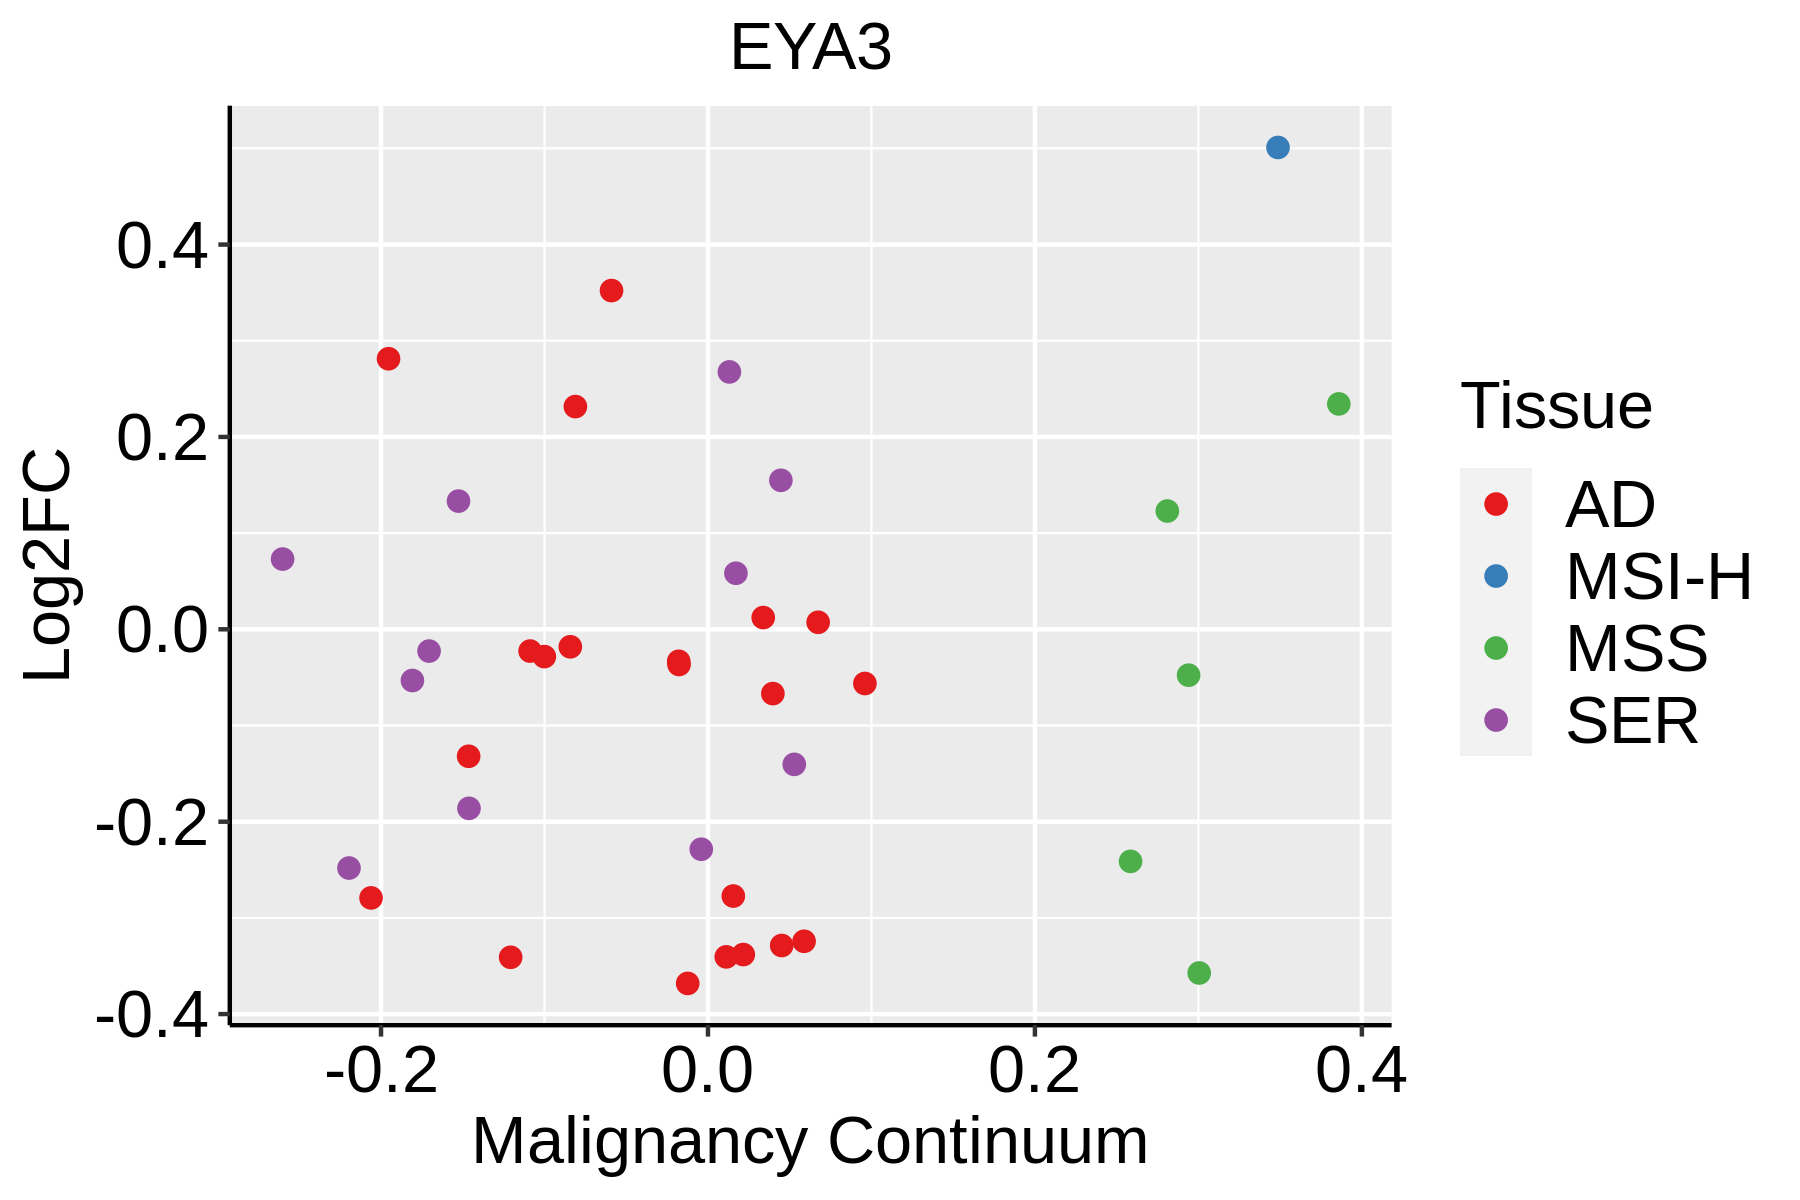 | AD: Adenomas |
| SER: Sessile serrated lesions |
| MSI-H: Microsatellite-high colorectal cancer |
| MSS: Microsatellite stable colorectal cancer |
| Esophagus | 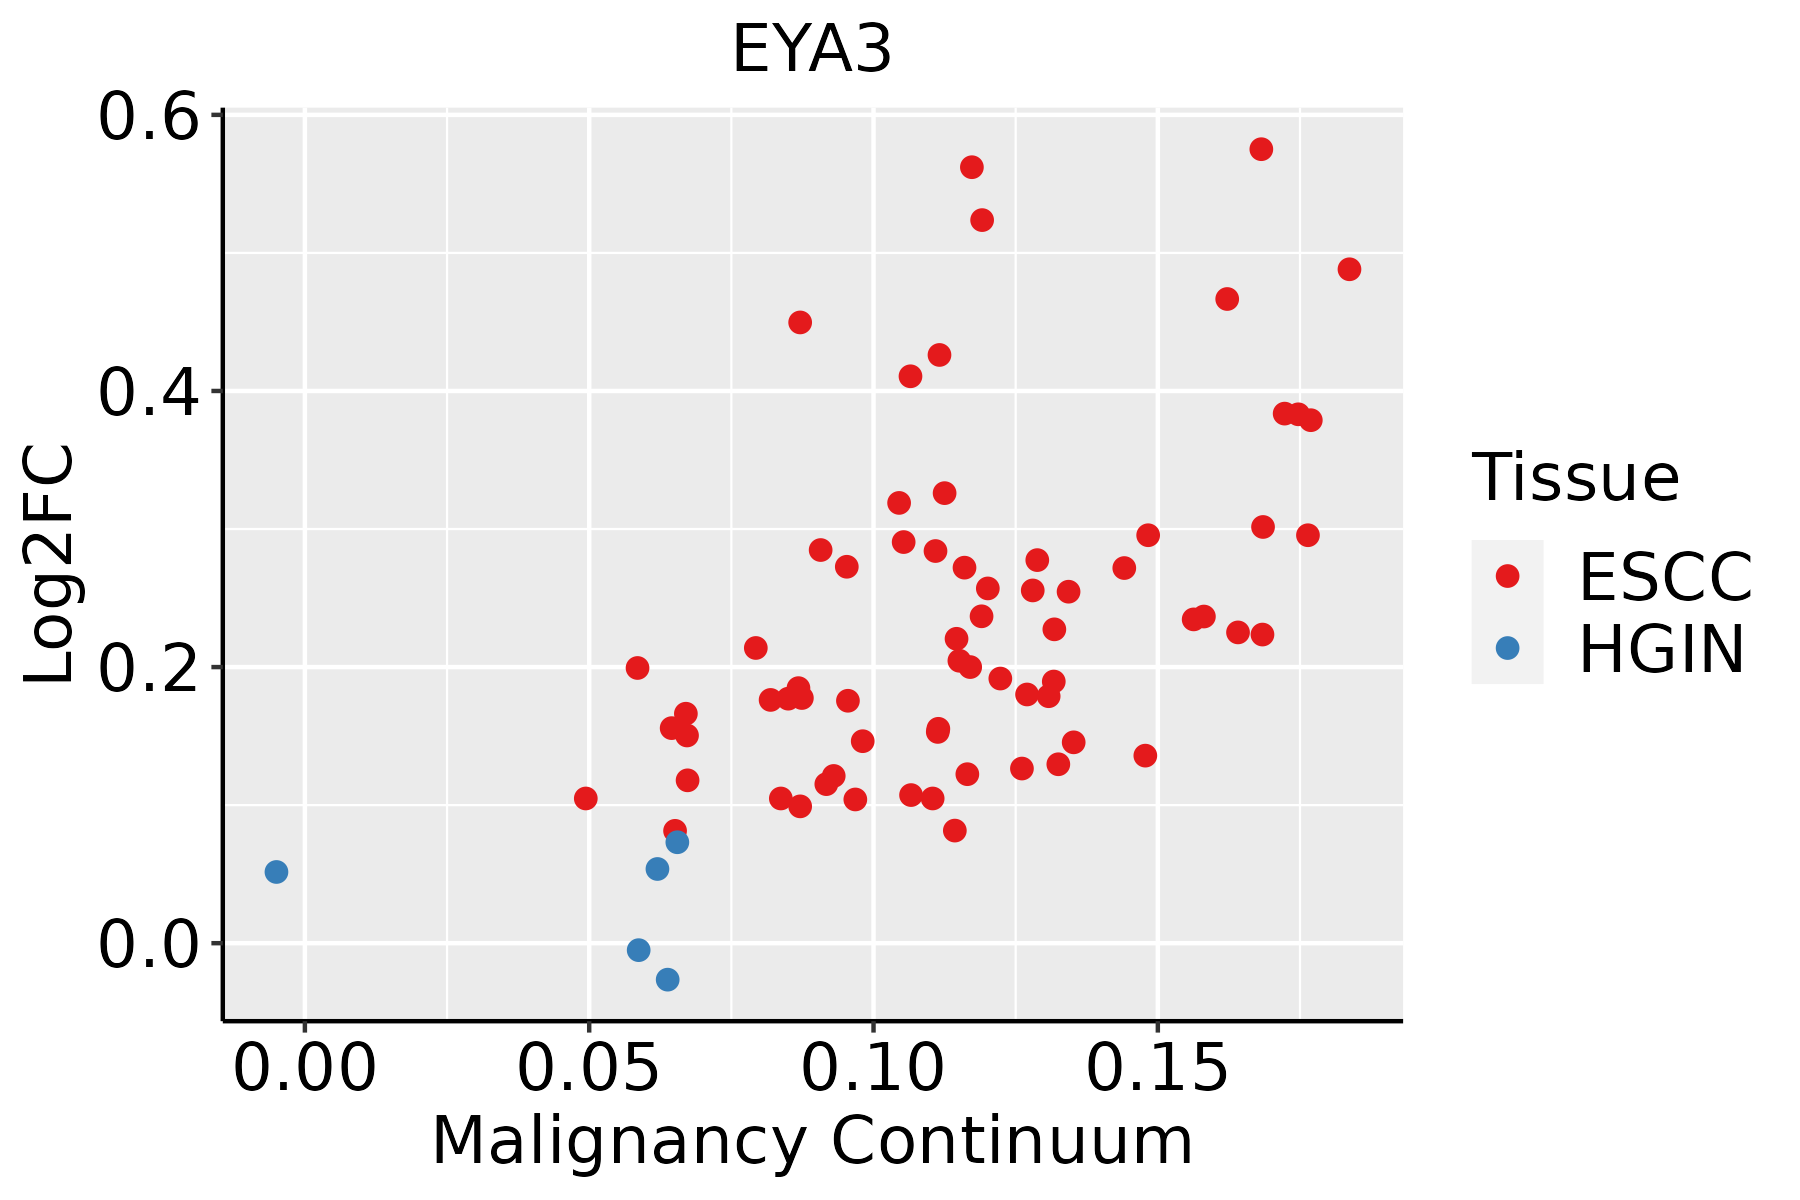 | ESCC: Esophageal squamous cell carcinoma |
| HGIN: High-grade intraepithelial neoplasias |
| LGIN: Low-grade intraepithelial neoplasias |
| Liver | 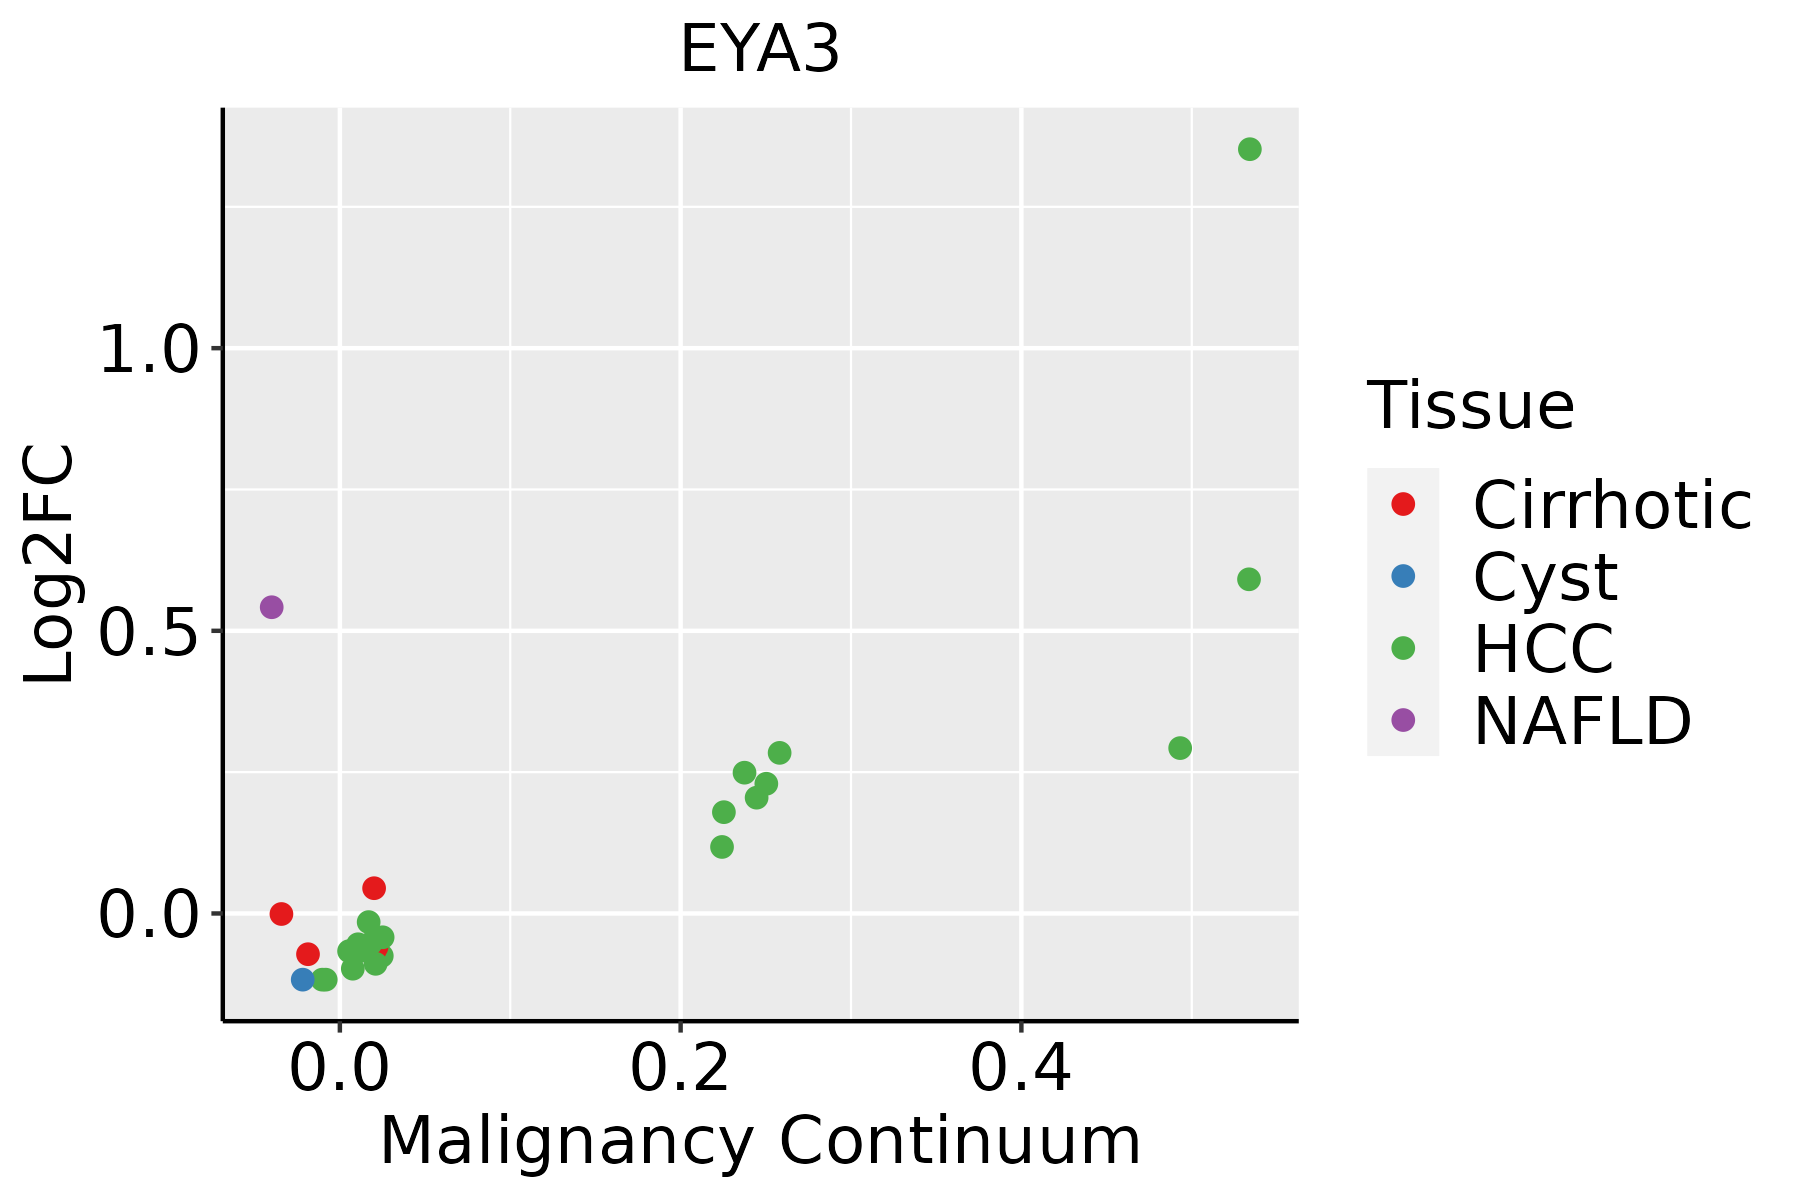 | HCC: Hepatocellular carcinoma |
| NAFLD: Non-alcoholic fatty liver disease |
| Lung |  | AAH: Atypical adenomatous hyperplasia |
| AIS: Adenocarcinoma in situ |
| IAC: Invasive lung adenocarcinoma |
| MIA: Minimally invasive adenocarcinoma |
| Oral Cavity |  | EOLP: Erosive Oral lichen planus |
| LP: leukoplakia |
| NEOLP: Non-erosive oral lichen planus |
| OSCC: Oral squamous cell carcinoma |
| GO ID | Tissue | Disease Stage | Description | Gene Ratio | Bg Ratio | pvalue | p.adjust | Count |
| GO:001657012 | Lung | AIS | histone modification | 81/1849 | 463/18723 | 2.30e-07 | 2.16e-05 | 81 |
| GO:000647012 | Lung | AIS | protein dephosphorylation | 56/1849 | 281/18723 | 2.47e-07 | 2.24e-05 | 56 |
| GO:200123413 | Lung | AIS | negative regulation of apoptotic signaling pathway | 46/1849 | 224/18723 | 1.19e-06 | 8.00e-05 | 46 |
| GO:001631112 | Lung | AIS | dephosphorylation | 69/1849 | 417/18723 | 1.27e-05 | 4.78e-04 | 69 |
| GO:009719113 | Lung | AIS | extrinsic apoptotic signaling pathway | 41/1849 | 219/18723 | 4.46e-05 | 1.33e-03 | 41 |
| GO:200123613 | Lung | AIS | regulation of extrinsic apoptotic signaling pathway | 31/1849 | 151/18723 | 6.27e-05 | 1.70e-03 | 31 |
| GO:000931411 | Lung | AIS | response to radiation | 71/1849 | 456/18723 | 7.33e-05 | 1.91e-03 | 71 |
| GO:200123713 | Lung | AIS | negative regulation of extrinsic apoptotic signaling pathway | 22/1849 | 97/18723 | 1.58e-04 | 3.34e-03 | 22 |
| GO:00353351 | Lung | AIS | peptidyl-tyrosine dephosphorylation | 21/1849 | 97/18723 | 4.32e-04 | 7.38e-03 | 21 |
| GO:200102012 | Lung | AIS | regulation of response to DNA damage stimulus | 37/1849 | 219/18723 | 8.22e-04 | 1.14e-02 | 37 |
| GO:001021212 | Lung | AIS | response to ionizing radiation | 26/1849 | 148/18723 | 2.64e-03 | 2.68e-02 | 26 |
| GO:200123320 | Oral cavity | OSCC | regulation of apoptotic signaling pathway | 242/7305 | 356/18723 | 6.66e-29 | 3.24e-26 | 242 |
| GO:00165707 | Oral cavity | OSCC | histone modification | 270/7305 | 463/18723 | 1.59e-17 | 1.50e-15 | 270 |
| GO:200123420 | Oral cavity | OSCC | negative regulation of apoptotic signaling pathway | 148/7305 | 224/18723 | 1.71e-16 | 1.36e-14 | 148 |
| GO:009719120 | Oral cavity | OSCC | extrinsic apoptotic signaling pathway | 142/7305 | 219/18723 | 7.34e-15 | 4.55e-13 | 142 |
| GO:005105210 | Oral cavity | OSCC | regulation of DNA metabolic process | 207/7305 | 359/18723 | 4.45e-13 | 2.17e-11 | 207 |
| GO:00102128 | Oral cavity | OSCC | response to ionizing radiation | 99/7305 | 148/18723 | 5.49e-12 | 2.08e-10 | 99 |
| GO:005105414 | Oral cavity | OSCC | positive regulation of DNA metabolic process | 126/7305 | 201/18723 | 8.12e-12 | 3.01e-10 | 126 |
| GO:200123620 | Oral cavity | OSCC | regulation of extrinsic apoptotic signaling pathway | 100/7305 | 151/18723 | 1.07e-11 | 3.90e-10 | 100 |
| GO:000647015 | Oral cavity | OSCC | protein dephosphorylation | 162/7305 | 281/18723 | 1.56e-10 | 4.56e-09 | 162 |
| Hugo Symbol | Variant Class | Variant Classification | dbSNP RS | HGVSc | HGVSp | HGVSp Short | SWISSPROT | BIOTYPE | SIFT | PolyPhen | Tumor Sample Barcode | Tissue | Histology | Sex | Age | Stage | Therapy Types | Drugs | Outcome |
| EYA3 | SNV | Missense_Mutation | novel | c.1676N>A | p.Gly559Glu | p.G559E | Q99504 | protein_coding | deleterious(0.02) | possibly_damaging(0.463) | TCGA-AN-A04C-01 | Breast | breast invasive carcinoma | Female | <65 | I/II | Unknown | Unknown | SD |
| EYA3 | SNV | Missense_Mutation | | c.607N>G | p.Leu203Val | p.L203V | Q99504 | protein_coding | tolerated(0.05) | benign(0.355) | TCGA-B6-A0IJ-01 | Breast | breast invasive carcinoma | Female | <65 | I/II | Unknown | Unknown | SD |
| EYA3 | SNV | Missense_Mutation | | c.1551N>G | p.Ser517Arg | p.S517R | Q99504 | protein_coding | deleterious(0) | probably_damaging(0.998) | TCGA-E9-A22H-01 | Breast | breast invasive carcinoma | Female | <65 | I/II | Chemotherapy | doxorubicin | SD |
| EYA3 | insertion | Frame_Shift_Ins | novel | c.1324_1325insTGCAGTACACTAATGCTATGAAGCCC | p.Lys442MetfsTer16 | p.K442Mfs*16 | Q99504 | protein_coding | | | TCGA-A8-A07J-01 | Breast | breast invasive carcinoma | Female | <65 | I/II | Chemotherapy | 5-fluorouracil | CR |
| EYA3 | insertion | Nonsense_Mutation | novel | c.1468_1469insGAGACTCCGTCTCTAAATAAATAAATAAAAGGTATTGACAAGGA | p.Leu490ArgfsTer7 | p.L490Rfs*7 | Q99504 | protein_coding | | | TCGA-AN-A0FW-01 | Breast | breast invasive carcinoma | Female | >=65 | III/IV | Unknown | Unknown | SD |
| EYA3 | insertion | Frame_Shift_Ins | novel | c.634_635insCTTTCTATGTCCAGGATCCCTTTAAGATTCTGAGGAAAGCATGG | p.Tyr212SerfsTer36 | p.Y212Sfs*36 | Q99504 | protein_coding | | | TCGA-BH-A0HX-01 | Breast | breast invasive carcinoma | Female | <65 | I/II | Chemotherapy | adrimycin | SD |
| EYA3 | SNV | Missense_Mutation | | c.292A>C | p.Thr98Pro | p.T98P | Q99504 | protein_coding | tolerated(0.14) | benign(0.006) | TCGA-FU-A3HZ-01 | Cervix | cervical & endocervical cancer | Female | <65 | I/II | Chemotherapy | cisplatin | CR |
| EYA3 | SNV | Missense_Mutation | novel | c.1253N>A | p.Arg418His | p.R418H | Q99504 | protein_coding | deleterious(0) | probably_damaging(1) | TCGA-ZJ-AAXN-01 | Cervix | cervical & endocervical cancer | Female | <65 | I/II | Unknown | Unknown | SD |
| EYA3 | SNV | Missense_Mutation | | c.1505T>C | p.Phe502Ser | p.F502S | Q99504 | protein_coding | deleterious(0) | probably_damaging(0.999) | TCGA-A6-5665-01 | Colorectum | colon adenocarcinoma | Female | >=65 | I/II | Unknown | Unknown | PD |
| EYA3 | SNV | Missense_Mutation | | c.781N>C | p.Thr261Pro | p.T261P | Q99504 | protein_coding | tolerated(0.1) | benign(0) | TCGA-G4-6586-01 | Colorectum | colon adenocarcinoma | Female | >=65 | I/II | Unknown | Unknown | SD |


