
|
|||||
|
 | |
| |
| |
| |
| |
| |
|
Gene: EREG |
Gene summary for EREG |
| Gene information | Species | Human | Gene symbol | EREG | Gene ID | 2069 |
| Gene name | epiregulin | |
| Gene Alias | EPR | |
| Cytomap | 4q13.3 | |
| Gene Type | protein-coding | GO ID | GO:0000003 | UniProtAcc | O14944 |
Top |
Malignant transformation analysis |
| Identification of the aberrant gene expression in precancerous and cancerous lesions by comparing the gene expression of stem-like cells in diseased tissues with normal stem cells |
| Entrez ID | Symbol | Replicates | Species | Organ | Tissue | Adj P-value | Log2FC | Malignancy |
| 2069 | EREG | HTA11_99999971662_82457 | Human | Colorectum | MSS | 9.14e-20 | 6.70e-01 | 0.3859 |
| 2069 | EREG | HTA11_99999974143_84620 | Human | Colorectum | MSS | 4.54e-12 | 2.76e-01 | 0.3005 |
| 2069 | EREG | A001-C-007 | Human | Colorectum | CRC | 2.82e-05 | 4.32e-01 | 0.1899 |
| 2069 | EREG | CRC-3-11773 | Human | Colorectum | CRC | 3.33e-43 | 9.81e-01 | 0.2564 |
| 2069 | EREG | LZE4T | Human | Esophagus | ESCC | 2.49e-12 | -8.76e-01 | 0.0811 |
| 2069 | EREG | LZE5T | Human | Esophagus | ESCC | 2.07e-15 | -5.96e-01 | 0.0514 |
| 2069 | EREG | LZE7T | Human | Esophagus | ESCC | 3.97e-06 | -8.76e-01 | 0.0667 |
| 2069 | EREG | LZE8T | Human | Esophagus | ESCC | 8.52e-07 | -7.32e-01 | 0.067 |
| 2069 | EREG | LZE20T | Human | Esophagus | ESCC | 2.57e-11 | -8.76e-01 | 0.0662 |
| 2069 | EREG | LZE22D1 | Human | Esophagus | HGIN | 6.87e-06 | -8.76e-01 | 0.0595 |
| 2069 | EREG | LZE24T | Human | Esophagus | ESCC | 4.87e-17 | -8.68e-01 | 0.0596 |
| 2069 | EREG | P1T-E | Human | Esophagus | ESCC | 6.09e-15 | -7.11e-01 | 0.0875 |
| 2069 | EREG | P2T-E | Human | Esophagus | ESCC | 7.21e-26 | -8.68e-01 | 0.1177 |
| 2069 | EREG | P4T-E | Human | Esophagus | ESCC | 1.40e-14 | -8.24e-01 | 0.1323 |
| 2069 | EREG | P5T-E | Human | Esophagus | ESCC | 2.87e-23 | -8.58e-01 | 0.1327 |
| 2069 | EREG | P8T-E | Human | Esophagus | ESCC | 2.27e-06 | -6.03e-01 | 0.0889 |
| 2069 | EREG | P9T-E | Human | Esophagus | ESCC | 6.97e-18 | -8.69e-01 | 0.1131 |
| 2069 | EREG | P10T-E | Human | Esophagus | ESCC | 3.02e-26 | -8.76e-01 | 0.116 |
| 2069 | EREG | P11T-E | Human | Esophagus | ESCC | 4.43e-07 | -4.10e-01 | 0.1426 |
| 2069 | EREG | P12T-E | Human | Esophagus | ESCC | 3.02e-26 | -8.67e-01 | 0.1122 |
| Page: 1 2 3 4 |
| Tissue | Expression Dynamics | Abbreviation |
| Colorectum (GSE201348) |  | FAP: Familial adenomatous polyposis |
| CRC: Colorectal cancer | ||
| Colorectum (HTA11) |  | AD: Adenomas |
| SER: Sessile serrated lesions | ||
| MSI-H: Microsatellite-high colorectal cancer | ||
| MSS: Microsatellite stable colorectal cancer | ||
| Esophagus | 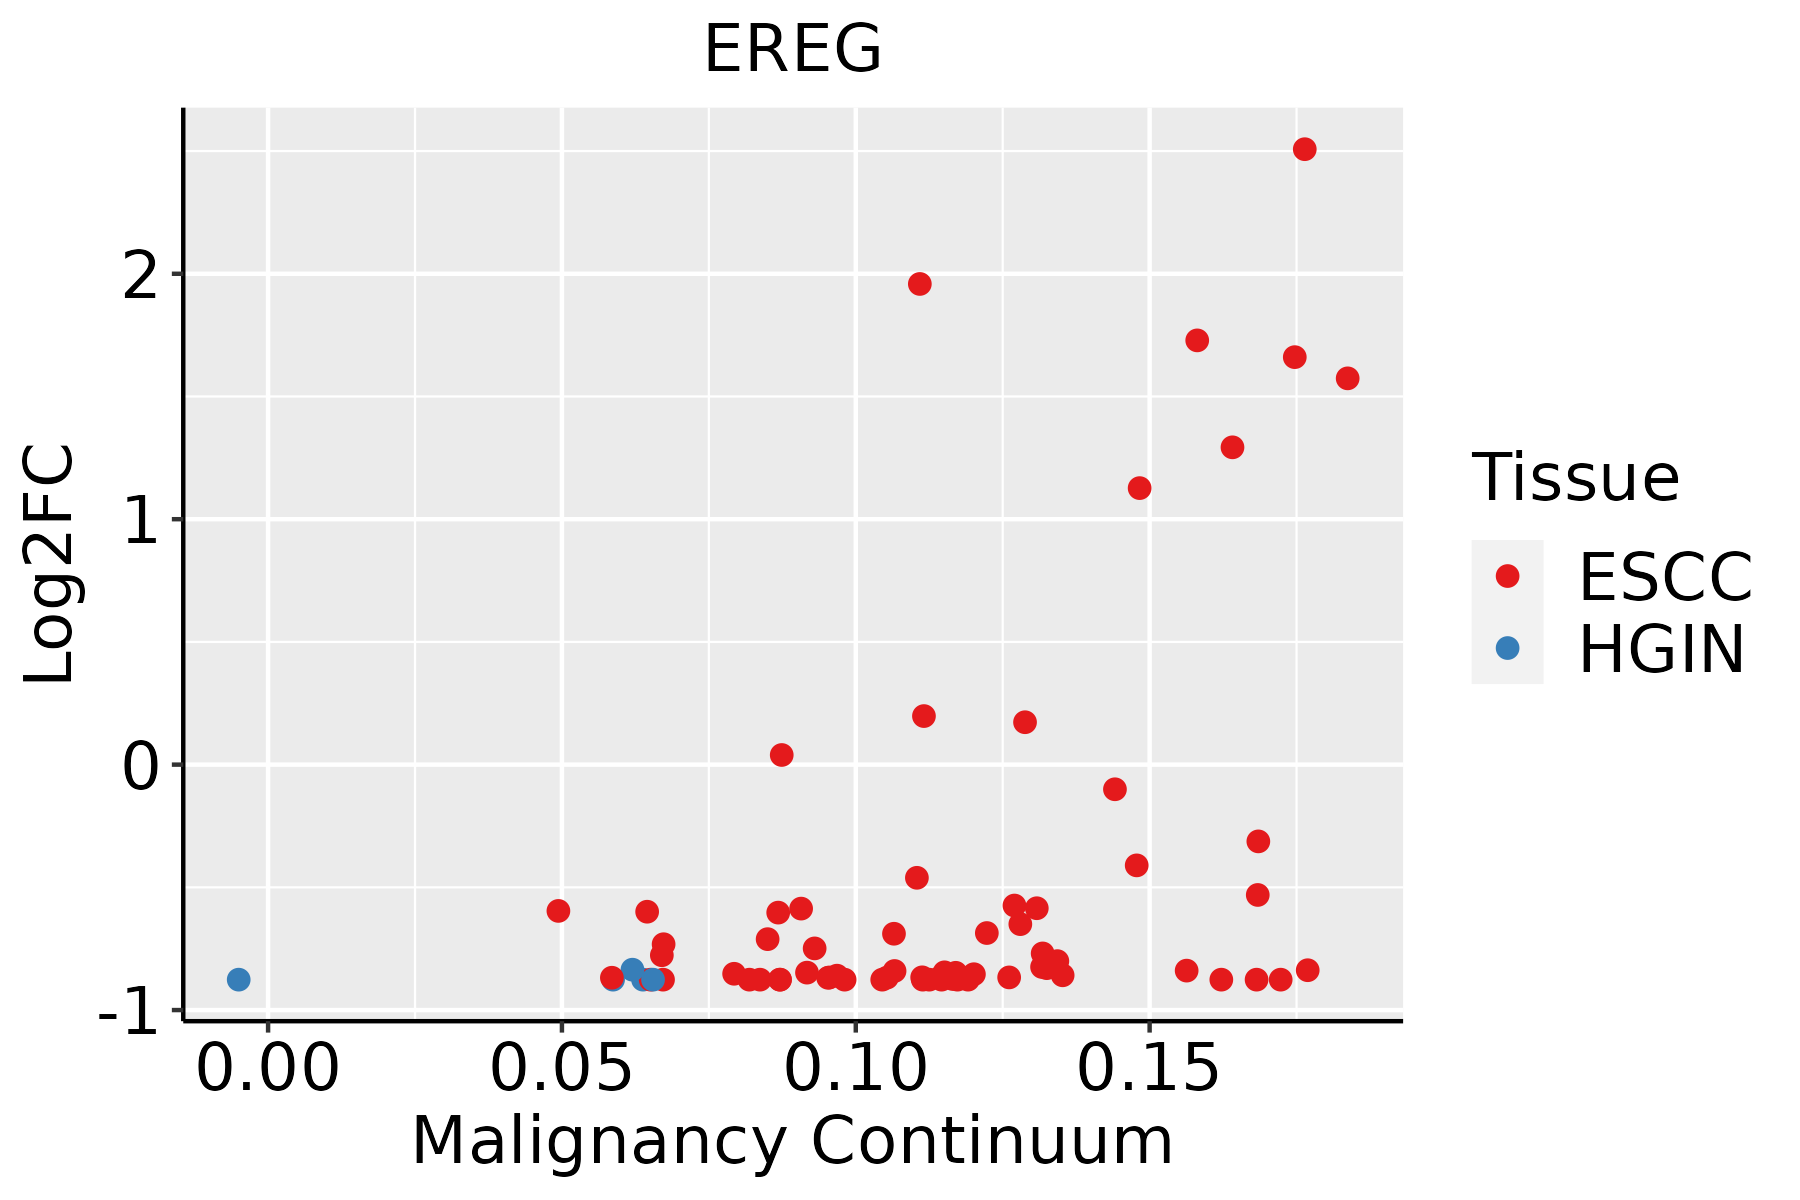 | ESCC: Esophageal squamous cell carcinoma |
| HGIN: High-grade intraepithelial neoplasias | ||
| LGIN: Low-grade intraepithelial neoplasias | ||
| Oral Cavity | 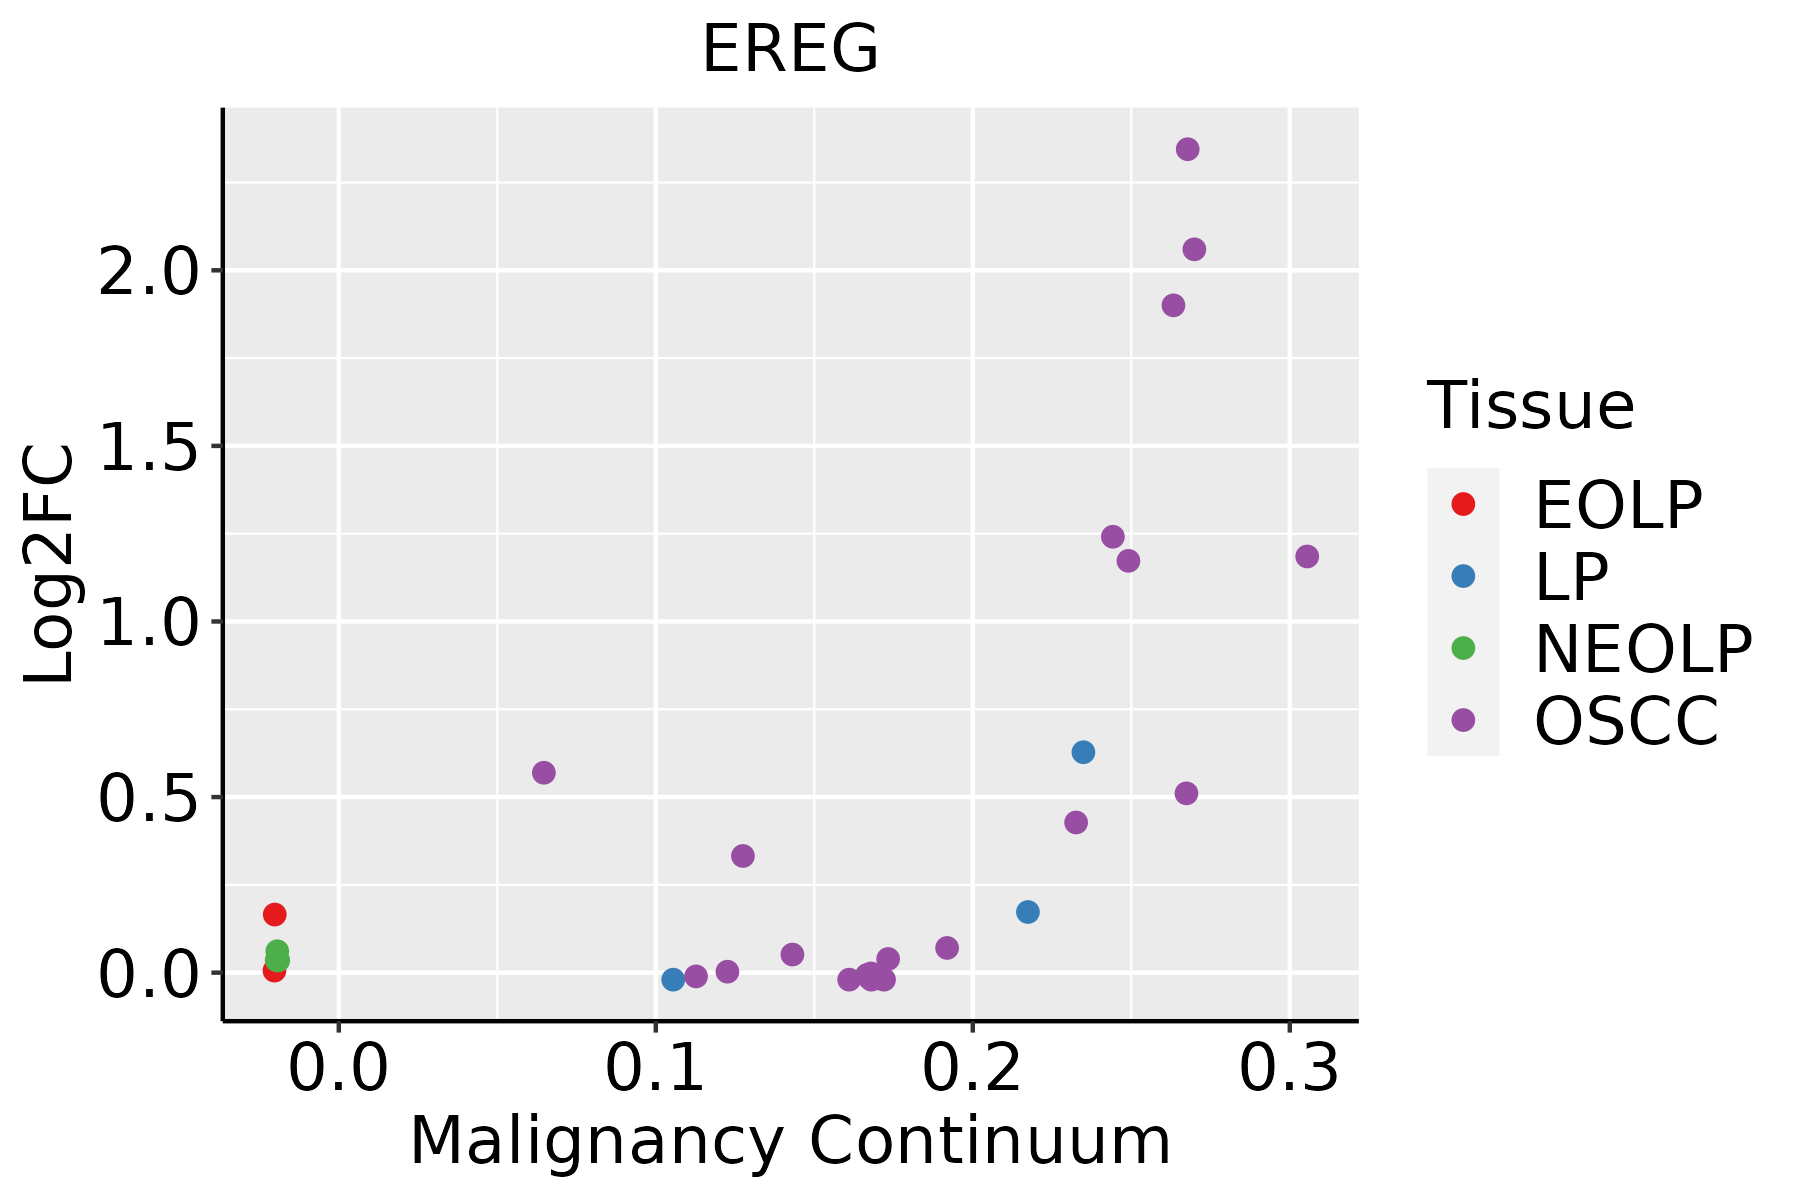 | EOLP: Erosive Oral lichen planus |
| LP: leukoplakia | ||
| NEOLP: Non-erosive oral lichen planus | ||
| OSCC: Oral squamous cell carcinoma | ||
| Skin | 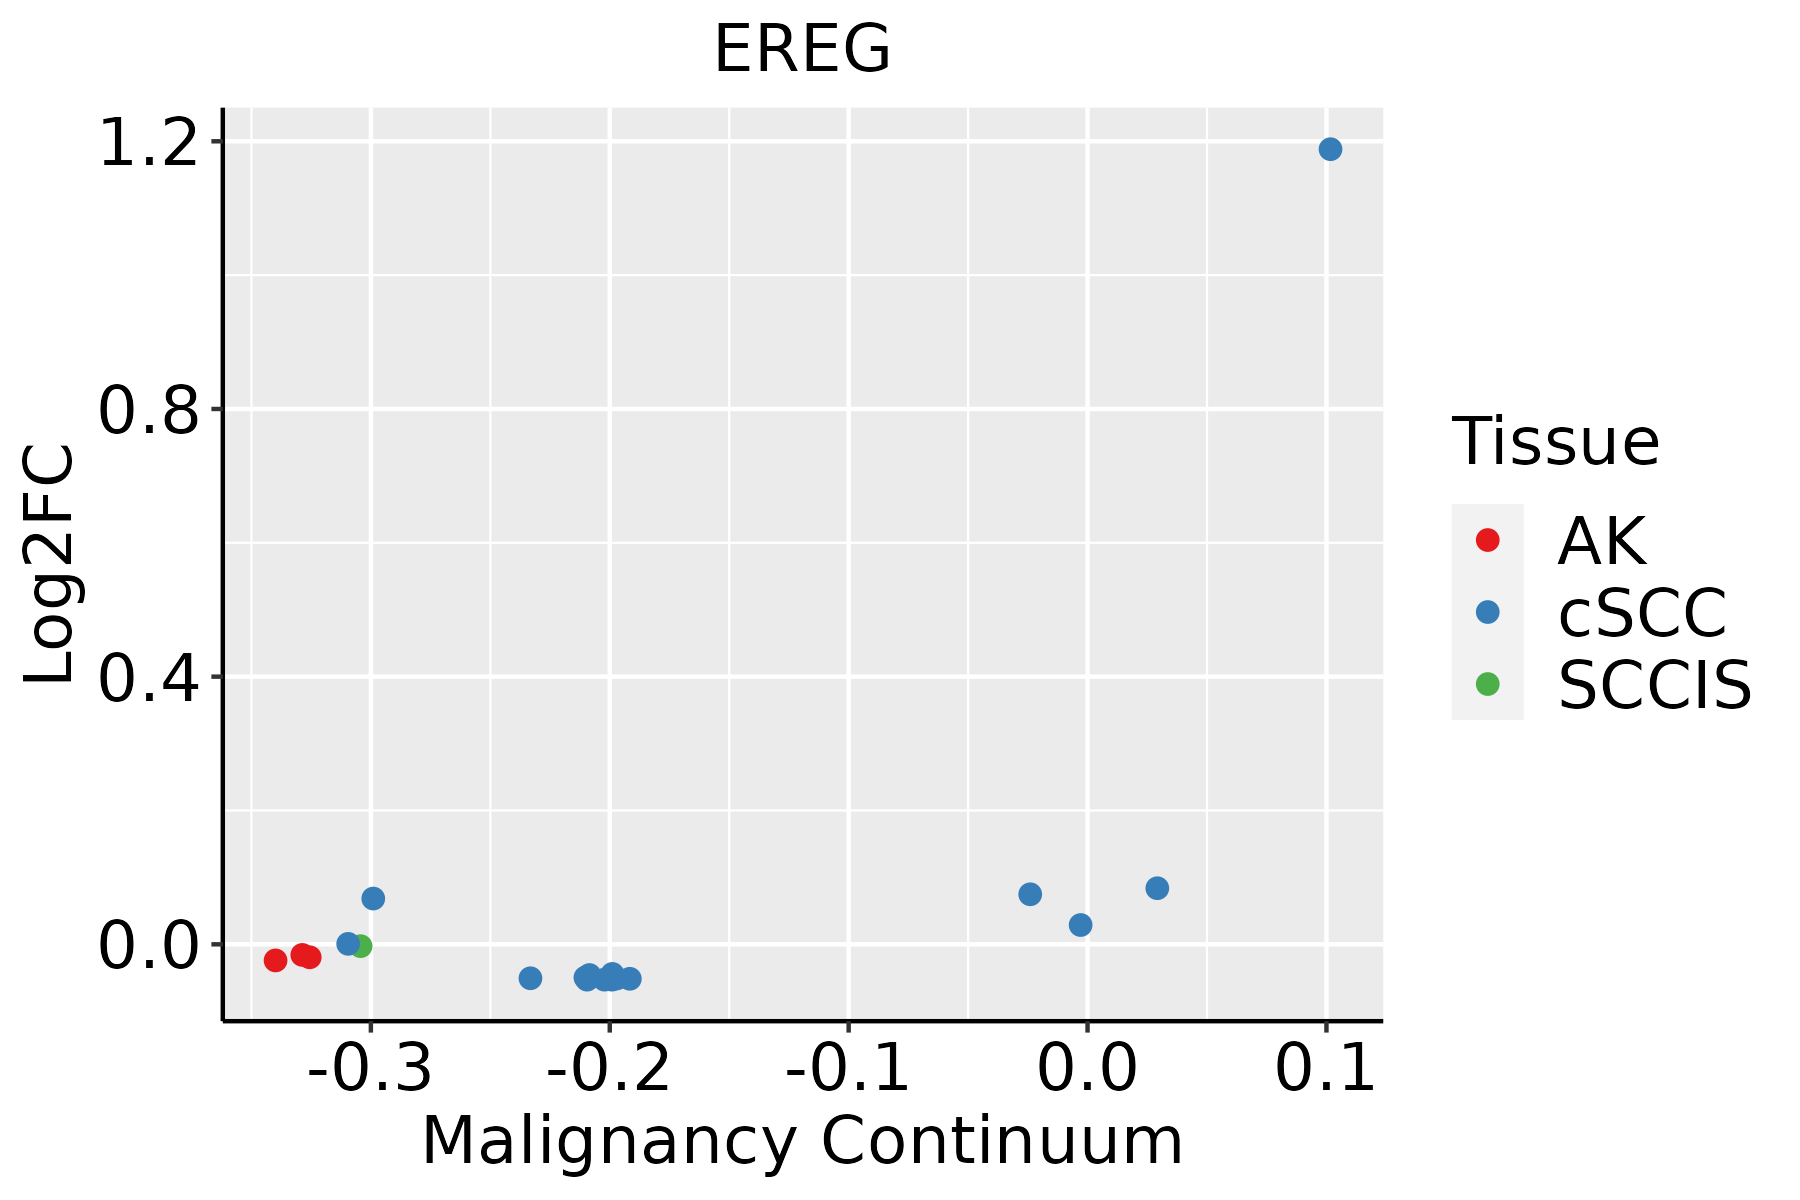 | AK: Actinic keratosis |
| cSCC: Cutaneous squamous cell carcinoma | ||
| SCCIS:squamous cell carcinoma in situ | ||
| Thyroid | 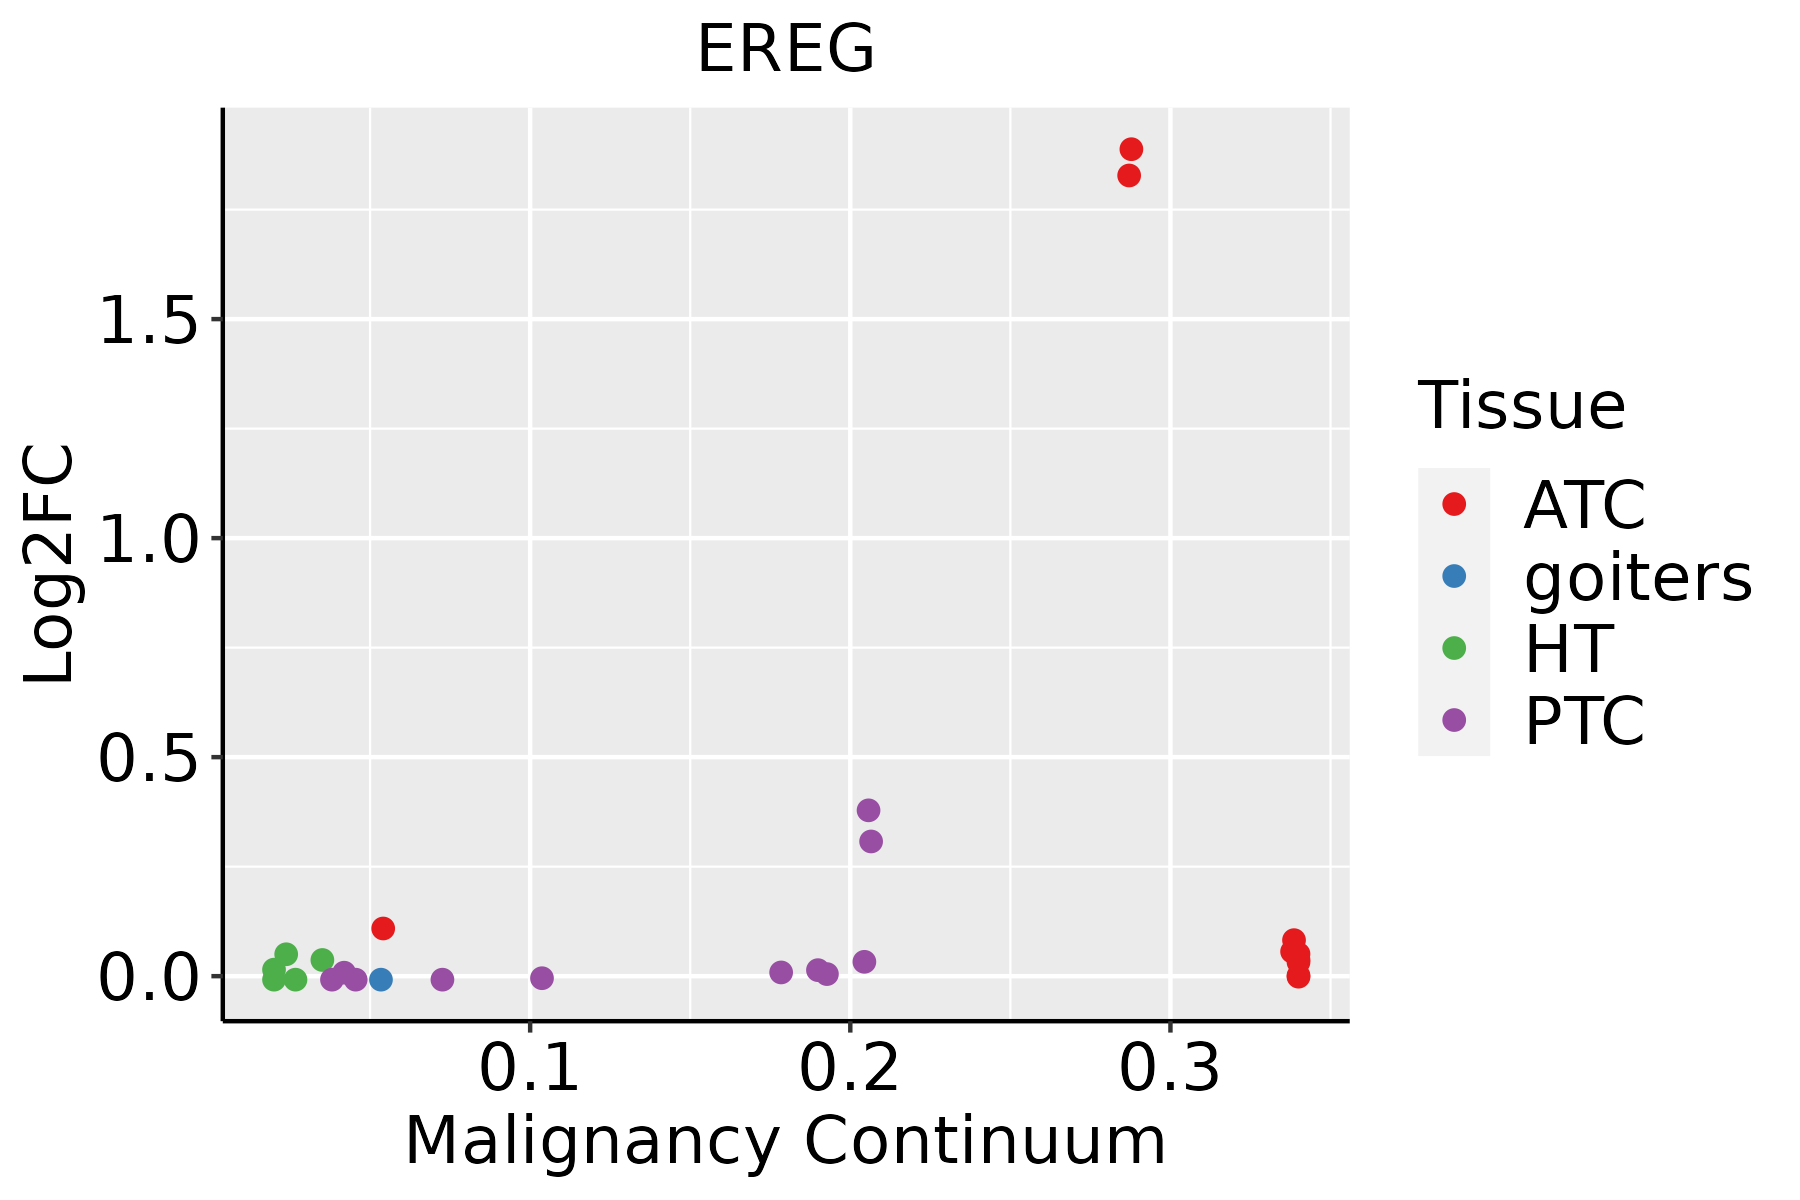 | ATC: Anaplastic thyroid cancer |
| HT: Hashimoto's thyroiditis | ||
| PTC: Papillary thyroid cancer |
| ∗log2FC in expression of this searched gene in stem-like cells from each diseased tissue sample relative to stem-like cells in normal samples in each tissue plotted against the malignancy continuum. Samples are colored based on if they are from different disease stage. |
Top |
Malignant transformation related pathway analysis |
| Find out the enriched GO biological processes and KEGG pathways involved in transition from healthy to precancer to cancer |
| Tissue | Disease Stage | Enriched GO biological Processes |
| Colorectum | AD |  |
| Colorectum | SER |  |
| Colorectum | MSS |  |
| Colorectum | MSI-H |  |
| Colorectum | FAP |  |
| ∗Top 15 enriched GO BP terms are showed in the bar plot of each disease state in each tissue. Each row represents a significant GO biological process which is colored according to the -log10(p.adjust). |
| Page: 1 2 3 4 5 6 7 8 9 |
| GO ID | Tissue | Disease Stage | Description | Gene Ratio | Bg Ratio | pvalue | p.adjust | Count |
| GO:00900688 | Oral cavity | OSCC | positive regulation of cell cycle process | 126/7305 | 236/18723 | 4.75e-06 | 5.44e-05 | 126 |
| GO:003367418 | Oral cavity | OSCC | positive regulation of kinase activity | 228/7305 | 467/18723 | 8.31e-06 | 8.90e-05 | 228 |
| GO:19011847 | Oral cavity | OSCC | regulation of ERBB signaling pathway | 50/7305 | 79/18723 | 1.06e-05 | 1.12e-04 | 50 |
| GO:00099139 | Oral cavity | OSCC | epidermal cell differentiation | 109/7305 | 202/18723 | 1.08e-05 | 1.14e-04 | 109 |
| GO:00450884 | Oral cavity | OSCC | regulation of innate immune response | 116/7305 | 218/18723 | 1.36e-05 | 1.37e-04 | 116 |
| GO:00420587 | Oral cavity | OSCC | regulation of epidermal growth factor receptor signaling pathway | 46/7305 | 73/18723 | 2.80e-05 | 2.59e-04 | 46 |
| GO:005067310 | Oral cavity | OSCC | epithelial cell proliferation | 212/7305 | 437/18723 | 2.82e-05 | 2.61e-04 | 212 |
| GO:0051783 | Oral cavity | OSCC | regulation of nuclear division | 78/7305 | 139/18723 | 3.13e-05 | 2.86e-04 | 78 |
| GO:00062753 | Oral cavity | OSCC | regulation of DNA replication | 62/7305 | 107/18723 | 5.49e-05 | 4.54e-04 | 62 |
| GO:00481446 | Oral cavity | OSCC | fibroblast proliferation | 49/7305 | 81/18723 | 7.27e-05 | 5.72e-04 | 49 |
| GO:00481457 | Oral cavity | OSCC | regulation of fibroblast proliferation | 48/7305 | 80/18723 | 1.14e-04 | 8.35e-04 | 48 |
| GO:00321037 | Oral cavity | OSCC | positive regulation of response to external stimulus | 203/7305 | 427/18723 | 1.79e-04 | 1.22e-03 | 203 |
| GO:00192214 | Oral cavity | OSCC | cytokine-mediated signaling pathway | 222/7305 | 472/18723 | 2.02e-04 | 1.35e-03 | 222 |
| GO:00182123 | Oral cavity | OSCC | peptidyl-tyrosine modification | 180/7305 | 378/18723 | 3.63e-04 | 2.22e-03 | 180 |
| GO:005067810 | Oral cavity | OSCC | regulation of epithelial cell proliferation | 180/7305 | 381/18723 | 5.88e-04 | 3.35e-03 | 180 |
| GO:0050730 | Oral cavity | OSCC | regulation of peptidyl-tyrosine phosphorylation | 129/7305 | 264/18723 | 6.70e-04 | 3.75e-03 | 129 |
| GO:00181083 | Oral cavity | OSCC | peptidyl-tyrosine phosphorylation | 177/7305 | 375/18723 | 6.86e-04 | 3.83e-03 | 177 |
| GO:0045840 | Oral cavity | OSCC | positive regulation of mitotic nuclear division | 27/7305 | 43/18723 | 1.35e-03 | 6.62e-03 | 27 |
| GO:000181910 | Oral cavity | OSCC | positive regulation of cytokine production | 213/7305 | 467/18723 | 1.93e-03 | 8.96e-03 | 213 |
| GO:00436166 | Oral cavity | OSCC | keratinocyte proliferation | 28/7305 | 46/18723 | 2.19e-03 | 9.95e-03 | 28 |
| Page: 1 2 3 4 5 6 7 8 9 10 11 12 13 |
| Pathway ID | Tissue | Disease Stage | Description | Gene Ratio | Bg Ratio | pvalue | p.adjust | qvalue | Count |
| hsa052102 | Colorectum | MSS | Colorectal cancer | 36/1875 | 86/8465 | 3.08e-05 | 3.22e-04 | 1.97e-04 | 36 |
| hsa040122 | Colorectum | MSS | ErbB signaling pathway | 30/1875 | 85/8465 | 3.73e-03 | 1.67e-02 | 1.02e-02 | 30 |
| hsa052103 | Colorectum | MSS | Colorectal cancer | 36/1875 | 86/8465 | 3.08e-05 | 3.22e-04 | 1.97e-04 | 36 |
| hsa040123 | Colorectum | MSS | ErbB signaling pathway | 30/1875 | 85/8465 | 3.73e-03 | 1.67e-02 | 1.02e-02 | 30 |
| hsa040126 | Colorectum | CRC | ErbB signaling pathway | 24/1091 | 85/8465 | 1.23e-04 | 1.79e-03 | 1.21e-03 | 24 |
| hsa041512 | Colorectum | CRC | PI3K-Akt signaling pathway | 64/1091 | 354/8465 | 2.70e-03 | 1.77e-02 | 1.20e-02 | 64 |
| hsa040102 | Colorectum | CRC | MAPK signaling pathway | 56/1091 | 302/8465 | 2.76e-03 | 1.77e-02 | 1.20e-02 | 56 |
| hsa040127 | Colorectum | CRC | ErbB signaling pathway | 24/1091 | 85/8465 | 1.23e-04 | 1.79e-03 | 1.21e-03 | 24 |
| hsa041513 | Colorectum | CRC | PI3K-Akt signaling pathway | 64/1091 | 354/8465 | 2.70e-03 | 1.77e-02 | 1.20e-02 | 64 |
| hsa040103 | Colorectum | CRC | MAPK signaling pathway | 56/1091 | 302/8465 | 2.76e-03 | 1.77e-02 | 1.20e-02 | 56 |
| hsa0521020 | Esophagus | ESCC | Colorectal cancer | 69/4205 | 86/8465 | 4.06e-09 | 4.13e-08 | 2.11e-08 | 69 |
| hsa0401218 | Esophagus | ESCC | ErbB signaling pathway | 56/4205 | 85/8465 | 1.78e-03 | 5.24e-03 | 2.68e-03 | 56 |
| hsa041517 | Esophagus | ESCC | PI3K-Akt signaling pathway | 197/4205 | 354/8465 | 1.24e-02 | 2.83e-02 | 1.45e-02 | 197 |
| hsa05210110 | Esophagus | ESCC | Colorectal cancer | 69/4205 | 86/8465 | 4.06e-09 | 4.13e-08 | 2.11e-08 | 69 |
| hsa0401219 | Esophagus | ESCC | ErbB signaling pathway | 56/4205 | 85/8465 | 1.78e-03 | 5.24e-03 | 2.68e-03 | 56 |
| hsa0415114 | Esophagus | ESCC | PI3K-Akt signaling pathway | 197/4205 | 354/8465 | 1.24e-02 | 2.83e-02 | 1.45e-02 | 197 |
| hsa0521018 | Oral cavity | OSCC | Colorectal cancer | 66/3704 | 86/8465 | 3.99e-10 | 4.95e-09 | 2.52e-09 | 66 |
| hsa0401014 | Oral cavity | OSCC | MAPK signaling pathway | 165/3704 | 302/8465 | 7.11e-05 | 2.74e-04 | 1.40e-04 | 165 |
| hsa0401216 | Oral cavity | OSCC | ErbB signaling pathway | 55/3704 | 85/8465 | 7.46e-05 | 2.81e-04 | 1.43e-04 | 55 |
| hsa041516 | Oral cavity | OSCC | PI3K-Akt signaling pathway | 185/3704 | 354/8465 | 6.26e-04 | 1.86e-03 | 9.49e-04 | 185 |
| Page: 1 2 |
Top |
Cell-cell communication analysis |
| Identification of potential cell-cell interactions between two cell types and their ligand-receptor pairs for different disease states |
| Ligand | Receptor | LRpair | Pathway | Tissue | Disease Stage |
| EREG | EGFR | EREG_EGFR | EGF | Breast | DCIS |
| EREG | EGFR_ERBB2 | EREG_EGFR_ERBB2 | EGF | Breast | DCIS |
| EREG | EGFR | EREG_EGFR | EGF | Breast | Healthy |
| EREG | EGFR | EREG_EGFR | EGF | Breast | Precancer |
| EREG | EGFR | EREG_EGFR | EGF | Cervix | Precancer |
| EREG | EGFR | EREG_EGFR | EGF | Endometrium | ADJ |
| EREG | ERBB4 | EREG_ERBB4 | EGF | Endometrium | ADJ |
| EREG | EGFR | EREG_EGFR | EGF | Endometrium | AEH |
| EREG | ERBB4 | EREG_ERBB4 | EGF | Endometrium | AEH |
| EREG | EGFR | EREG_EGFR | EGF | Endometrium | EEC |
| EREG | ERBB4 | EREG_ERBB4 | EGF | Endometrium | EEC |
| EREG | EGFR | EREG_EGFR | EGF | Endometrium | Healthy |
| EREG | EGFR | EREG_EGFR | EGF | HNSCC | ADJ |
| EREG | EGFR_ERBB2 | EREG_EGFR_ERBB2 | EGF | HNSCC | ADJ |
| EREG | EGFR | EREG_EGFR | EGF | HNSCC | Healthy |
| EREG | EGFR | EREG_EGFR | EGF | HNSCC | OSCC |
| EREG | EGFR_ERBB2 | EREG_EGFR_ERBB2 | EGF | HNSCC | OSCC |
| EREG | EGFR | EREG_EGFR | EGF | HNSCC | Precancer |
| EREG | EGFR_ERBB2 | EREG_EGFR_ERBB2 | EGF | HNSCC | Precancer |
| EREG | EGFR | EREG_EGFR | EGF | Liver | Healthy |
| Page: 1 2 3 |
Top |
Single-cell gene regulatory network inference analysis |
| Find out the significant the regulons (TFs) and the target genes of each regulon across cell types for different disease states |
| TF | Cell Type | Tissue | Disease Stage | Target Gene | RSS | Regulon Activity |
| ∗The dot plots of a searched regulon are shown for all cell subpopulations in each disease state of each tissue based on the regulon specific score inferred using pySCENIC and by calculating the average expression. |
| Page: 1 |
Top |
Somatic mutation of malignant transformation related genes |
| Annotation of somatic variants for genes involved in malignant transformation |
| Hugo Symbol | Variant Class | Variant Classification | dbSNP RS | HGVSc | HGVSp | HGVSp Short | SWISSPROT | BIOTYPE | SIFT | PolyPhen | Tumor Sample Barcode | Tissue | Histology | Sex | Age | Stage | Therapy Types | Drugs | Outcome |
| EREG | insertion | Frame_Shift_Ins | novel | c.356_357insTCTCA | p.Ala120LeufsTer4 | p.A120Lfs*4 | O14944 | protein_coding | TCGA-B6-A0IN-01 | Breast | breast invasive carcinoma | Female | <65 | I/II | Unknown | Unknown | PD | ||
| EREG | insertion | Nonsense_Mutation | novel | c.357_358insTTCTGAAATTCGTTATTCCCCAAA | p.Val119_Ala120insPheTerAsnSerLeuPheProLys | p.V119_A120insF*NSLFPK | O14944 | protein_coding | TCGA-B6-A0IN-01 | Breast | breast invasive carcinoma | Female | <65 | I/II | Unknown | Unknown | PD | ||
| EREG | insertion | Frame_Shift_Ins | novel | c.174_175insT | p.Arg59SerfsTer11 | p.R59Sfs*11 | O14944 | protein_coding | TCGA-DS-A1OA-01 | Cervix | cervical & endocervical cancer | Female | >=65 | I/II | Chemotherapy | carboplatin | PD | ||
| EREG | insertion | Frame_Shift_Ins | novel | c.175_176insTCTTGAACATGTACTATGTACCA | p.Arg59LeufsTer15 | p.R59Lfs*15 | O14944 | protein_coding | TCGA-DS-A1OA-01 | Cervix | cervical & endocervical cancer | Female | >=65 | I/II | Chemotherapy | carboplatin | PD | ||
| EREG | SNV | Missense_Mutation | novel | c.434G>A | p.Arg145Lys | p.R145K | O14944 | protein_coding | tolerated(0.68) | benign(0) | TCGA-EI-6917-01 | Colorectum | rectum adenocarcinoma | Male | <65 | III/IV | Chemotherapy | 5fluorouracil+oxaciplatina+l-folinian | SD |
| EREG | SNV | Missense_Mutation | novel | c.403G>A | p.Gly135Ser | p.G135S | O14944 | protein_coding | deleterious(0.02) | probably_damaging(0.963) | TCGA-A5-A0G2-01 | Endometrium | uterine corpus endometrioid carcinoma | Female | <65 | III/IV | Unknown | Unknown | SD |
| EREG | SNV | Missense_Mutation | novel | c.318N>A | p.Phe106Leu | p.F106L | O14944 | protein_coding | tolerated(1) | benign(0.019) | TCGA-A5-A2K5-01 | Endometrium | uterine corpus endometrioid carcinoma | Female | >=65 | I/II | Unknown | Unknown | SD |
| EREG | SNV | Missense_Mutation | novel | c.11N>A | p.Gly4Glu | p.G4E | O14944 | protein_coding | tolerated_low_confidence(0.86) | benign(0.001) | TCGA-AP-A1DK-01 | Endometrium | uterine corpus endometrioid carcinoma | Female | <65 | I/II | Unknown | Unknown | SD |
| EREG | SNV | Missense_Mutation | novel | c.242N>A | p.Cys81Tyr | p.C81Y | O14944 | protein_coding | deleterious(0) | probably_damaging(0.999) | TCGA-AX-A1CE-01 | Endometrium | uterine corpus endometrioid carcinoma | Female | <65 | I/II | Unspecific | Paclitaxel | SD |
| EREG | SNV | Missense_Mutation | novel | c.24G>T | p.Glu8Asp | p.E8D | O14944 | protein_coding | tolerated_low_confidence(0.32) | benign(0.003) | TCGA-B5-A1MR-01 | Endometrium | uterine corpus endometrioid carcinoma | Female | >=65 | III/IV | Unknown | Unknown | SD |
| Page: 1 2 3 |
Top |
Related drugs of malignant transformation related genes |
| Identification of chemicals and drugs interact with genes involved in malignant transfromation |
| (DGIdb 4.0) |
| Entrez ID | Symbol | Category | Interaction Types | Drug Claim Name | Drug Name | PMIDs |
| 2069 | EREG | KINASE, GROWTH FACTOR, DRUGGABLE GENOME | cetuximab | CETUXIMAB | ||
| 2069 | EREG | KINASE, GROWTH FACTOR, DRUGGABLE GENOME | CETUXIMAB | CETUXIMAB | 23374602 | |
| 2069 | EREG | KINASE, GROWTH FACTOR, DRUGGABLE GENOME | PANITUMUMAB | PANITUMUMAB | 26867820 | |
| 2069 | EREG | KINASE, GROWTH FACTOR, DRUGGABLE GENOME | panitumumab | PANITUMUMAB | ||
| 2069 | EREG | KINASE, GROWTH FACTOR, DRUGGABLE GENOME | HUMAN CHORIONIC GONADOTROPIN | 16543407 | ||
| 2069 | EREG | KINASE, GROWTH FACTOR, DRUGGABLE GENOME | LY3016859 |
| Page: 1 |

Copyright 2023-Present -The University of Texas Health Science Center at Houston |