
|
|||||
|
 | |
| |
| |
| |
| |
| |
|
Gene: DYNLT1 |
Gene summary for DYNLT1 |
| Gene information | Species | Human | Gene symbol | DYNLT1 | Gene ID | 6993 |
| Gene name | dynein light chain Tctex-type 1 | |
| Gene Alias | CW-1 | |
| Cytomap | 6q25.3 | |
| Gene Type | protein-coding | GO ID | GO:0000132 | UniProtAcc | P63172 |
Top |
Malignant transformation analysis |
| Identification of the aberrant gene expression in precancerous and cancerous lesions by comparing the gene expression of stem-like cells in diseased tissues with normal stem cells |
| Entrez ID | Symbol | Replicates | Species | Organ | Tissue | Adj P-value | Log2FC | Malignancy |
| 6993 | DYNLT1 | GSM4909281 | Human | Breast | IDC | 3.29e-12 | 4.26e-01 | 0.21 |
| 6993 | DYNLT1 | GSM4909285 | Human | Breast | IDC | 1.91e-24 | 5.55e-01 | 0.21 |
| 6993 | DYNLT1 | GSM4909286 | Human | Breast | IDC | 2.36e-03 | 2.87e-01 | 0.1081 |
| 6993 | DYNLT1 | GSM4909288 | Human | Breast | IDC | 3.29e-02 | -1.42e-01 | 0.0988 |
| 6993 | DYNLT1 | GSM4909290 | Human | Breast | IDC | 2.23e-22 | 5.73e-01 | 0.2096 |
| 6993 | DYNLT1 | GSM4909294 | Human | Breast | IDC | 2.04e-20 | 3.07e-01 | 0.2022 |
| 6993 | DYNLT1 | GSM4909296 | Human | Breast | IDC | 3.97e-10 | -1.13e-01 | 0.1524 |
| 6993 | DYNLT1 | GSM4909297 | Human | Breast | IDC | 5.35e-22 | -4.15e-01 | 0.1517 |
| 6993 | DYNLT1 | GSM4909298 | Human | Breast | IDC | 1.25e-02 | 2.46e-01 | 0.1551 |
| 6993 | DYNLT1 | GSM4909301 | Human | Breast | IDC | 8.10e-12 | 2.94e-01 | 0.1577 |
| 6993 | DYNLT1 | GSM4909306 | Human | Breast | IDC | 2.17e-21 | 5.30e-01 | 0.1564 |
| 6993 | DYNLT1 | GSM4909307 | Human | Breast | IDC | 4.61e-25 | 5.05e-01 | 0.1569 |
| 6993 | DYNLT1 | GSM4909308 | Human | Breast | IDC | 5.88e-35 | 6.15e-01 | 0.158 |
| 6993 | DYNLT1 | GSM4909311 | Human | Breast | IDC | 3.13e-44 | -2.60e-01 | 0.1534 |
| 6993 | DYNLT1 | GSM4909312 | Human | Breast | IDC | 3.81e-09 | -2.29e-02 | 0.1552 |
| 6993 | DYNLT1 | GSM4909315 | Human | Breast | IDC | 1.12e-49 | 7.39e-01 | 0.21 |
| 6993 | DYNLT1 | GSM4909316 | Human | Breast | IDC | 2.19e-23 | 5.85e-01 | 0.21 |
| 6993 | DYNLT1 | GSM4909318 | Human | Breast | IDC | 7.90e-04 | 1.91e-01 | 0.2031 |
| 6993 | DYNLT1 | GSM4909319 | Human | Breast | IDC | 1.17e-53 | -4.14e-01 | 0.1563 |
| 6993 | DYNLT1 | GSM4909320 | Human | Breast | IDC | 2.40e-06 | -2.39e-01 | 0.1575 |
| Page: 1 2 3 4 5 6 7 8 9 10 11 12 13 14 |
| Tissue | Expression Dynamics | Abbreviation |
| Breast | 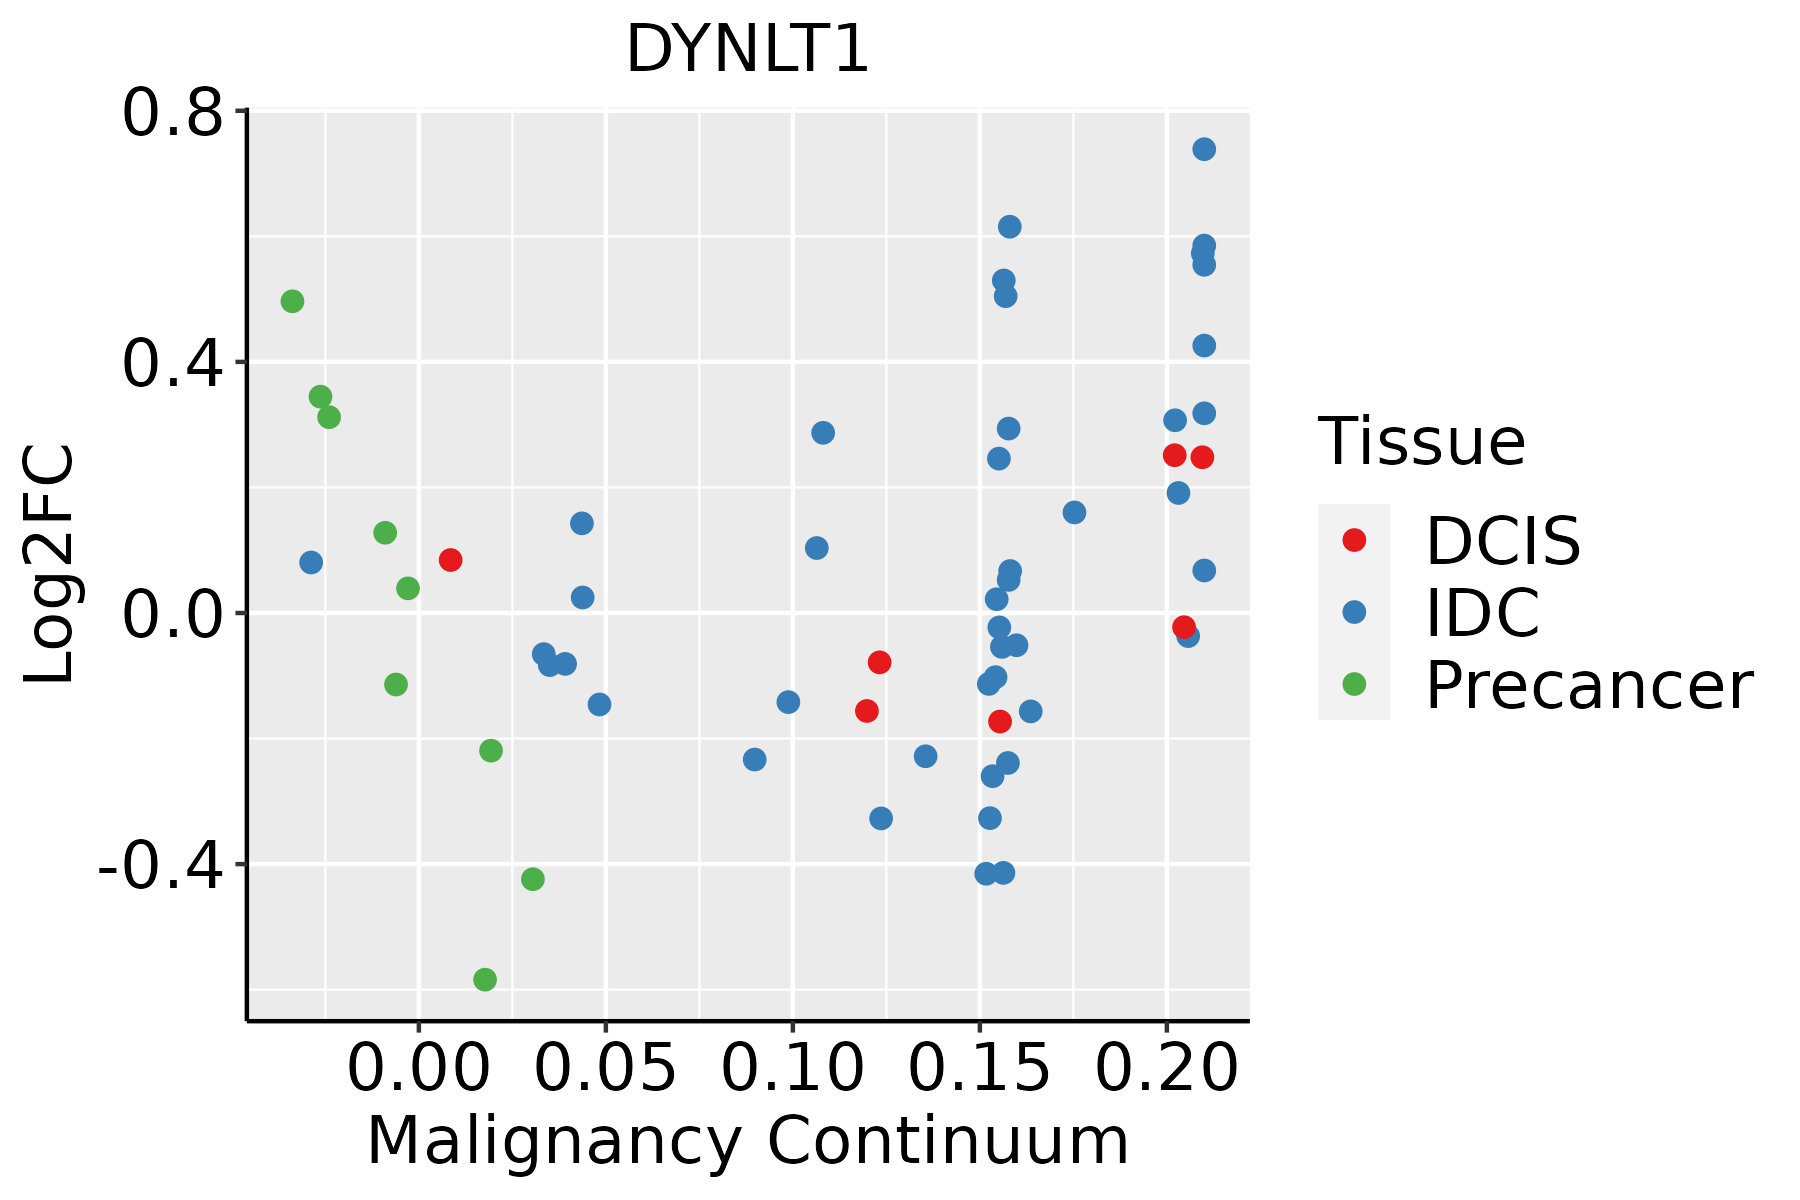 | IDC: Invasive ductal carcinoma |
| DCIS: Ductal carcinoma in situ | ||
| Precancer(BRCA1-mut): Precancerous lesion from BRCA1 mutation carriers | ||
| Cervix | 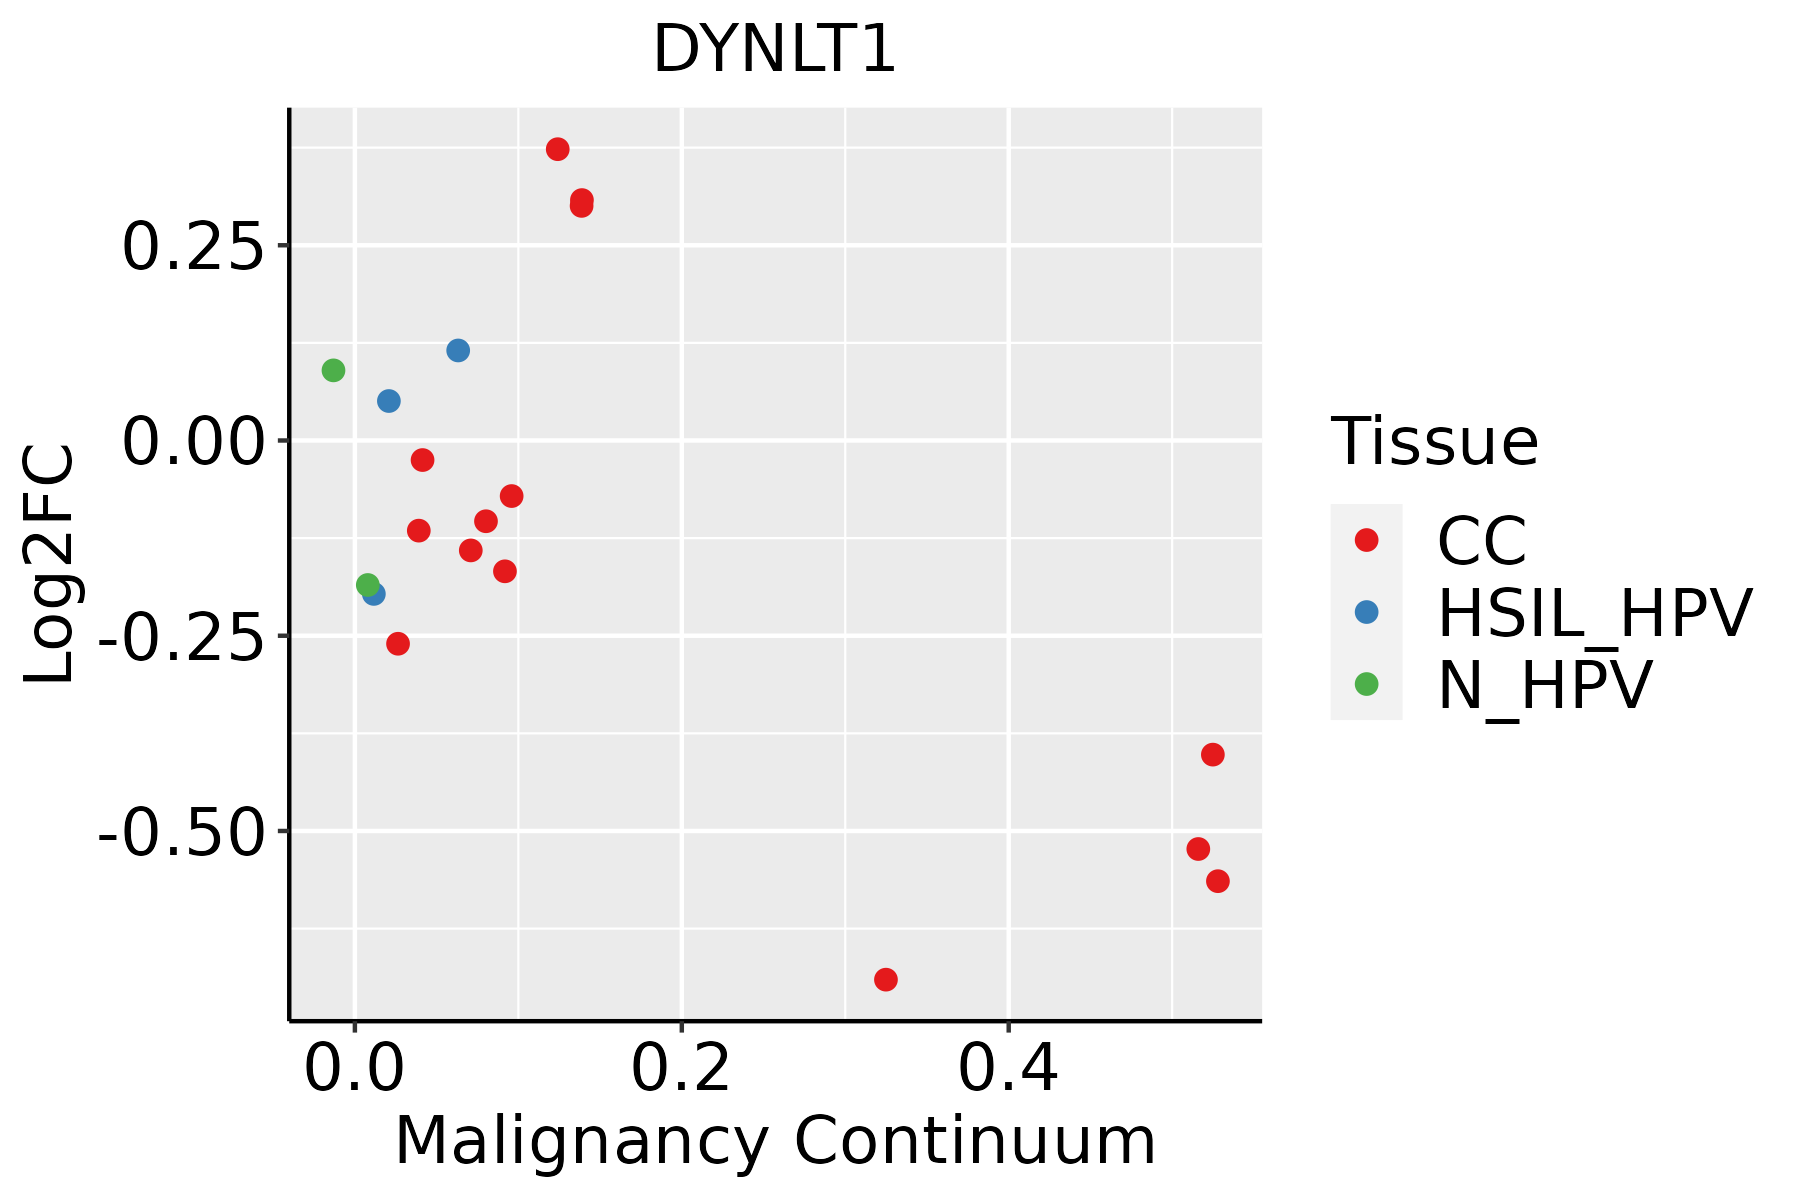 | CC: Cervix cancer |
| HSIL_HPV: HPV-infected high-grade squamous intraepithelial lesions | ||
| N_HPV: HPV-infected normal cervix | ||
| Colorectum (GSE201348) | 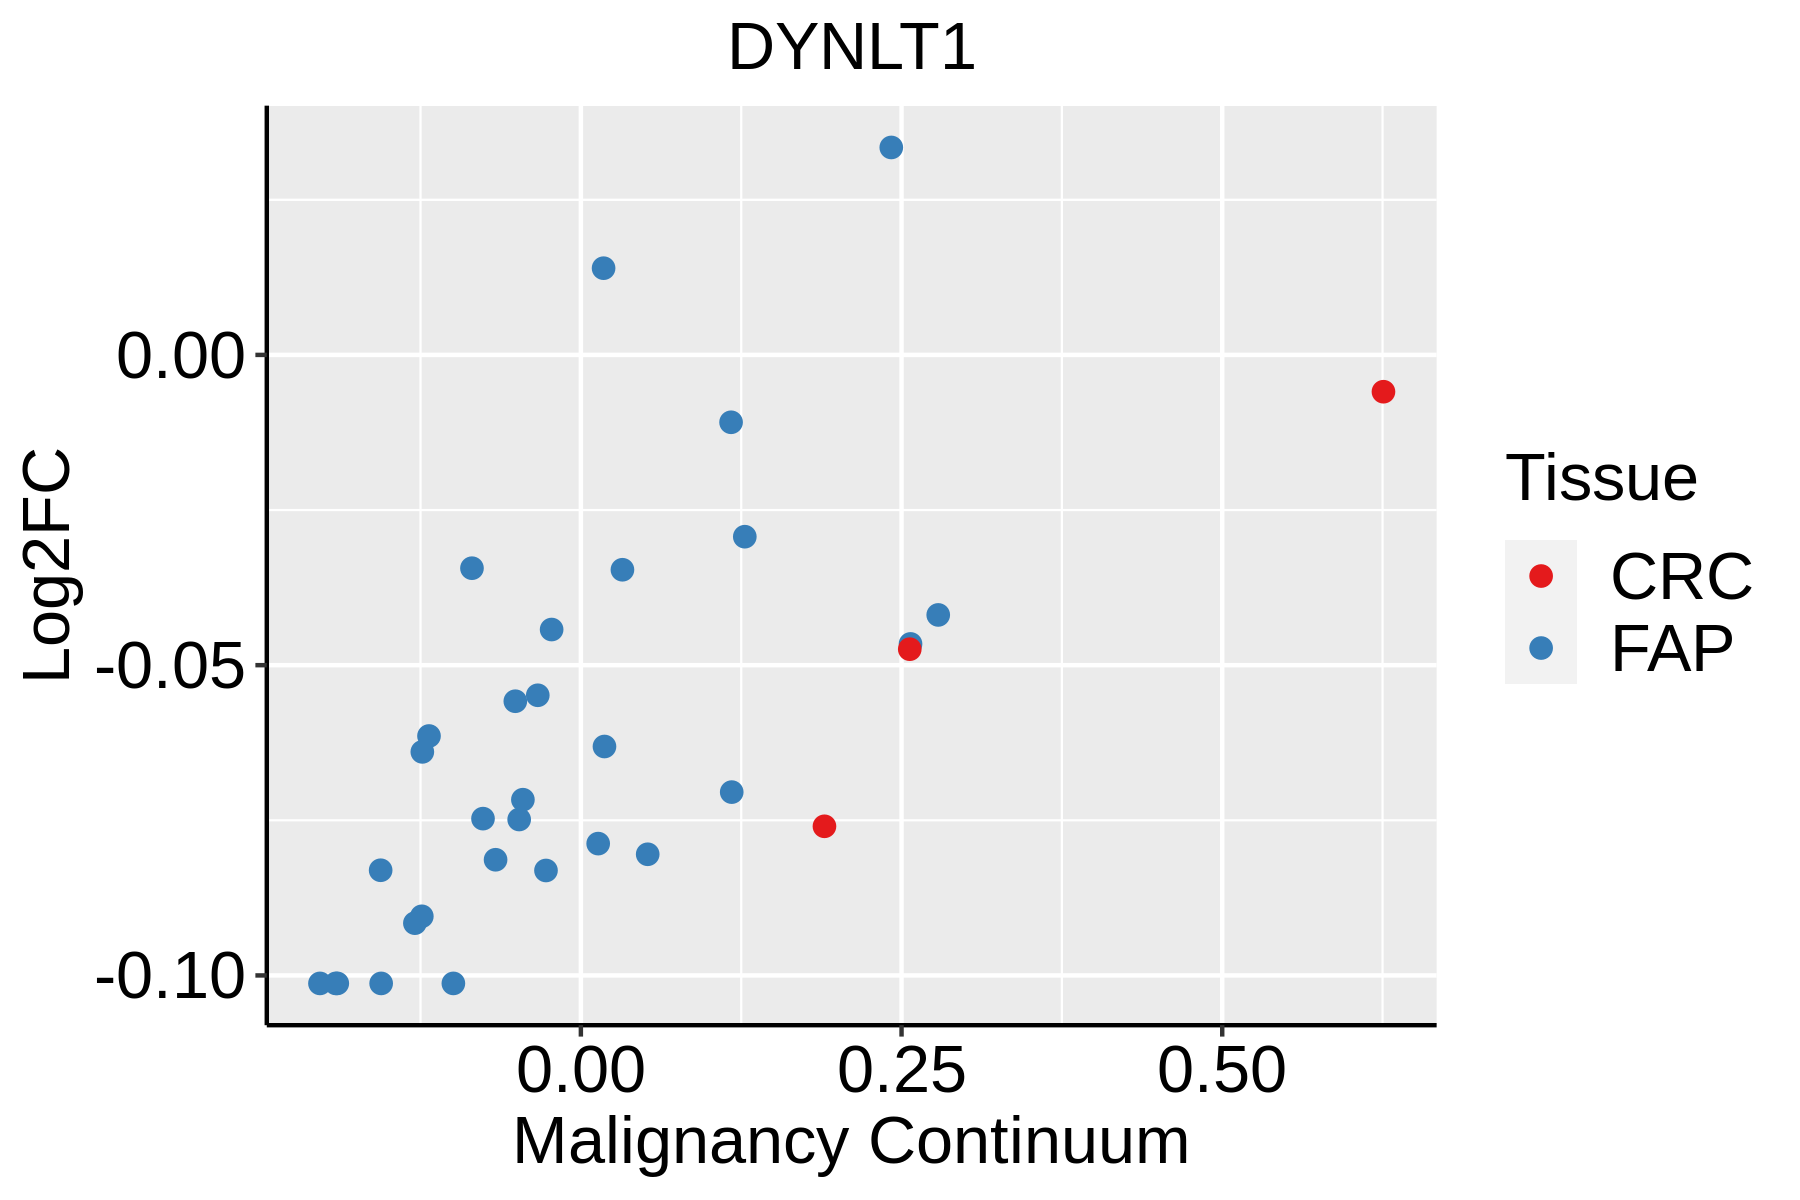 | FAP: Familial adenomatous polyposis |
| CRC: Colorectal cancer | ||
| Colorectum (HTA11) |  | AD: Adenomas |
| SER: Sessile serrated lesions | ||
| MSI-H: Microsatellite-high colorectal cancer | ||
| MSS: Microsatellite stable colorectal cancer | ||
| Endometrium | 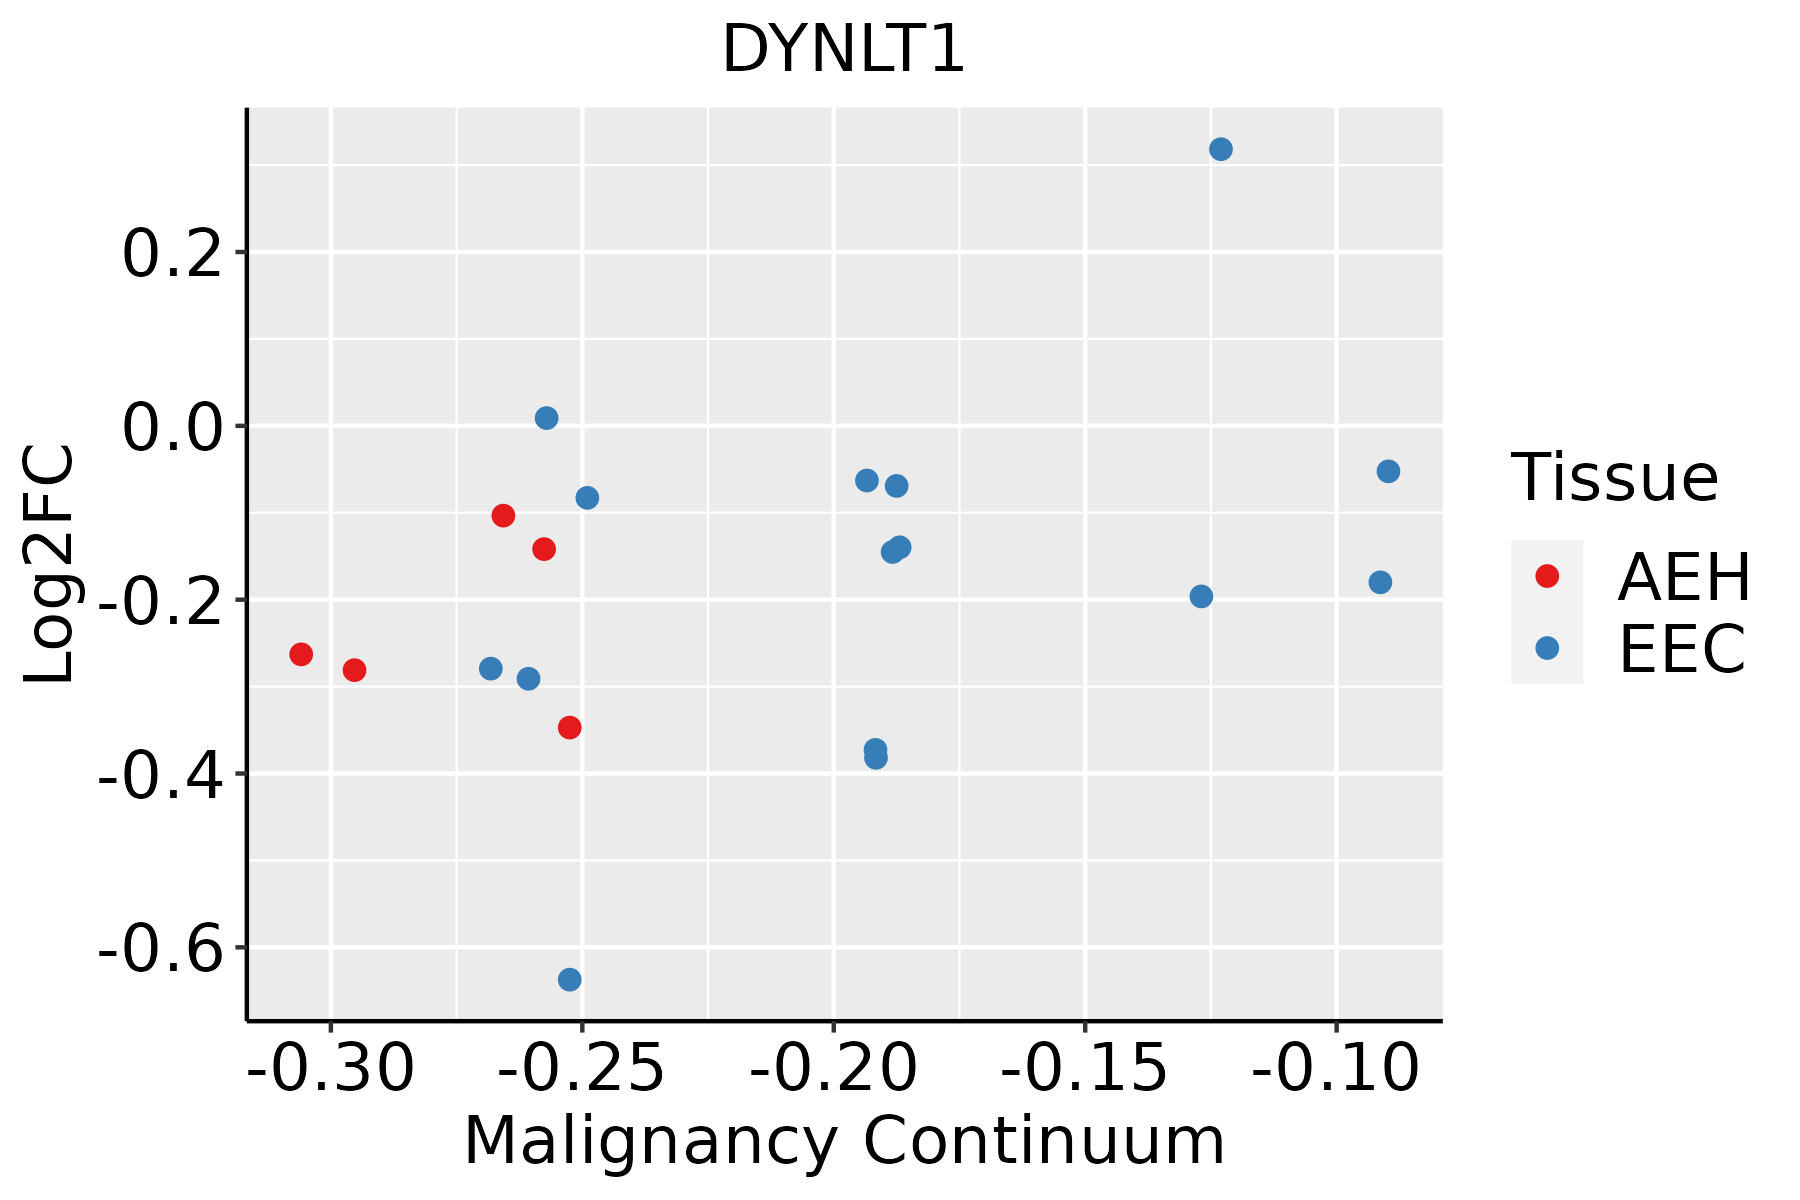 | AEH: Atypical endometrial hyperplasia |
| EEC: Endometrioid Cancer | ||
| Esophagus |  | ESCC: Esophageal squamous cell carcinoma |
| HGIN: High-grade intraepithelial neoplasias | ||
| LGIN: Low-grade intraepithelial neoplasias | ||
| GC | 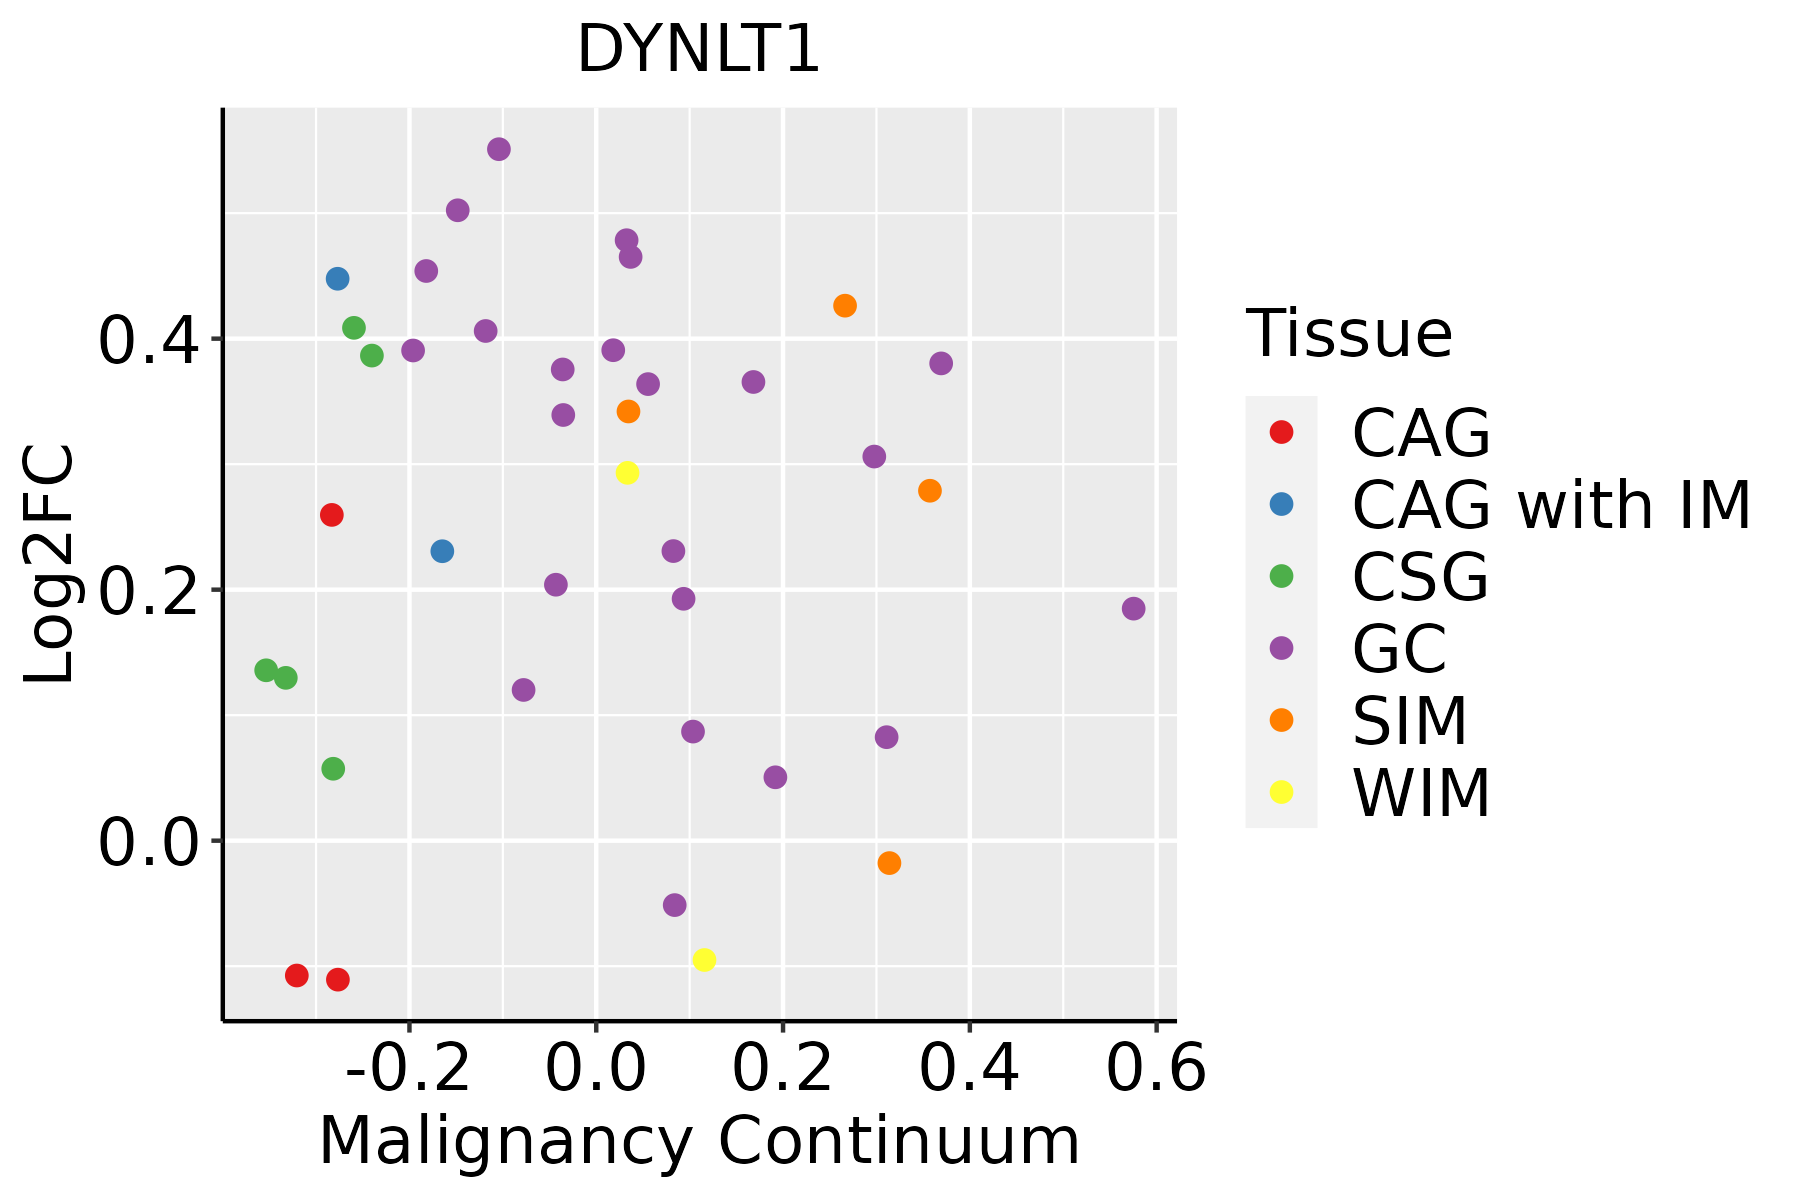 | CAG: Chronic atrophic gastritis |
| CAG with IM: Chronic atrophic gastritis with intestinal metaplasia | ||
| CSG: Chronic superficial gastritis | ||
| GC: Gastric cancer | ||
| SIM: Severe intestinal metaplasia | ||
| WIM: Wild intestinal metaplasia | ||
| Liver | 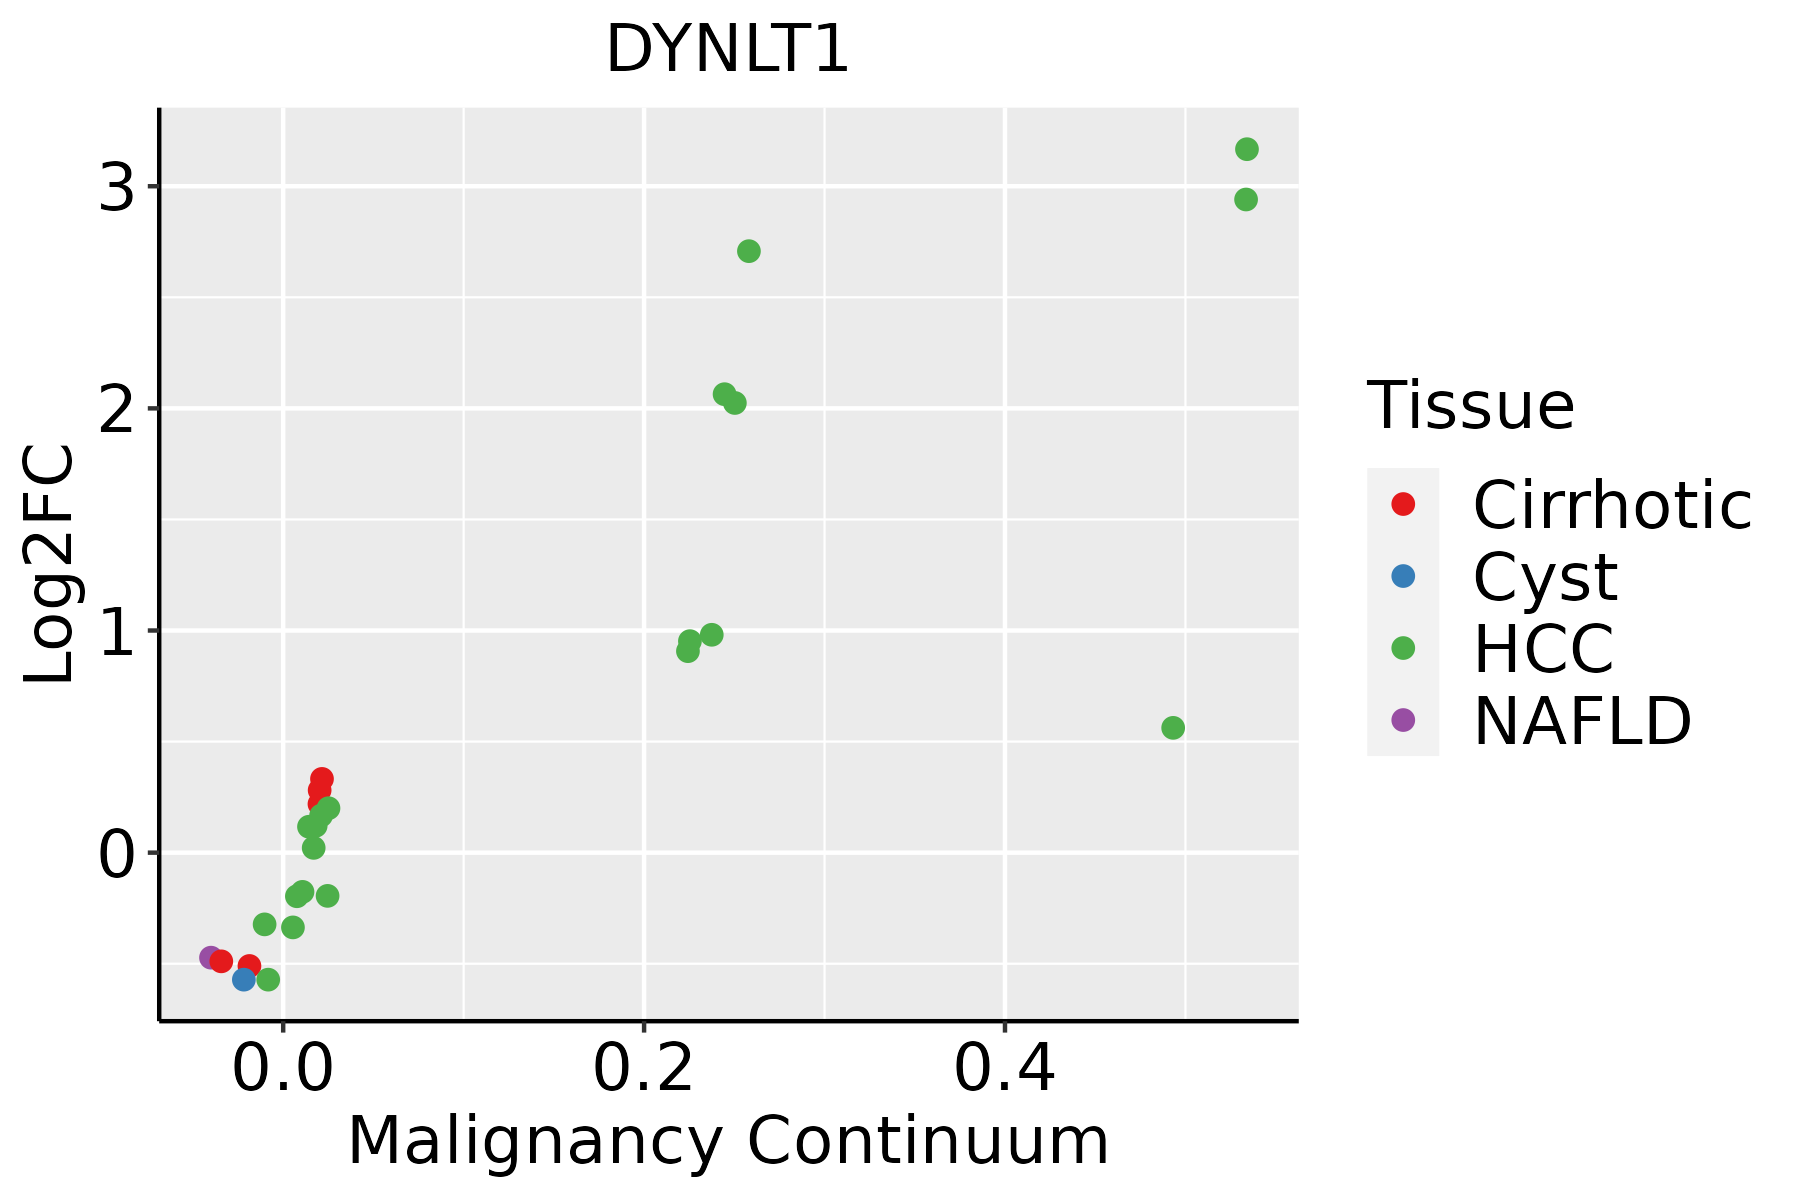 | HCC: Hepatocellular carcinoma |
| NAFLD: Non-alcoholic fatty liver disease | ||
| Oral Cavity | 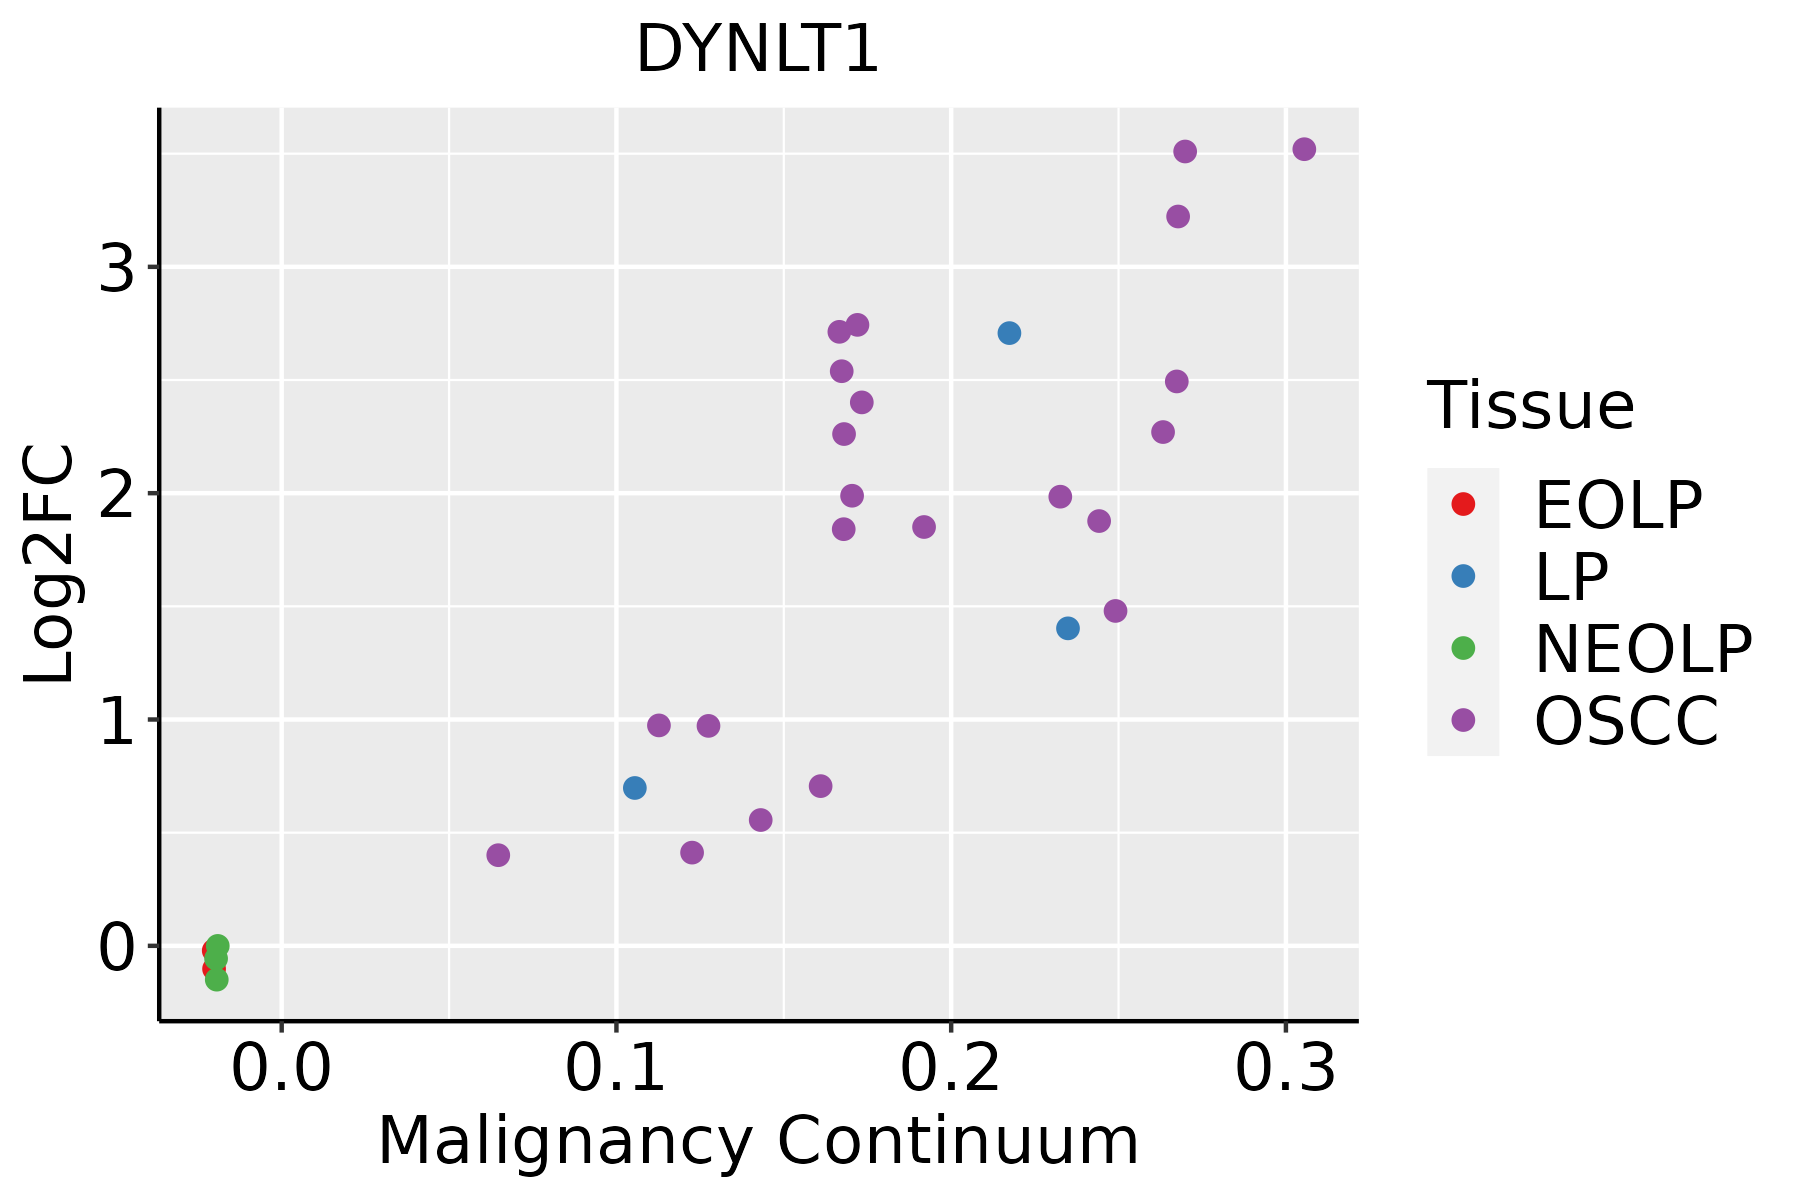 | EOLP: Erosive Oral lichen planus |
| LP: leukoplakia | ||
| NEOLP: Non-erosive oral lichen planus | ||
| OSCC: Oral squamous cell carcinoma | ||
| Prostate | 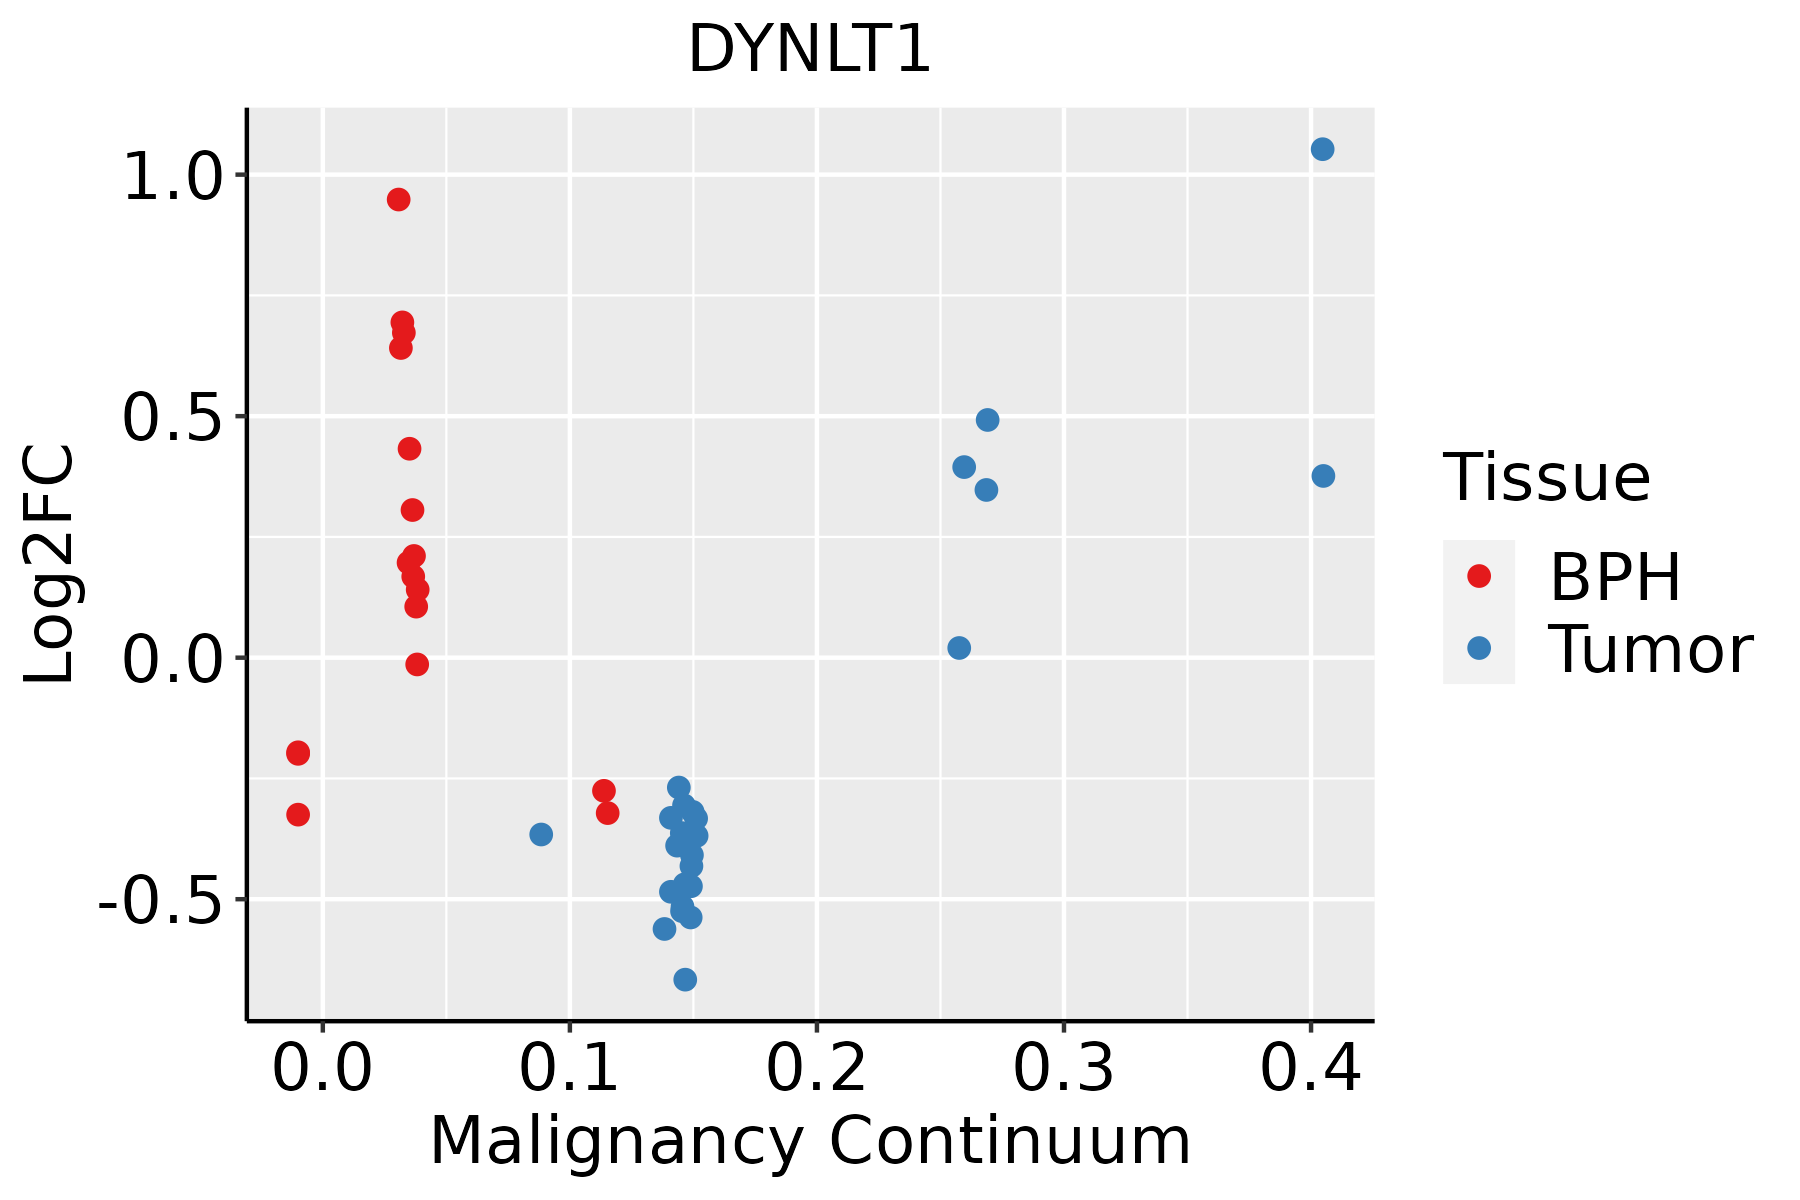 | BPH: Benign Prostatic Hyperplasia |
| Skin |  | AK: Actinic keratosis |
| cSCC: Cutaneous squamous cell carcinoma | ||
| SCCIS:squamous cell carcinoma in situ | ||
| Thyroid | 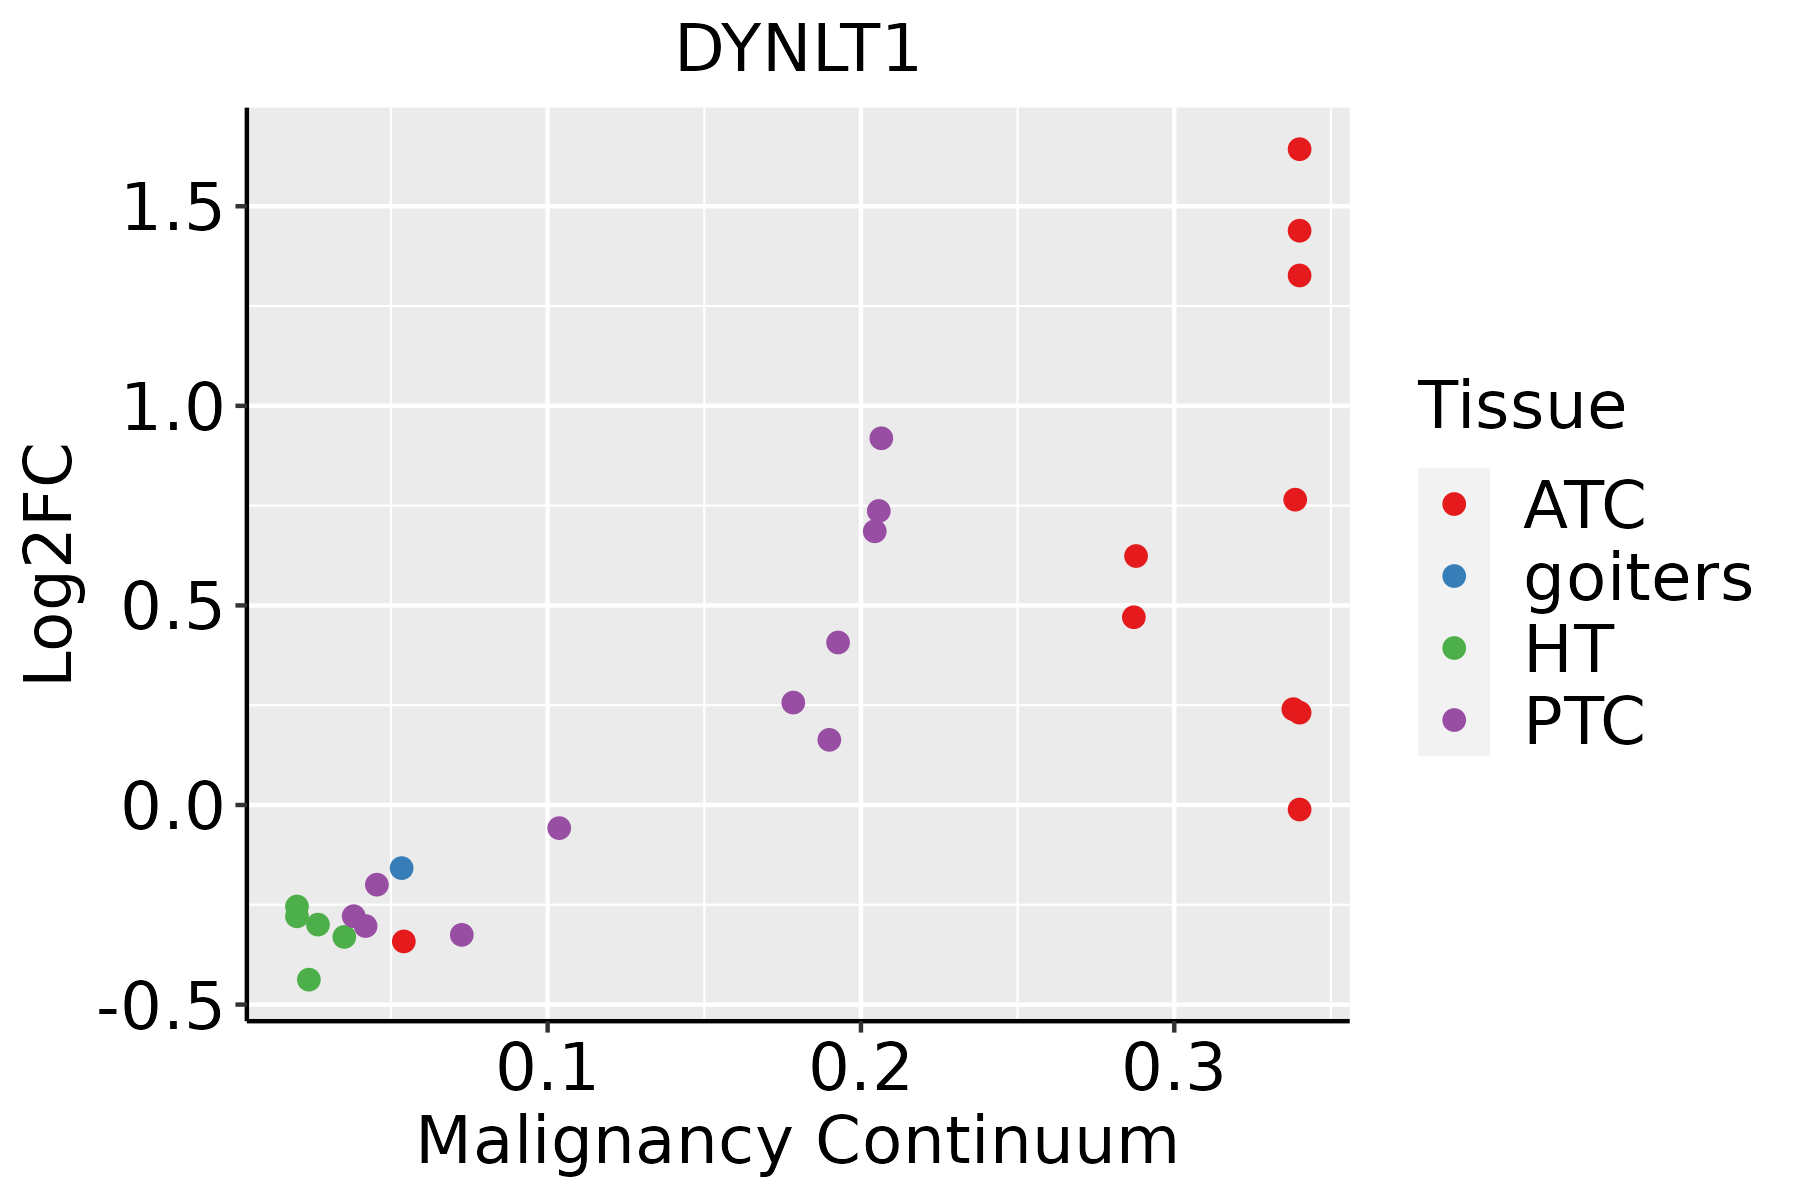 | ATC: Anaplastic thyroid cancer |
| HT: Hashimoto's thyroiditis | ||
| PTC: Papillary thyroid cancer |
| ∗log2FC in expression of this searched gene in stem-like cells from each diseased tissue sample relative to stem-like cells in normal samples in each tissue plotted against the malignancy continuum. Samples are colored based on if they are from different disease stage. |
Top |
Malignant transformation related pathway analysis |
| Find out the enriched GO biological processes and KEGG pathways involved in transition from healthy to precancer to cancer |
| Tissue | Disease Stage | Enriched GO biological Processes |
| Colorectum | AD |  |
| Colorectum | SER |  |
| Colorectum | MSS |  |
| Colorectum | MSI-H |  |
| Colorectum | FAP |  |
| ∗Top 15 enriched GO BP terms are showed in the bar plot of each disease state in each tissue. Each row represents a significant GO biological process which is colored according to the -log10(p.adjust). |
| Page: 1 2 3 4 5 6 7 8 9 |
| GO ID | Tissue | Disease Stage | Description | Gene Ratio | Bg Ratio | pvalue | p.adjust | Count |
| GO:00521262 | Colorectum | MSS | movement in host environment | 58/3467 | 175/18723 | 2.50e-06 | 7.64e-05 | 58 |
| GO:00070062 | Colorectum | MSS | mitochondrial membrane organization | 42/3467 | 116/18723 | 4.99e-06 | 1.38e-04 | 42 |
| GO:00507922 | Colorectum | MSS | regulation of viral process | 54/3467 | 164/18723 | 6.79e-06 | 1.77e-04 | 54 |
| GO:00300102 | Colorectum | MSS | establishment of cell polarity | 47/3467 | 143/18723 | 2.74e-05 | 5.58e-04 | 47 |
| GO:00467182 | Colorectum | MSS | viral entry into host cell | 47/3467 | 144/18723 | 3.35e-05 | 6.56e-04 | 47 |
| GO:00313462 | Colorectum | MSS | positive regulation of cell projection organization | 96/3467 | 353/18723 | 3.44e-05 | 6.70e-04 | 96 |
| GO:00109752 | Colorectum | MSS | regulation of neuron projection development | 115/3467 | 445/18723 | 6.91e-05 | 1.20e-03 | 115 |
| GO:00072651 | Colorectum | MSS | Ras protein signal transduction | 91/3467 | 337/18723 | 7.20e-05 | 1.21e-03 | 91 |
| GO:00444092 | Colorectum | MSS | entry into host | 47/3467 | 151/18723 | 1.24e-04 | 1.91e-03 | 47 |
| GO:00510561 | Colorectum | MSS | regulation of small GTPase mediated signal transduction | 82/3467 | 302/18723 | 1.31e-04 | 1.99e-03 | 82 |
| GO:00507671 | Colorectum | MSS | regulation of neurogenesis | 94/3467 | 364/18723 | 3.12e-04 | 4.06e-03 | 94 |
| GO:19028501 | Colorectum | MSS | microtubule cytoskeleton organization involved in mitosis | 44/3467 | 147/18723 | 5.17e-04 | 5.98e-03 | 44 |
| GO:00905592 | Colorectum | MSS | regulation of membrane permeability | 27/3467 | 78/18723 | 5.31e-04 | 5.99e-03 | 27 |
| GO:00615642 | Colorectum | MSS | axon development | 115/3467 | 467/18723 | 5.33e-04 | 6.00e-03 | 115 |
| GO:00166011 | Colorectum | MSS | Rac protein signal transduction | 17/3467 | 42/18723 | 7.63e-04 | 8.10e-03 | 17 |
| GO:00163582 | Colorectum | MSS | dendrite development | 65/3467 | 243/18723 | 9.41e-04 | 9.50e-03 | 65 |
| GO:00469022 | Colorectum | MSS | regulation of mitochondrial membrane permeability | 22/3467 | 63/18723 | 1.48e-03 | 1.36e-02 | 22 |
| GO:0050768 | Colorectum | MSS | negative regulation of neurogenesis | 39/3467 | 140/18723 | 4.30e-03 | 3.07e-02 | 39 |
| GO:0051961 | Colorectum | MSS | negative regulation of nervous system development | 40/3467 | 145/18723 | 4.66e-03 | 3.27e-02 | 40 |
| GO:0051960 | Colorectum | MSS | regulation of nervous system development | 103/3467 | 443/18723 | 6.68e-03 | 4.38e-02 | 103 |
| Page: 1 2 3 4 5 6 7 8 9 10 11 12 13 14 15 16 17 18 19 20 21 22 23 24 25 26 27 28 |
| Pathway ID | Tissue | Disease Stage | Description | Gene Ratio | Bg Ratio | pvalue | p.adjust | qvalue | Count |
| hsa0513218 | Breast | Precancer | Salmonella infection | 49/684 | 249/8465 | 2.92e-09 | 6.15e-08 | 4.71e-08 | 49 |
| hsa0513219 | Breast | Precancer | Salmonella infection | 49/684 | 249/8465 | 2.92e-09 | 6.15e-08 | 4.71e-08 | 49 |
| hsa0513224 | Breast | IDC | Salmonella infection | 55/867 | 249/8465 | 2.07e-08 | 4.49e-07 | 3.36e-07 | 55 |
| hsa0513234 | Breast | IDC | Salmonella infection | 55/867 | 249/8465 | 2.07e-08 | 4.49e-07 | 3.36e-07 | 55 |
| hsa0513243 | Breast | DCIS | Salmonella infection | 55/846 | 249/8465 | 8.71e-09 | 1.87e-07 | 1.38e-07 | 55 |
| hsa0513253 | Breast | DCIS | Salmonella infection | 55/846 | 249/8465 | 8.71e-09 | 1.87e-07 | 1.38e-07 | 55 |
| hsa0513220 | Cervix | CC | Salmonella infection | 74/1267 | 249/8465 | 1.33e-09 | 2.54e-08 | 1.50e-08 | 74 |
| hsa05132110 | Cervix | CC | Salmonella infection | 74/1267 | 249/8465 | 1.33e-09 | 2.54e-08 | 1.50e-08 | 74 |
| hsa05132 | Colorectum | AD | Salmonella infection | 102/2092 | 249/8465 | 7.65e-09 | 1.28e-07 | 8.17e-08 | 102 |
| hsa051321 | Colorectum | AD | Salmonella infection | 102/2092 | 249/8465 | 7.65e-09 | 1.28e-07 | 8.17e-08 | 102 |
| hsa051322 | Colorectum | SER | Salmonella infection | 77/1580 | 249/8465 | 1.56e-06 | 2.35e-05 | 1.71e-05 | 77 |
| hsa051323 | Colorectum | SER | Salmonella infection | 77/1580 | 249/8465 | 1.56e-06 | 2.35e-05 | 1.71e-05 | 77 |
| hsa051324 | Colorectum | MSS | Salmonella infection | 92/1875 | 249/8465 | 5.23e-08 | 9.74e-07 | 5.97e-07 | 92 |
| hsa051325 | Colorectum | MSS | Salmonella infection | 92/1875 | 249/8465 | 5.23e-08 | 9.74e-07 | 5.97e-07 | 92 |
| hsa051326 | Colorectum | MSI-H | Salmonella infection | 43/797 | 249/8465 | 5.91e-05 | 8.33e-04 | 6.98e-04 | 43 |
| hsa051327 | Colorectum | MSI-H | Salmonella infection | 43/797 | 249/8465 | 5.91e-05 | 8.33e-04 | 6.98e-04 | 43 |
| hsa0513226 | Endometrium | AEH | Salmonella infection | 71/1197 | 249/8465 | 1.69e-09 | 3.44e-08 | 2.52e-08 | 71 |
| hsa048144 | Endometrium | AEH | Motor proteins | 42/1197 | 193/8465 | 2.41e-03 | 1.42e-02 | 1.04e-02 | 42 |
| hsa05132112 | Endometrium | AEH | Salmonella infection | 71/1197 | 249/8465 | 1.69e-09 | 3.44e-08 | 2.52e-08 | 71 |
| hsa0481411 | Endometrium | AEH | Motor proteins | 42/1197 | 193/8465 | 2.41e-03 | 1.42e-02 | 1.04e-02 | 42 |
| Page: 1 2 3 |
Top |
Cell-cell communication analysis |
| Identification of potential cell-cell interactions between two cell types and their ligand-receptor pairs for different disease states |
| Ligand | Receptor | LRpair | Pathway | Tissue | Disease Stage |
| Page: 1 |
Top |
Single-cell gene regulatory network inference analysis |
| Find out the significant the regulons (TFs) and the target genes of each regulon across cell types for different disease states |
| TF | Cell Type | Tissue | Disease Stage | Target Gene | RSS | Regulon Activity |
| ∗The dot plots of a searched regulon are shown for all cell subpopulations in each disease state of each tissue based on the regulon specific score inferred using pySCENIC and by calculating the average expression. |
| Page: 1 |
Top |
Somatic mutation of malignant transformation related genes |
| Annotation of somatic variants for genes involved in malignant transformation |
| Hugo Symbol | Variant Class | Variant Classification | dbSNP RS | HGVSc | HGVSp | HGVSp Short | SWISSPROT | BIOTYPE | SIFT | PolyPhen | Tumor Sample Barcode | Tissue | Histology | Sex | Age | Stage | Therapy Types | Drugs | Outcome |
| DYNLT1 | SNV | Missense_Mutation | c.16N>A | p.Ala6Thr | p.A6T | P63172 | protein_coding | tolerated(0.64) | benign(0.001) | TCGA-D5-6540-01 | Colorectum | colon adenocarcinoma | Male | >=65 | I/II | Unknown | Unknown | SD | |
| DYNLT1 | SNV | Missense_Mutation | novel | c.65N>G | p.Lys22Arg | p.K22R | P63172 | protein_coding | tolerated(0.09) | benign(0.363) | TCGA-A5-A0G2-01 | Endometrium | uterine corpus endometrioid carcinoma | Female | <65 | III/IV | Unknown | Unknown | SD |
| DYNLT1 | SNV | Missense_Mutation | rs142843740 | c.82G>A | p.Ala28Thr | p.A28T | P63172 | protein_coding | tolerated(0.59) | benign(0.003) | TCGA-B5-A11E-01 | Endometrium | uterine corpus endometrioid carcinoma | Female | <65 | I/II | Unknown | Unknown | SD |
| DYNLT1 | SNV | Missense_Mutation | novel | c.338T>G | p.Ile113Ser | p.I113S | P63172 | protein_coding | deleterious(0) | probably_damaging(0.925) | TCGA-B5-A3FA-01 | Endometrium | uterine corpus endometrioid carcinoma | Female | >=65 | I/II | Unknown | Unknown | SD |
| DYNLT1 | SNV | Missense_Mutation | rs151068285 | c.13C>G | p.Gln5Glu | p.Q5E | P63172 | protein_coding | tolerated(0.47) | benign(0) | TCGA-35-3615-01 | Lung | lung adenocarcinoma | Male | <65 | I/II | Unknown | Unknown | SD |
| DYNLT1 | SNV | Missense_Mutation | c.284N>G | p.Val95Gly | p.V95G | P63172 | protein_coding | deleterious(0) | possibly_damaging(0.777) | TCGA-HC-A4ZV-01 | Prostate | prostate adenocarcinoma | Male | <65 | 9 | Unknown | Unknown | SD |
| Page: 1 |
Top |
Related drugs of malignant transformation related genes |
| Identification of chemicals and drugs interact with genes involved in malignant transfromation |
| (DGIdb 4.0) |
| Entrez ID | Symbol | Category | Interaction Types | Drug Claim Name | Drug Name | PMIDs |
| Page: 1 |

Copyright 2023-Present -The University of Texas Health Science Center at Houston |