
|
|||||
|
 | |
| |
| |
| |
| |
| |
|
Gene: DKK3 |
Gene summary for DKK3 |
| Gene information | Species | Human | Gene symbol | DKK3 | Gene ID | 27122 |
| Gene name | dickkopf WNT signaling pathway inhibitor 3 | |
| Gene Alias | REIC | |
| Cytomap | 11p15.3 | |
| Gene Type | protein-coding | GO ID | GO:0006066 | UniProtAcc | Q9UBP4 |
Top |
Malignant transformation analysis |
| Identification of the aberrant gene expression in precancerous and cancerous lesions by comparing the gene expression of stem-like cells in diseased tissues with normal stem cells |
| Entrez ID | Symbol | Replicates | Species | Organ | Tissue | Adj P-value | Log2FC | Malignancy |
| 27122 | DKK3 | LZE4T | Human | Esophagus | ESCC | 8.94e-07 | 1.83e-01 | 0.0811 |
| 27122 | DKK3 | LZE8T | Human | Esophagus | ESCC | 1.99e-05 | -2.66e-01 | 0.067 |
| 27122 | DKK3 | LZE24T | Human | Esophagus | ESCC | 9.31e-07 | -1.14e-01 | 0.0596 |
| 27122 | DKK3 | LZE6T | Human | Esophagus | ESCC | 8.31e-04 | -2.51e-01 | 0.0845 |
| 27122 | DKK3 | P2T-E | Human | Esophagus | ESCC | 2.30e-50 | 1.21e+00 | 0.1177 |
| 27122 | DKK3 | P4T-E | Human | Esophagus | ESCC | 3.69e-15 | 5.47e-01 | 0.1323 |
| 27122 | DKK3 | P8T-E | Human | Esophagus | ESCC | 5.45e-08 | 4.31e-01 | 0.0889 |
| 27122 | DKK3 | P9T-E | Human | Esophagus | ESCC | 1.03e-05 | 5.31e-01 | 0.1131 |
| 27122 | DKK3 | P10T-E | Human | Esophagus | ESCC | 5.50e-58 | 1.45e+00 | 0.116 |
| 27122 | DKK3 | P11T-E | Human | Esophagus | ESCC | 4.17e-35 | 2.18e+00 | 0.1426 |
| 27122 | DKK3 | P12T-E | Human | Esophagus | ESCC | 2.62e-21 | 6.75e-01 | 0.1122 |
| 27122 | DKK3 | P15T-E | Human | Esophagus | ESCC | 2.36e-14 | 8.77e-01 | 0.1149 |
| 27122 | DKK3 | P16T-E | Human | Esophagus | ESCC | 9.93e-44 | 1.27e+00 | 0.1153 |
| 27122 | DKK3 | P17T-E | Human | Esophagus | ESCC | 5.39e-07 | 1.04e+00 | 0.1278 |
| 27122 | DKK3 | P20T-E | Human | Esophagus | ESCC | 1.12e-16 | 8.41e-01 | 0.1124 |
| 27122 | DKK3 | P21T-E | Human | Esophagus | ESCC | 3.67e-62 | 1.61e+00 | 0.1617 |
| 27122 | DKK3 | P22T-E | Human | Esophagus | ESCC | 1.20e-54 | 1.21e+00 | 0.1236 |
| 27122 | DKK3 | P24T-E | Human | Esophagus | ESCC | 1.05e-17 | 7.66e-01 | 0.1287 |
| 27122 | DKK3 | P26T-E | Human | Esophagus | ESCC | 2.40e-93 | 1.92e+00 | 0.1276 |
| 27122 | DKK3 | P27T-E | Human | Esophagus | ESCC | 2.48e-41 | 1.16e+00 | 0.1055 |
| Page: 1 2 3 4 5 6 |
| Tissue | Expression Dynamics | Abbreviation |
| Esophagus |  | ESCC: Esophageal squamous cell carcinoma |
| HGIN: High-grade intraepithelial neoplasias | ||
| LGIN: Low-grade intraepithelial neoplasias | ||
| Liver | 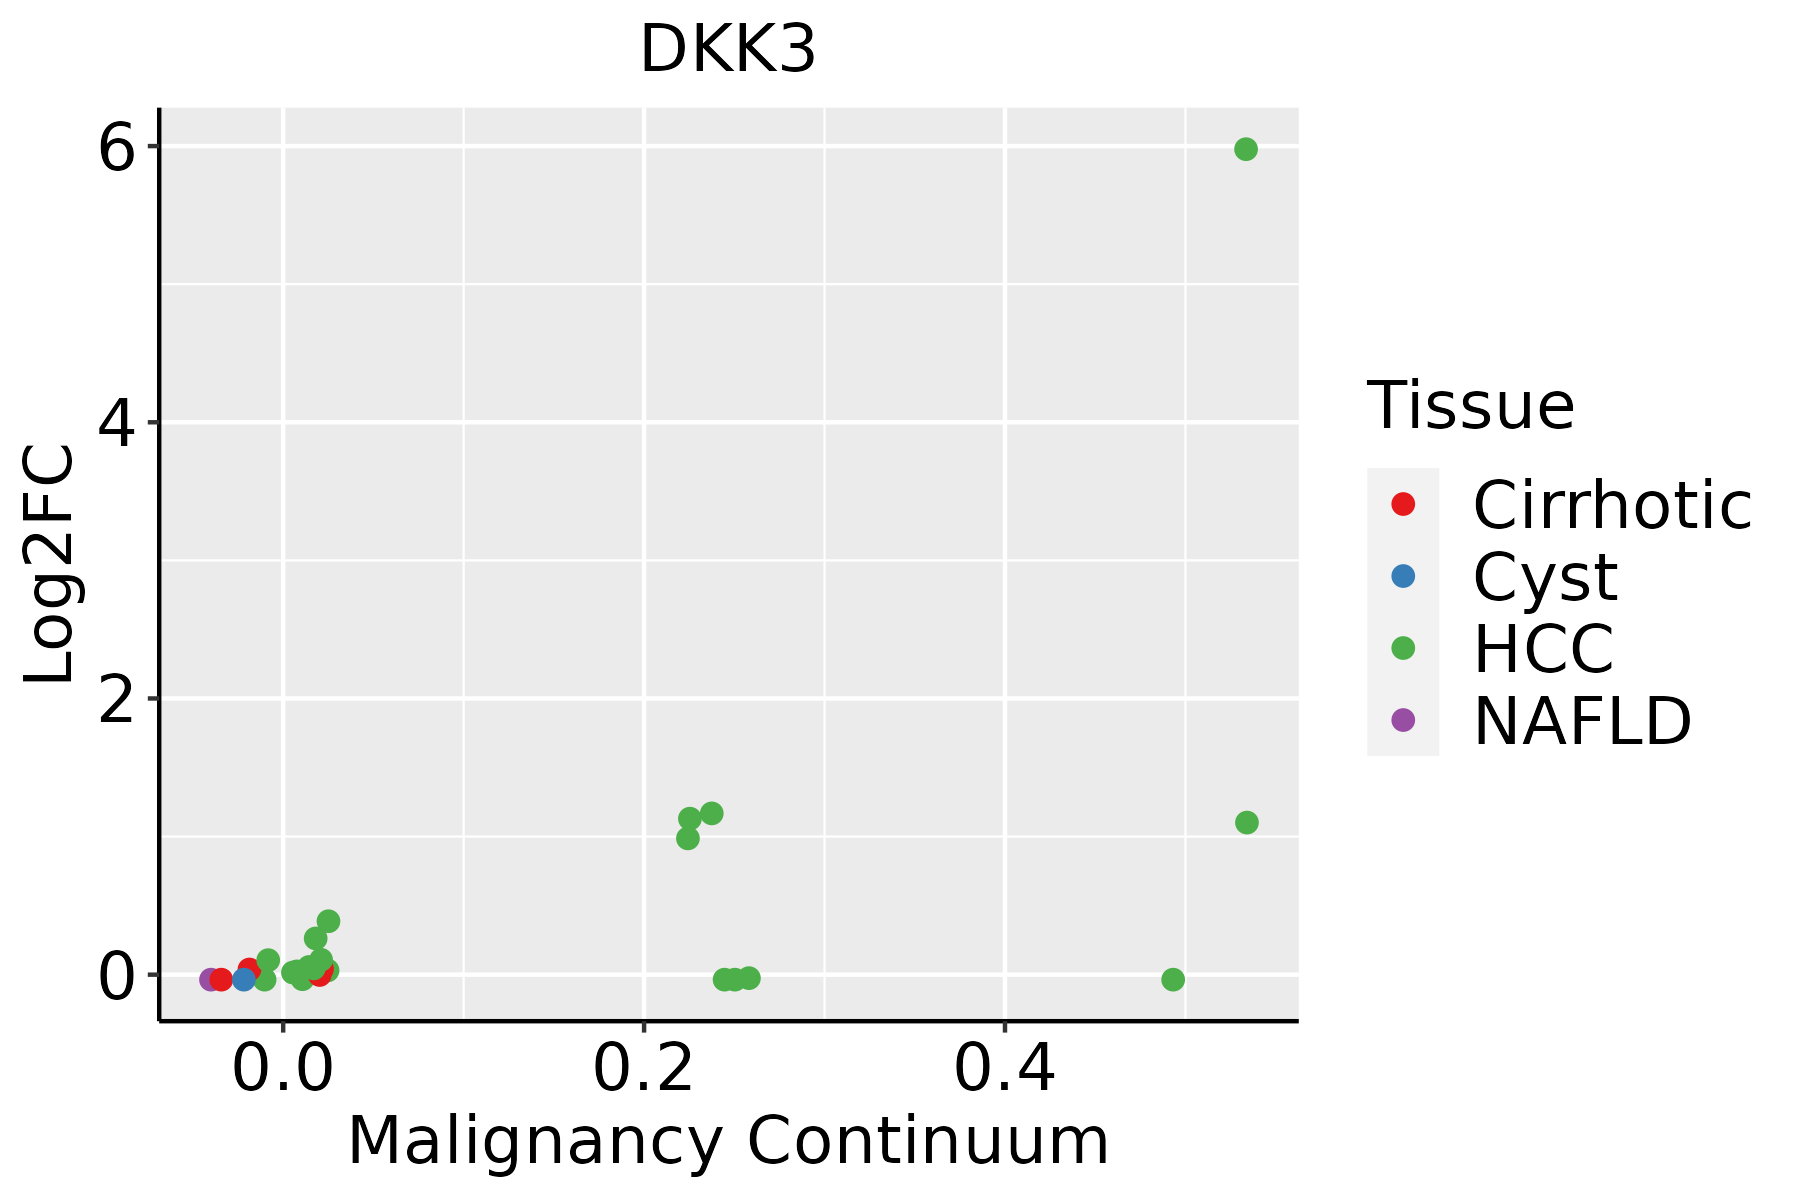 | HCC: Hepatocellular carcinoma |
| NAFLD: Non-alcoholic fatty liver disease | ||
| Oral Cavity |  | EOLP: Erosive Oral lichen planus |
| LP: leukoplakia | ||
| NEOLP: Non-erosive oral lichen planus | ||
| OSCC: Oral squamous cell carcinoma | ||
| Prostate | 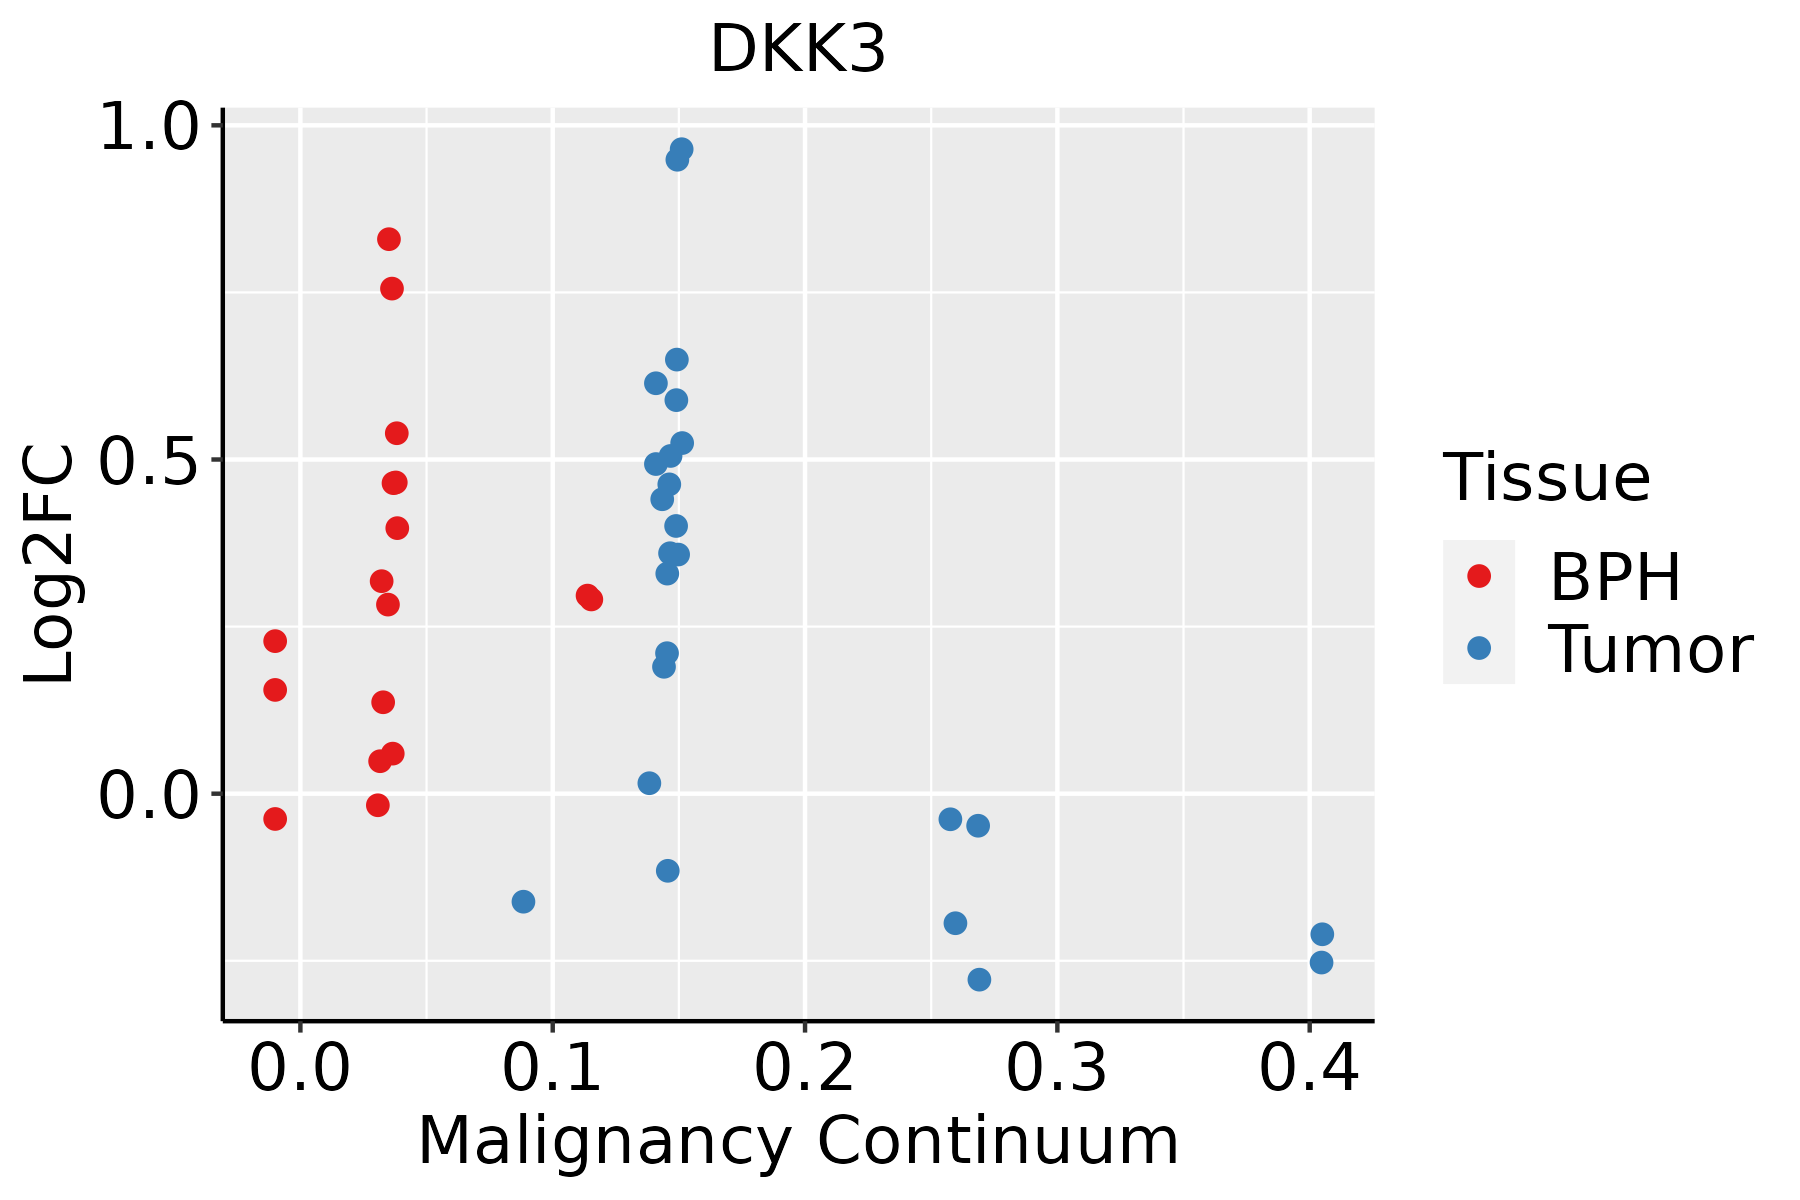 | BPH: Benign Prostatic Hyperplasia |
| Skin | 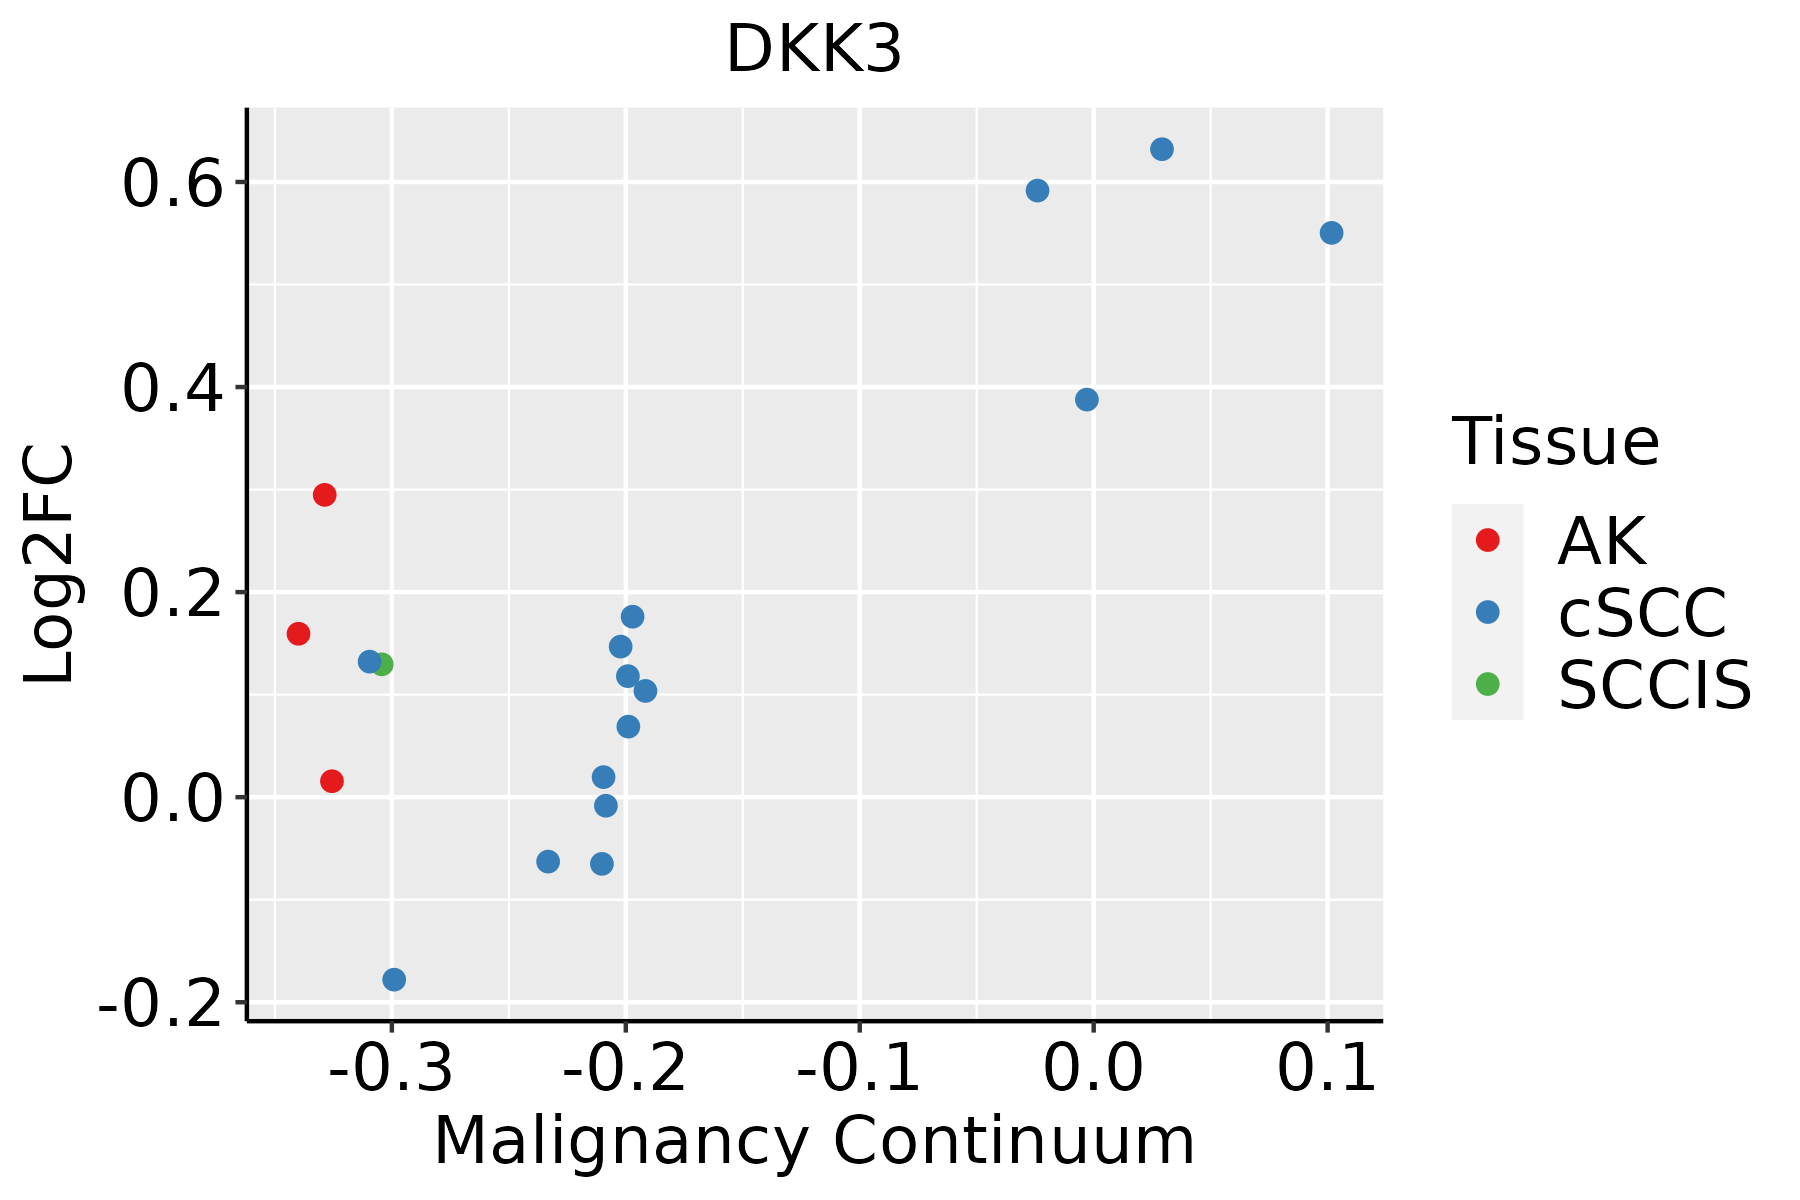 | AK: Actinic keratosis |
| cSCC: Cutaneous squamous cell carcinoma | ||
| SCCIS:squamous cell carcinoma in situ | ||
| Thyroid |  | ATC: Anaplastic thyroid cancer |
| HT: Hashimoto's thyroiditis | ||
| PTC: Papillary thyroid cancer |
| ∗log2FC in expression of this searched gene in stem-like cells from each diseased tissue sample relative to stem-like cells in normal samples in each tissue plotted against the malignancy continuum. Samples are colored based on if they are from different disease stage. |
Top |
Malignant transformation related pathway analysis |
| Find out the enriched GO biological processes and KEGG pathways involved in transition from healthy to precancer to cancer |
| Tissue | Disease Stage | Enriched GO biological Processes |
| Colorectum | AD |  |
| Colorectum | SER |  |
| Colorectum | MSS |  |
| Colorectum | MSI-H |  |
| Colorectum | FAP |  |
| ∗Top 15 enriched GO BP terms are showed in the bar plot of each disease state in each tissue. Each row represents a significant GO biological process which is colored according to the -log10(p.adjust). |
| Page: 1 2 3 4 5 6 7 8 9 |
| GO ID | Tissue | Disease Stage | Description | Gene Ratio | Bg Ratio | pvalue | p.adjust | Count |
| GO:00192166 | Prostate | Tumor | regulation of lipid metabolic process | 76/3246 | 331/18723 | 5.04e-03 | 2.45e-02 | 76 |
| GO:0046885 | Prostate | Tumor | regulation of hormone biosynthetic process | 9/3246 | 21/18723 | 5.54e-03 | 2.61e-02 | 9 |
| GO:00468905 | Prostate | Tumor | regulation of lipid biosynthetic process | 42/3246 | 171/18723 | 1.02e-02 | 4.28e-02 | 42 |
| GO:00303251 | Prostate | Tumor | adrenal gland development | 9/3246 | 23/18723 | 1.11e-02 | 4.56e-02 | 9 |
| GO:001605518 | Skin | AK | Wnt signaling pathway | 98/1910 | 444/18723 | 9.39e-14 | 3.09e-11 | 98 |
| GO:019873818 | Skin | AK | cell-cell signaling by wnt | 98/1910 | 446/18723 | 1.26e-13 | 3.72e-11 | 98 |
| GO:004873226 | Skin | AK | gland development | 93/1910 | 436/18723 | 3.24e-12 | 7.10e-10 | 93 |
| GO:003011118 | Skin | AK | regulation of Wnt signaling pathway | 73/1910 | 328/18723 | 9.27e-11 | 1.52e-08 | 73 |
| GO:006007017 | Skin | AK | canonical Wnt signaling pathway | 67/1910 | 303/18723 | 7.30e-10 | 7.45e-08 | 67 |
| GO:006082818 | Skin | AK | regulation of canonical Wnt signaling pathway | 57/1910 | 253/18723 | 6.57e-09 | 4.47e-07 | 57 |
| GO:007155910 | Skin | AK | response to transforming growth factor beta | 52/1910 | 256/18723 | 9.55e-07 | 3.09e-05 | 52 |
| GO:007156010 | Skin | AK | cellular response to transforming growth factor beta stimulus | 50/1910 | 250/18723 | 2.45e-06 | 6.76e-05 | 50 |
| GO:00902873 | Skin | AK | regulation of cellular response to growth factor stimulus | 53/1910 | 304/18723 | 7.10e-05 | 1.02e-03 | 53 |
| GO:00900906 | Skin | AK | negative regulation of canonical Wnt signaling pathway | 29/1910 | 137/18723 | 1.07e-04 | 1.39e-03 | 29 |
| GO:00301789 | Skin | AK | negative regulation of Wnt signaling pathway | 33/1910 | 170/18723 | 2.14e-04 | 2.39e-03 | 33 |
| GO:000717817 | Skin | AK | transmembrane receptor protein serine/threonine kinase signaling pathway | 57/1910 | 355/18723 | 3.69e-04 | 3.61e-03 | 57 |
| GO:000717910 | Skin | AK | transforming growth factor beta receptor signaling pathway | 35/1910 | 198/18723 | 8.69e-04 | 7.17e-03 | 35 |
| GO:00303254 | Skin | AK | adrenal gland development | 8/1910 | 23/18723 | 1.39e-03 | 1.03e-02 | 8 |
| GO:0010894 | Skin | AK | negative regulation of steroid biosynthetic process | 8/1910 | 27/18723 | 4.35e-03 | 2.52e-02 | 8 |
| GO:00170157 | Skin | AK | regulation of transforming growth factor beta receptor signaling pathway | 23/1910 | 128/18723 | 5.03e-03 | 2.83e-02 | 23 |
| Page: 1 2 3 4 5 6 7 8 9 |
| Pathway ID | Tissue | Disease Stage | Description | Gene Ratio | Bg Ratio | pvalue | p.adjust | qvalue | Count |
| Page: 1 |
Top |
Cell-cell communication analysis |
| Identification of potential cell-cell interactions between two cell types and their ligand-receptor pairs for different disease states |
| Ligand | Receptor | LRpair | Pathway | Tissue | Disease Stage |
| Page: 1 |
Top |
Single-cell gene regulatory network inference analysis |
| Find out the significant the regulons (TFs) and the target genes of each regulon across cell types for different disease states |
| TF | Cell Type | Tissue | Disease Stage | Target Gene | RSS | Regulon Activity |
| ∗The dot plots of a searched regulon are shown for all cell subpopulations in each disease state of each tissue based on the regulon specific score inferred using pySCENIC and by calculating the average expression. |
| Page: 1 |
Top |
Somatic mutation of malignant transformation related genes |
| Annotation of somatic variants for genes involved in malignant transformation |
| Hugo Symbol | Variant Class | Variant Classification | dbSNP RS | HGVSc | HGVSp | HGVSp Short | SWISSPROT | BIOTYPE | SIFT | PolyPhen | Tumor Sample Barcode | Tissue | Histology | Sex | Age | Stage | Therapy Types | Drugs | Outcome |
| DKK3 | SNV | Missense_Mutation | c.566N>A | p.Leu189Gln | p.L189Q | protein_coding | deleterious(0) | probably_damaging(0.999) | TCGA-A8-A09Z-01 | Breast | breast invasive carcinoma | Female | >=65 | I/II | Unknown | Unknown | SD | ||
| DKK3 | SNV | Missense_Mutation | novel | c.695C>A | p.Thr232Lys | p.T232K | protein_coding | deleterious(0.02) | possibly_damaging(0.763) | TCGA-B6-A400-01 | Breast | breast invasive carcinoma | Female | <65 | III/IV | Unknown | Unknown | SD | |
| DKK3 | SNV | Missense_Mutation | c.278G>A | p.Ser93Asn | p.S93N | protein_coding | tolerated(1) | benign(0.001) | TCGA-E2-A14R-01 | Breast | breast invasive carcinoma | Female | <65 | I/II | Chemotherapy | doxorubicin | PD | ||
| DKK3 | SNV | Missense_Mutation | rs373767107 | c.907N>A | p.Val303Met | p.V303M | protein_coding | tolerated_low_confidence(0.15) | benign(0.01) | TCGA-OL-A97C-01 | Breast | breast invasive carcinoma | Female | >=65 | I/II | Unknown | Unknown | PD | |
| DKK3 | SNV | Missense_Mutation | novel | c.440N>A | p.Cys147Tyr | p.C147Y | protein_coding | deleterious(0) | probably_damaging(0.998) | TCGA-2W-A8YY-01 | Cervix | cervical & endocervical cancer | Female | <65 | I/II | Chemotherapy | cisplatin | CR | |
| DKK3 | SNV | Missense_Mutation | novel | c.221N>G | p.Ala74Gly | p.A74G | protein_coding | tolerated(0.05) | probably_damaging(0.996) | TCGA-JW-A5VL-01 | Cervix | cervical & endocervical cancer | Female | <65 | I/II | Unknown | Unknown | SD | |
| DKK3 | SNV | Missense_Mutation | c.182C>T | p.Thr61Met | p.T61M | protein_coding | deleterious(0) | probably_damaging(0.999) | TCGA-A6-5661-01 | Colorectum | colon adenocarcinoma | Female | >=65 | I/II | Unknown | Unknown | SD | ||
| DKK3 | SNV | Missense_Mutation | rs377759604 | c.514C>T | p.Arg172Trp | p.R172W | protein_coding | deleterious(0.02) | probably_damaging(0.971) | TCGA-AA-3949-01 | Colorectum | colon adenocarcinoma | Female | >=65 | III/IV | Unknown | Unknown | SD | |
| DKK3 | SNV | Missense_Mutation | c.439N>C | p.Cys147Arg | p.C147R | protein_coding | deleterious(0) | probably_damaging(0.998) | TCGA-AY-6197-01 | Colorectum | colon adenocarcinoma | Male | <65 | I/II | Unknown | Unknown | SD | ||
| DKK3 | SNV | Missense_Mutation | rs756280059 | c.995N>A | p.Arg332His | p.R332H | protein_coding | deleterious_low_confidence(0) | probably_damaging(0.973) | TCGA-CM-6171-01 | Colorectum | colon adenocarcinoma | Female | >=65 | I/II | Unknown | Unknown | SD |
| Page: 1 2 3 4 |
Top |
Related drugs of malignant transformation related genes |
| Identification of chemicals and drugs interact with genes involved in malignant transfromation |
| (DGIdb 4.0) |
| Entrez ID | Symbol | Category | Interaction Types | Drug Claim Name | Drug Name | PMIDs |
| 27122 | DKK3 | DRUGGABLE GENOME | REIC gene therapy |
| Page: 1 |

Copyright 2023-Present -The University of Texas Health Science Center at Houston |