
|
|||||
|
 | |
| |
| |
| |
| |
| |
|
Gene: CYP7B1 |
Gene summary for CYP7B1 |
| Gene information | Species | Human | Gene symbol | CYP7B1 | Gene ID | 9420 |
| Gene name | cytochrome P450 family 7 subfamily B member 1 | |
| Gene Alias | CBAS3 | |
| Cytomap | 8q12.3 | |
| Gene Type | protein-coding | GO ID | GO:0000003 | UniProtAcc | Q05C57 |
Top |
Malignant transformation analysis |
| Identification of the aberrant gene expression in precancerous and cancerous lesions by comparing the gene expression of stem-like cells in diseased tissues with normal stem cells |
| Entrez ID | Symbol | Replicates | Species | Organ | Tissue | Adj P-value | Log2FC | Malignancy |
| 9420 | CYP7B1 | NAFLD1 | Human | Liver | NAFLD | 7.74e-06 | 7.32e-01 | -0.04 |
| 9420 | CYP7B1 | S41 | Human | Liver | Cirrhotic | 6.52e-07 | 5.96e-01 | -0.0343 |
| 9420 | CYP7B1 | S43 | Human | Liver | Cirrhotic | 2.61e-02 | 2.11e-01 | -0.0187 |
| 9420 | CYP7B1 | HCC1_Meng | Human | Liver | HCC | 8.28e-51 | 4.79e-03 | 0.0246 |
| 9420 | CYP7B1 | HCC2_Meng | Human | Liver | HCC | 1.51e-07 | -9.87e-02 | 0.0107 |
| 9420 | CYP7B1 | cirrhotic1 | Human | Liver | Cirrhotic | 3.36e-02 | -1.13e-01 | 0.0202 |
| 9420 | CYP7B1 | Pt13.b | Human | Liver | HCC | 1.52e-02 | -1.67e-02 | 0.0251 |
| 9420 | CYP7B1 | S016 | Human | Liver | HCC | 9.85e-08 | 2.91e-01 | 0.2243 |
| 9420 | CYP7B1 | S028 | Human | Liver | HCC | 5.93e-05 | 2.57e-01 | 0.2503 |
| 9420 | CYP7B1 | S029 | Human | Liver | HCC | 3.15e-04 | 2.55e-01 | 0.2581 |
| 9420 | CYP7B1 | RNA-P25T1-P25T1-1 | Human | Lung | AIS | 1.67e-11 | 5.31e-01 | -0.2116 |
| 9420 | CYP7B1 | RNA-P25T1-P25T1-3 | Human | Lung | AIS | 9.09e-03 | 4.46e-01 | -0.2107 |
| 9420 | CYP7B1 | RNA-P25T1-P25T1-4 | Human | Lung | AIS | 2.81e-06 | 4.57e-01 | -0.2119 |
| 9420 | CYP7B1 | RNA-P3T-P3T-1 | Human | Lung | IAC | 1.44e-06 | 4.94e-01 | 0.1829 |
| 9420 | CYP7B1 | RNA-P3T-P3T-2 | Human | Lung | IAC | 2.34e-05 | 4.93e-01 | 0.1835 |
| 9420 | CYP7B1 | RNA-P3T-P3T-4 | Human | Lung | IAC | 3.36e-05 | 4.67e-01 | 0.1859 |
| 9420 | CYP7B1 | RNA-P6T2-P6T2-1 | Human | Lung | IAC | 4.20e-04 | 2.36e-01 | -0.0166 |
| 9420 | CYP7B1 | RNA-P6T2-P6T2-2 | Human | Lung | IAC | 1.53e-07 | 3.04e-01 | -0.0132 |
| 9420 | CYP7B1 | RNA-P6T2-P6T2-3 | Human | Lung | IAC | 1.43e-02 | 1.73e-01 | -0.013 |
| 9420 | CYP7B1 | RNA-P6T2-P6T2-4 | Human | Lung | IAC | 1.62e-06 | 3.04e-01 | -0.0121 |
| Page: 1 2 |
| Tissue | Expression Dynamics | Abbreviation |
| Liver |  | HCC: Hepatocellular carcinoma |
| NAFLD: Non-alcoholic fatty liver disease | ||
| Lung | 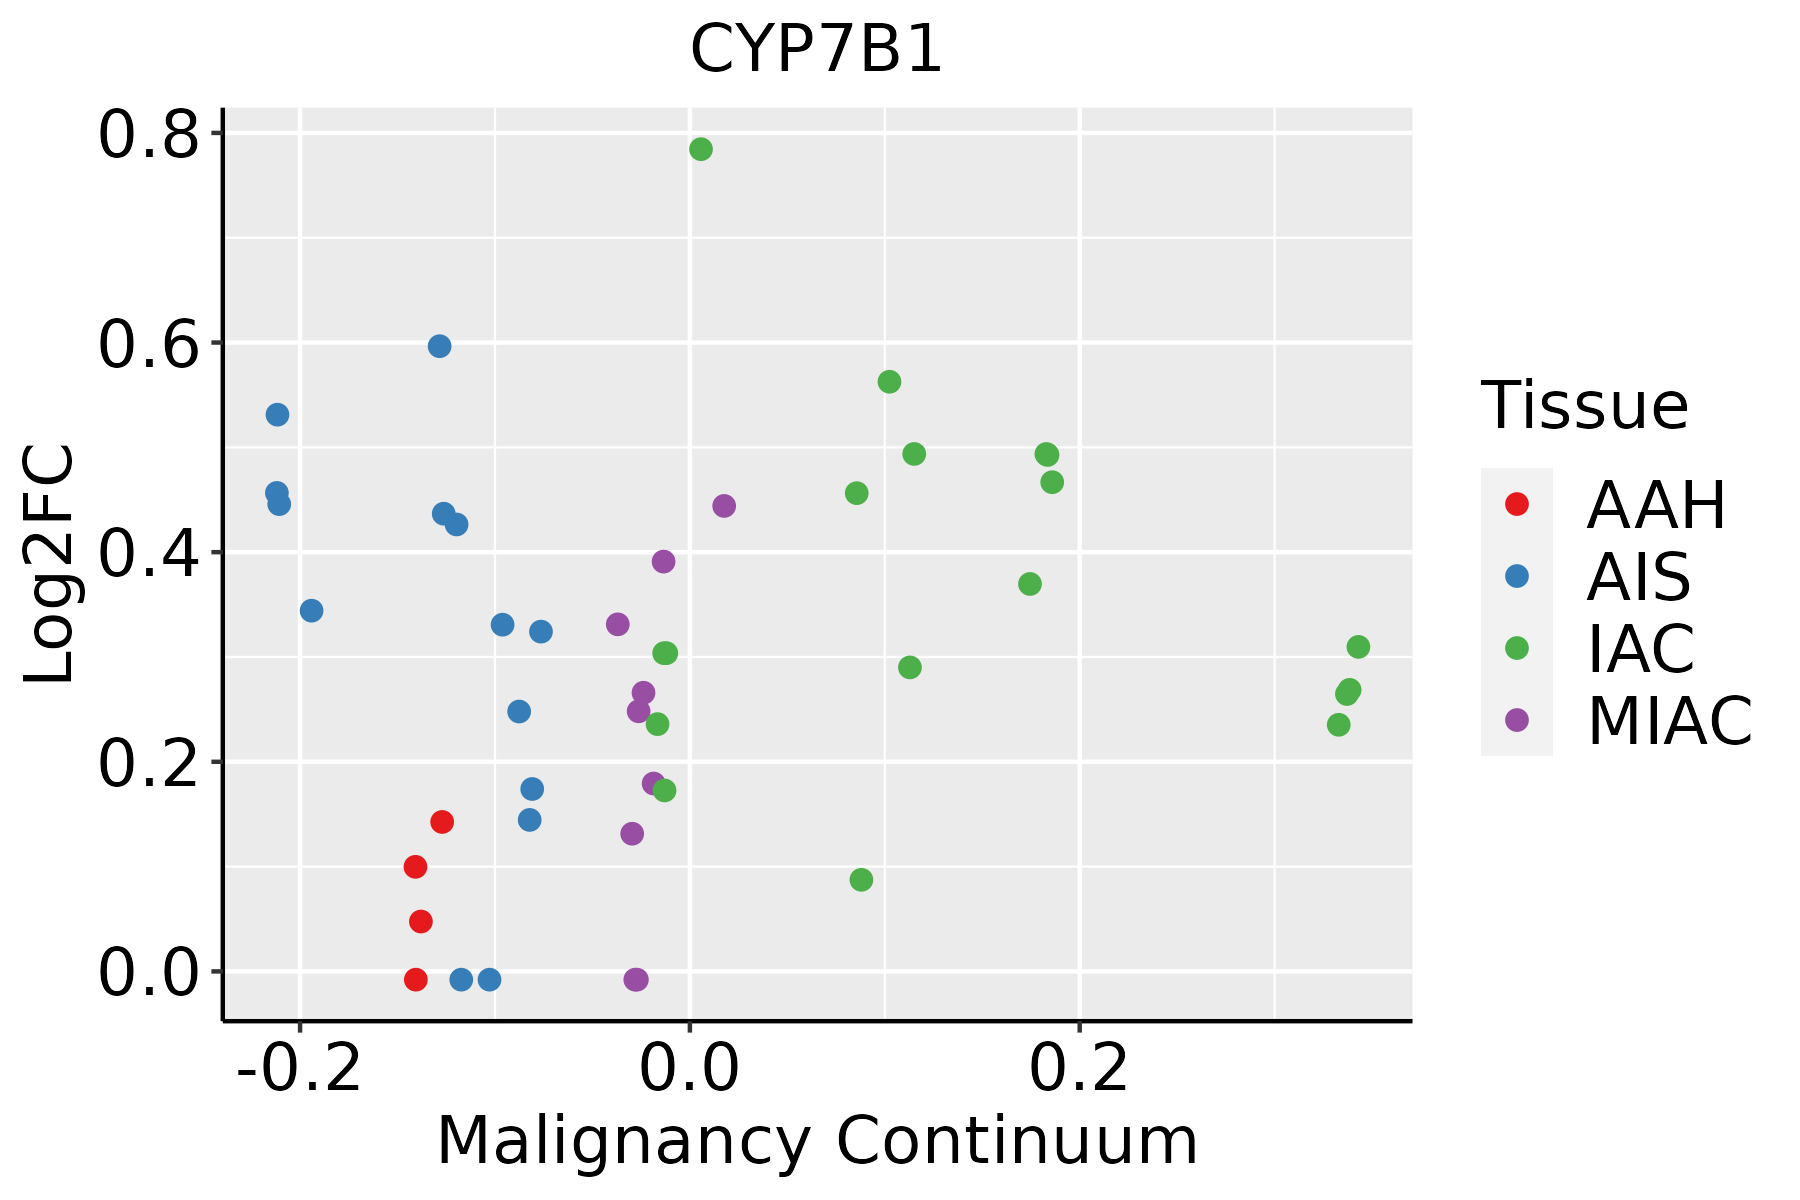 | AAH: Atypical adenomatous hyperplasia |
| AIS: Adenocarcinoma in situ | ||
| IAC: Invasive lung adenocarcinoma | ||
| MIA: Minimally invasive adenocarcinoma | ||
| Oral Cavity | 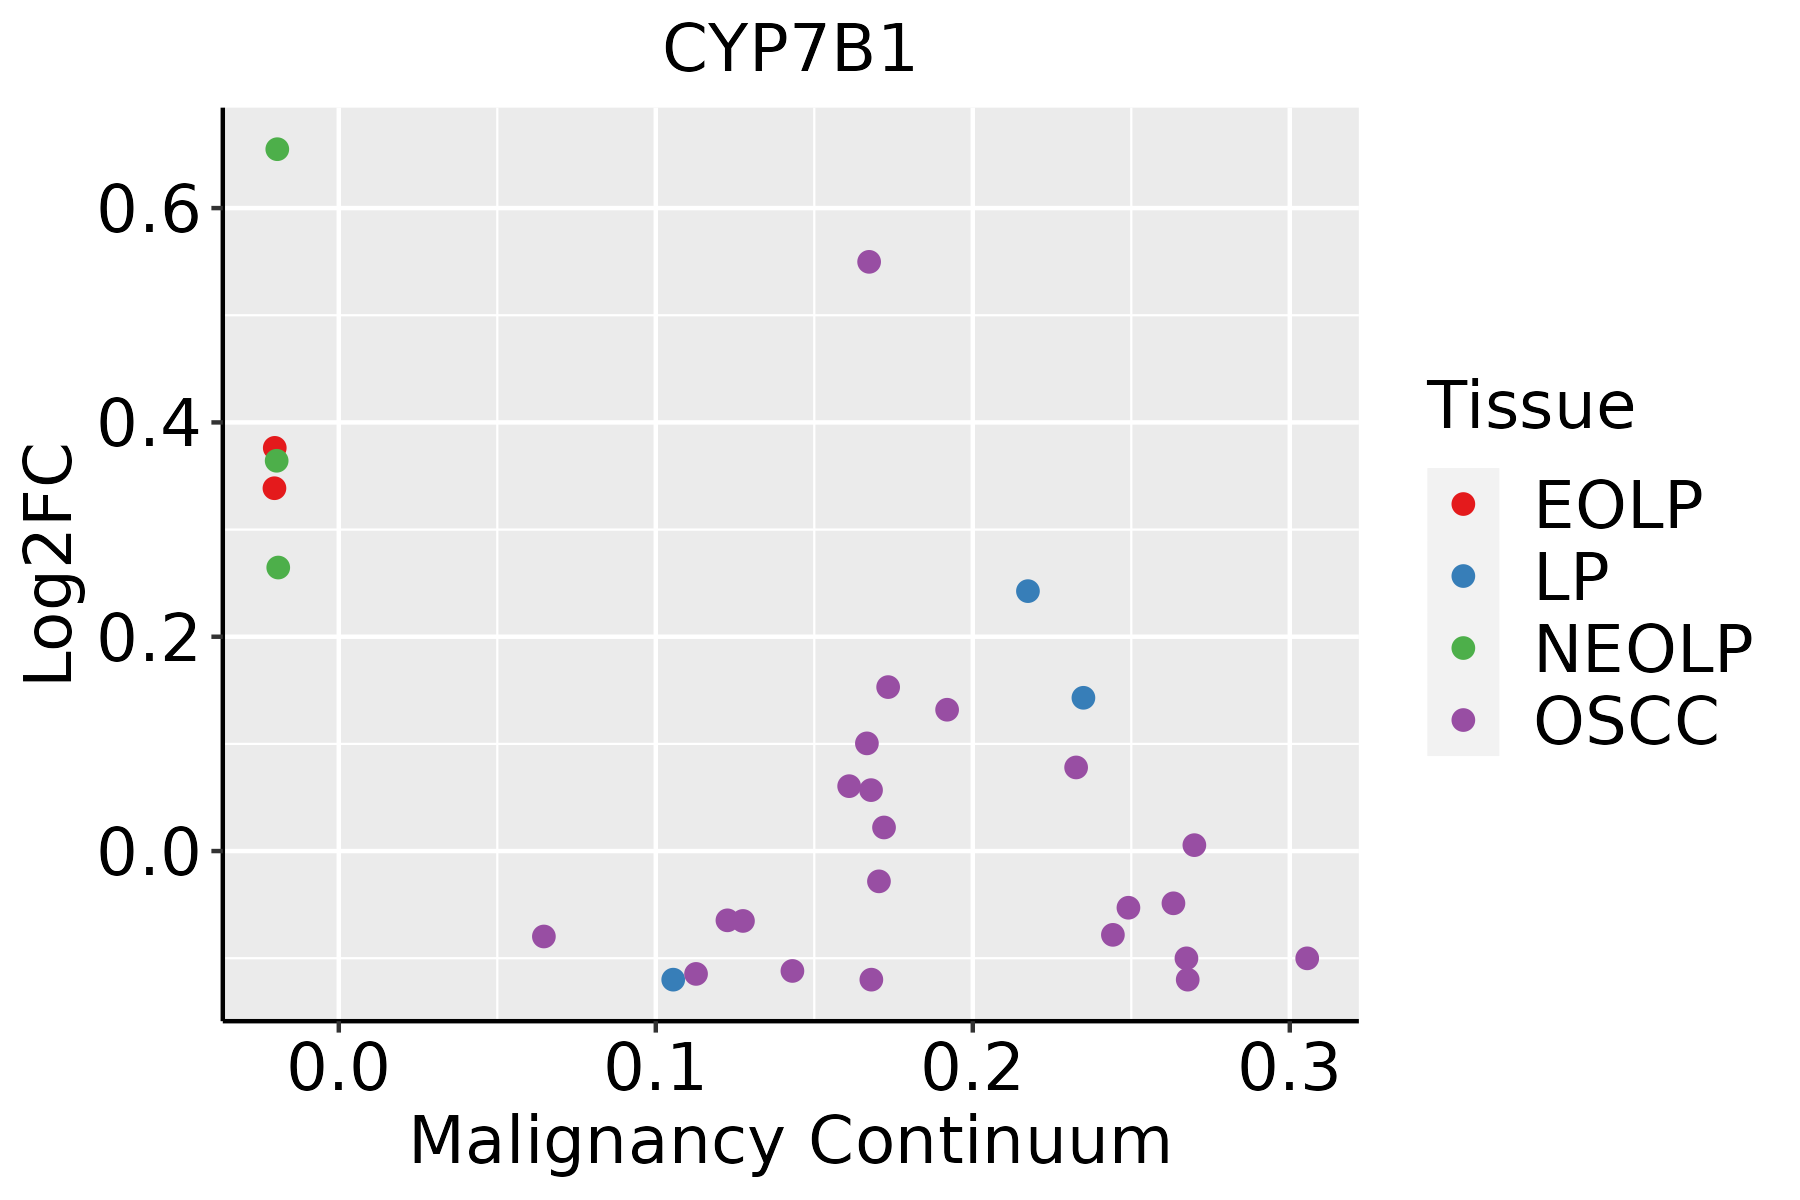 | EOLP: Erosive Oral lichen planus |
| LP: leukoplakia | ||
| NEOLP: Non-erosive oral lichen planus | ||
| OSCC: Oral squamous cell carcinoma |
| ∗log2FC in expression of this searched gene in stem-like cells from each diseased tissue sample relative to stem-like cells in normal samples in each tissue plotted against the malignancy continuum. Samples are colored based on if they are from different disease stage. |
Top |
Malignant transformation related pathway analysis |
| Find out the enriched GO biological processes and KEGG pathways involved in transition from healthy to precancer to cancer |
| Tissue | Disease Stage | Enriched GO biological Processes |
| Colorectum | AD |  |
| Colorectum | SER |  |
| Colorectum | MSS |  |
| Colorectum | MSI-H |  |
| Colorectum | FAP |  |
| ∗Top 15 enriched GO BP terms are showed in the bar plot of each disease state in each tissue. Each row represents a significant GO biological process which is colored according to the -log10(p.adjust). |
| Page: 1 2 3 4 5 6 7 8 9 |
| GO ID | Tissue | Disease Stage | Description | Gene Ratio | Bg Ratio | pvalue | p.adjust | Count |
| GO:00331437 | Oral cavity | OSCC | regulation of intracellular steroid hormone receptor signaling pathway | 44/7305 | 74/18723 | 2.89e-04 | 1.82e-03 | 44 |
| GO:003051816 | Oral cavity | OSCC | intracellular steroid hormone receptor signaling pathway | 64/7305 | 116/18723 | 2.96e-04 | 1.86e-03 | 64 |
| GO:005090010 | Oral cavity | OSCC | leukocyte migration | 176/7305 | 369/18723 | 3.80e-04 | 2.31e-03 | 176 |
| GO:00066945 | Oral cavity | OSCC | steroid biosynthetic process | 89/7305 | 173/18723 | 5.77e-04 | 3.30e-03 | 89 |
| GO:005067810 | Oral cavity | OSCC | regulation of epithelial cell proliferation | 180/7305 | 381/18723 | 5.88e-04 | 3.35e-03 | 180 |
| GO:00305206 | Oral cavity | OSCC | intracellular estrogen receptor signaling pathway | 33/7305 | 54/18723 | 8.25e-04 | 4.38e-03 | 33 |
| GO:00082033 | Oral cavity | OSCC | cholesterol metabolic process | 72/7305 | 137/18723 | 8.63e-04 | 4.55e-03 | 72 |
| GO:00016558 | Oral cavity | OSCC | urogenital system development | 160/7305 | 338/18723 | 1.03e-03 | 5.31e-03 | 160 |
| GO:19016173 | Oral cavity | OSCC | organic hydroxy compound biosynthetic process | 115/7305 | 237/18723 | 1.73e-03 | 8.18e-03 | 115 |
| GO:002261214 | Oral cavity | OSCC | gland morphogenesis | 62/7305 | 118/18723 | 1.91e-03 | 8.94e-03 | 62 |
| GO:00603269 | Oral cavity | OSCC | cell chemotaxis | 146/7305 | 310/18723 | 2.13e-03 | 9.80e-03 | 146 |
| GO:00161253 | Oral cavity | OSCC | sterol metabolic process | 77/7305 | 152/18723 | 2.26e-03 | 1.00e-02 | 77 |
| GO:00308505 | Oral cavity | OSCC | prostate gland development | 27/7305 | 45/18723 | 3.49e-03 | 1.47e-02 | 27 |
| GO:00331462 | Oral cavity | OSCC | regulation of intracellular estrogen receptor signaling pathway | 22/7305 | 35/18723 | 3.65e-03 | 1.51e-02 | 22 |
| GO:00305959 | Oral cavity | OSCC | leukocyte chemotaxis | 110/7305 | 230/18723 | 3.86e-03 | 1.58e-02 | 110 |
| GO:00082024 | Oral cavity | OSCC | steroid metabolic process | 146/7305 | 319/18723 | 7.78e-03 | 2.85e-02 | 146 |
| GO:003052225 | Oral cavity | EOLP | intracellular receptor signaling pathway | 64/2218 | 265/18723 | 1.56e-08 | 7.06e-07 | 64 |
| GO:004854526 | Oral cavity | EOLP | response to steroid hormone | 75/2218 | 339/18723 | 5.18e-08 | 1.92e-06 | 75 |
| GO:007138325 | Oral cavity | EOLP | cellular response to steroid hormone stimulus | 49/2218 | 204/18723 | 8.63e-07 | 2.15e-05 | 49 |
| GO:005090014 | Oral cavity | EOLP | leukocyte migration | 74/2218 | 369/18723 | 3.40e-06 | 7.35e-05 | 74 |
| Page: 1 2 3 4 5 6 7 8 9 |
| Pathway ID | Tissue | Disease Stage | Description | Gene Ratio | Bg Ratio | pvalue | p.adjust | qvalue | Count |
| hsa00120 | Liver | NAFLD | Primary bile acid biosynthesis | 9/1043 | 17/8465 | 6.10e-05 | 1.33e-03 | 1.07e-03 | 9 |
| hsa001201 | Liver | NAFLD | Primary bile acid biosynthesis | 9/1043 | 17/8465 | 6.10e-05 | 1.33e-03 | 1.07e-03 | 9 |
| hsa001202 | Liver | HCC | Primary bile acid biosynthesis | 14/4020 | 17/8465 | 3.49e-03 | 1.12e-02 | 6.22e-03 | 14 |
| hsa001203 | Liver | HCC | Primary bile acid biosynthesis | 14/4020 | 17/8465 | 3.49e-03 | 1.12e-02 | 6.22e-03 | 14 |
| Page: 1 |
Top |
Cell-cell communication analysis |
| Identification of potential cell-cell interactions between two cell types and their ligand-receptor pairs for different disease states |
| Ligand | Receptor | LRpair | Pathway | Tissue | Disease Stage |
| Page: 1 |
Top |
Single-cell gene regulatory network inference analysis |
| Find out the significant the regulons (TFs) and the target genes of each regulon across cell types for different disease states |
| TF | Cell Type | Tissue | Disease Stage | Target Gene | RSS | Regulon Activity |
| ∗The dot plots of a searched regulon are shown for all cell subpopulations in each disease state of each tissue based on the regulon specific score inferred using pySCENIC and by calculating the average expression. |
| Page: 1 |
Top |
Somatic mutation of malignant transformation related genes |
| Annotation of somatic variants for genes involved in malignant transformation |
| Hugo Symbol | Variant Class | Variant Classification | dbSNP RS | HGVSc | HGVSp | HGVSp Short | SWISSPROT | BIOTYPE | SIFT | PolyPhen | Tumor Sample Barcode | Tissue | Histology | Sex | Age | Stage | Therapy Types | Drugs | Outcome |
| CYP7B1 | SNV | Missense_Mutation | c.533C>A | p.Ala178Glu | p.A178E | O75881 | protein_coding | tolerated(1) | benign(0.003) | TCGA-AQ-A04J-01 | Breast | breast invasive carcinoma | Female | <65 | I/II | Chemotherapy | cytoxan | SD | |
| CYP7B1 | SNV | Missense_Mutation | c.602N>C | p.Ile201Thr | p.I201T | O75881 | protein_coding | tolerated(0.62) | benign(0.001) | TCGA-BH-A0RX-01 | Breast | breast invasive carcinoma | Female | <65 | I/II | Chemotherapy | fluorouracil | SD | |
| CYP7B1 | SNV | Missense_Mutation | novel | c.1085N>C | p.Leu362Pro | p.L362P | O75881 | protein_coding | deleterious(0) | probably_damaging(0.994) | TCGA-BH-A1FU-01 | Breast | breast invasive carcinoma | Female | <65 | I/II | Unknown | Unknown | PD |
| CYP7B1 | SNV | Missense_Mutation | novel | c.946N>A | p.Ala316Thr | p.A316T | O75881 | protein_coding | tolerated(0.14) | benign(0.292) | TCGA-2W-A8YY-01 | Cervix | cervical & endocervical cancer | Female | <65 | I/II | Chemotherapy | cisplatin | CR |
| CYP7B1 | SNV | Missense_Mutation | novel | c.376N>C | p.Ser126Arg | p.S126R | O75881 | protein_coding | tolerated(0.06) | benign(0.038) | TCGA-2W-A8YY-01 | Cervix | cervical & endocervical cancer | Female | <65 | I/II | Chemotherapy | cisplatin | CR |
| CYP7B1 | SNV | Missense_Mutation | c.922N>T | p.Leu308Phe | p.L308F | O75881 | protein_coding | deleterious(0.01) | possibly_damaging(0.706) | TCGA-EA-A3HU-01 | Cervix | cervical & endocervical cancer | Female | <65 | I/II | Unknown | Unknown | SD | |
| CYP7B1 | insertion | Frame_Shift_Ins | rs747514385 | c.314_315insA | p.Asn105LysfsTer3 | p.N105Kfs*3 | O75881 | protein_coding | TCGA-XS-A8TJ-01 | Cervix | cervical & endocervical cancer | Female | <65 | I/II | Chemotherapy | cisplatin | SD | ||
| CYP7B1 | SNV | Missense_Mutation | c.955N>T | p.Arg319Cys | p.R319C | O75881 | protein_coding | deleterious(0) | probably_damaging(0.977) | TCGA-A6-5665-01 | Colorectum | colon adenocarcinoma | Female | >=65 | I/II | Unknown | Unknown | PD | |
| CYP7B1 | SNV | Missense_Mutation | novel | c.967N>T | p.Asp323Tyr | p.D323Y | O75881 | protein_coding | tolerated(0.1) | probably_damaging(0.916) | TCGA-AA-3510-01 | Colorectum | colon adenocarcinoma | Male | >=65 | I/II | Unknown | Unknown | SD |
| CYP7B1 | SNV | Missense_Mutation | novel | c.1315N>A | p.Leu439Ile | p.L439I | O75881 | protein_coding | tolerated(0.2) | benign(0.119) | TCGA-AA-3811-01 | Colorectum | colon adenocarcinoma | Female | >=65 | III/IV | Unknown | Unknown | PD |
| Page: 1 2 3 4 5 6 7 8 9 10 11 |
Top |
Related drugs of malignant transformation related genes |
| Identification of chemicals and drugs interact with genes involved in malignant transfromation |
| (DGIdb 4.0) |
| Entrez ID | Symbol | Category | Interaction Types | Drug Claim Name | Drug Name | PMIDs |
| 9420 | CYP7B1 | ENZYME, DRUGGABLE GENOME, CYTOCHROME P450 | DIAZOXIDE | DIAZOXIDE | 8301566 | |
| 9420 | CYP7B1 | ENZYME, DRUGGABLE GENOME, CYTOCHROME P450 | MITOMYCIN-C | 8162589 | ||
| 9420 | CYP7B1 | ENZYME, DRUGGABLE GENOME, CYTOCHROME P450 | ACETAMINOPHEN | ACETAMINOPHEN | 2242029 | |
| 9420 | CYP7B1 | ENZYME, DRUGGABLE GENOME, CYTOCHROME P450 | ADRIAMYCIN | ADRIAMYCIN | 8162589 | |
| 9420 | CYP7B1 | ENZYME, DRUGGABLE GENOME, CYTOCHROME P450 | ANTI-DIABETIC AGENT | 15207658 | ||
| 9420 | CYP7B1 | ENZYME, DRUGGABLE GENOME, CYTOCHROME P450 | DDD | 7587937 | ||
| 9420 | CYP7B1 | ENZYME, DRUGGABLE GENOME, CYTOCHROME P450 | SAPONIN | 9342944 | ||
| 9420 | CYP7B1 | ENZYME, DRUGGABLE GENOME, CYTOCHROME P450 | GINKGO | GINKGO | 15901353 | |
| 9420 | CYP7B1 | ENZYME, DRUGGABLE GENOME, CYTOCHROME P450 | SR 4233 | 8461036 | ||
| 9420 | CYP7B1 | ENZYME, DRUGGABLE GENOME, CYTOCHROME P450 | LYCOPENE | LYCOPENE | 14640578 |
| Page: 1 2 |

Copyright 2023-Present -The University of Texas Health Science Center at Houston |