
|
|||||
|
 | |
| |
| |
| |
| |
| |
|
Gene: CNKSR3 |
Gene summary for CNKSR3 |
| Gene information | Species | Human | Gene symbol | CNKSR3 | Gene ID | 154043 |
| Gene name | CNKSR family member 3 | |
| Gene Alias | CNK3 | |
| Cytomap | 6q25.2 | |
| Gene Type | protein-coding | GO ID | GO:0000165 | UniProtAcc | Q6P9H4 |
Top |
Malignant transformation analysis |
| Identification of the aberrant gene expression in precancerous and cancerous lesions by comparing the gene expression of stem-like cells in diseased tissues with normal stem cells |
| Entrez ID | Symbol | Replicates | Species | Organ | Tissue | Adj P-value | Log2FC | Malignancy |
| 154043 | CNKSR3 | HTA11_347_2000001011 | Human | Colorectum | AD | 2.25e-02 | 4.46e-01 | -0.1954 |
| 154043 | CNKSR3 | HTA11_411_2000001011 | Human | Colorectum | SER | 4.13e-03 | 1.14e+00 | -0.2602 |
| 154043 | CNKSR3 | A001-C-207 | Human | Colorectum | FAP | 9.92e-03 | -2.21e-01 | 0.1278 |
| 154043 | CNKSR3 | A015-C-203 | Human | Colorectum | FAP | 2.24e-16 | -2.60e-01 | -0.1294 |
| 154043 | CNKSR3 | A015-C-204 | Human | Colorectum | FAP | 8.26e-04 | -2.13e-01 | -0.0228 |
| 154043 | CNKSR3 | A002-C-201 | Human | Colorectum | FAP | 1.83e-12 | -3.74e-01 | 0.0324 |
| 154043 | CNKSR3 | A002-C-203 | Human | Colorectum | FAP | 1.80e-02 | -6.67e-02 | 0.2786 |
| 154043 | CNKSR3 | A001-C-119 | Human | Colorectum | FAP | 4.54e-03 | -2.45e-01 | -0.1557 |
| 154043 | CNKSR3 | A001-C-108 | Human | Colorectum | FAP | 4.79e-13 | -2.73e-01 | -0.0272 |
| 154043 | CNKSR3 | A002-C-205 | Human | Colorectum | FAP | 1.84e-14 | -3.32e-01 | -0.1236 |
| 154043 | CNKSR3 | A015-C-005 | Human | Colorectum | FAP | 6.22e-03 | -2.25e-01 | -0.0336 |
| 154043 | CNKSR3 | A015-C-006 | Human | Colorectum | FAP | 1.86e-10 | -3.40e-01 | -0.0994 |
| 154043 | CNKSR3 | A015-C-106 | Human | Colorectum | FAP | 7.23e-07 | -2.20e-01 | -0.0511 |
| 154043 | CNKSR3 | A002-C-114 | Human | Colorectum | FAP | 3.37e-11 | -3.13e-01 | -0.1561 |
| 154043 | CNKSR3 | A015-C-104 | Human | Colorectum | FAP | 1.18e-18 | -3.24e-01 | -0.1899 |
| 154043 | CNKSR3 | A001-C-014 | Human | Colorectum | FAP | 1.24e-08 | -2.40e-01 | 0.0135 |
| 154043 | CNKSR3 | A002-C-016 | Human | Colorectum | FAP | 3.61e-13 | -2.73e-01 | 0.0521 |
| 154043 | CNKSR3 | A015-C-002 | Human | Colorectum | FAP | 4.52e-07 | -3.19e-01 | -0.0763 |
| 154043 | CNKSR3 | A001-C-203 | Human | Colorectum | FAP | 2.20e-03 | -9.42e-02 | -0.0481 |
| 154043 | CNKSR3 | A002-C-116 | Human | Colorectum | FAP | 9.75e-19 | -2.89e-01 | -0.0452 |
| Page: 1 2 3 4 5 6 7 |
| Tissue | Expression Dynamics | Abbreviation |
| Colorectum (GSE201348) |  | FAP: Familial adenomatous polyposis |
| CRC: Colorectal cancer | ||
| Colorectum (HTA11) |  | AD: Adenomas |
| SER: Sessile serrated lesions | ||
| MSI-H: Microsatellite-high colorectal cancer | ||
| MSS: Microsatellite stable colorectal cancer | ||
| Endometrium |  | AEH: Atypical endometrial hyperplasia |
| EEC: Endometrioid Cancer | ||
| Esophagus |  | ESCC: Esophageal squamous cell carcinoma |
| HGIN: High-grade intraepithelial neoplasias | ||
| LGIN: Low-grade intraepithelial neoplasias | ||
| Liver | 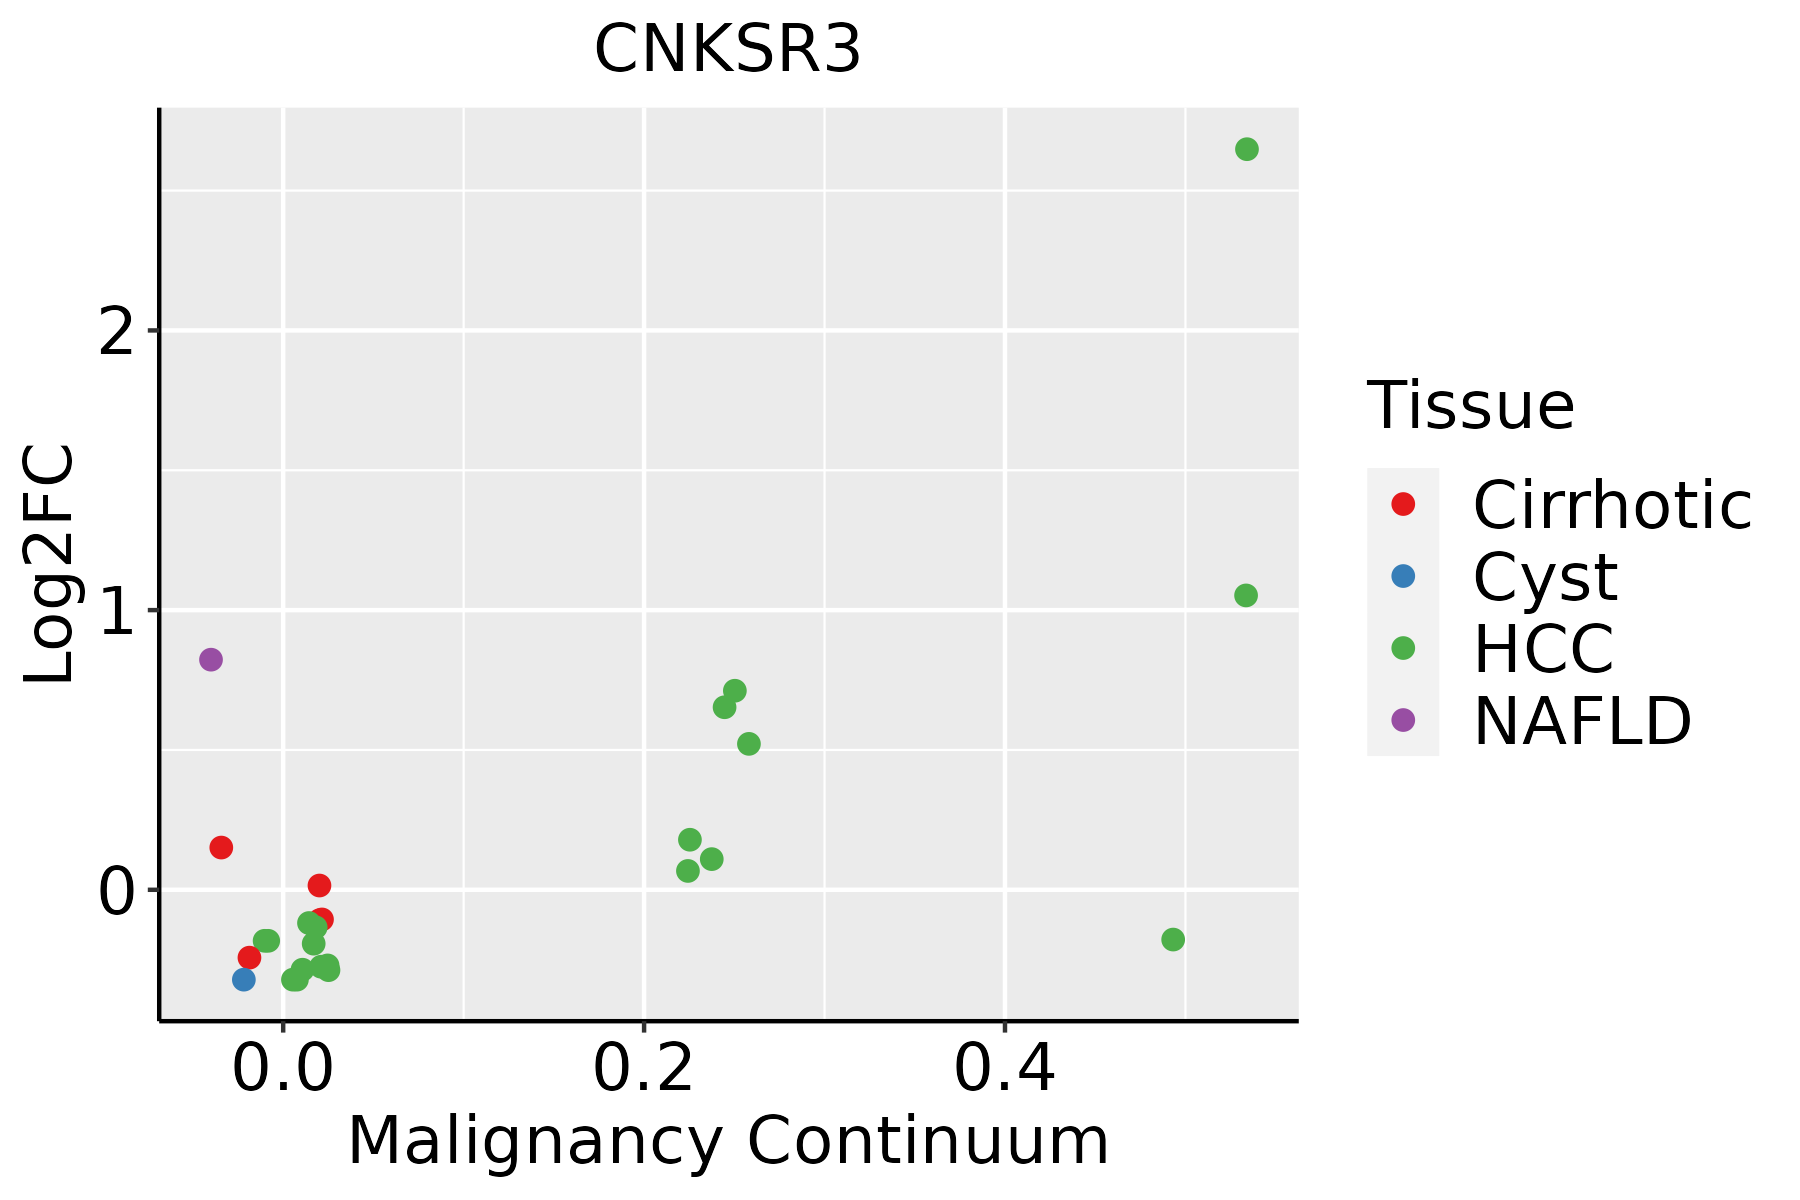 | HCC: Hepatocellular carcinoma |
| NAFLD: Non-alcoholic fatty liver disease | ||
| Lung | 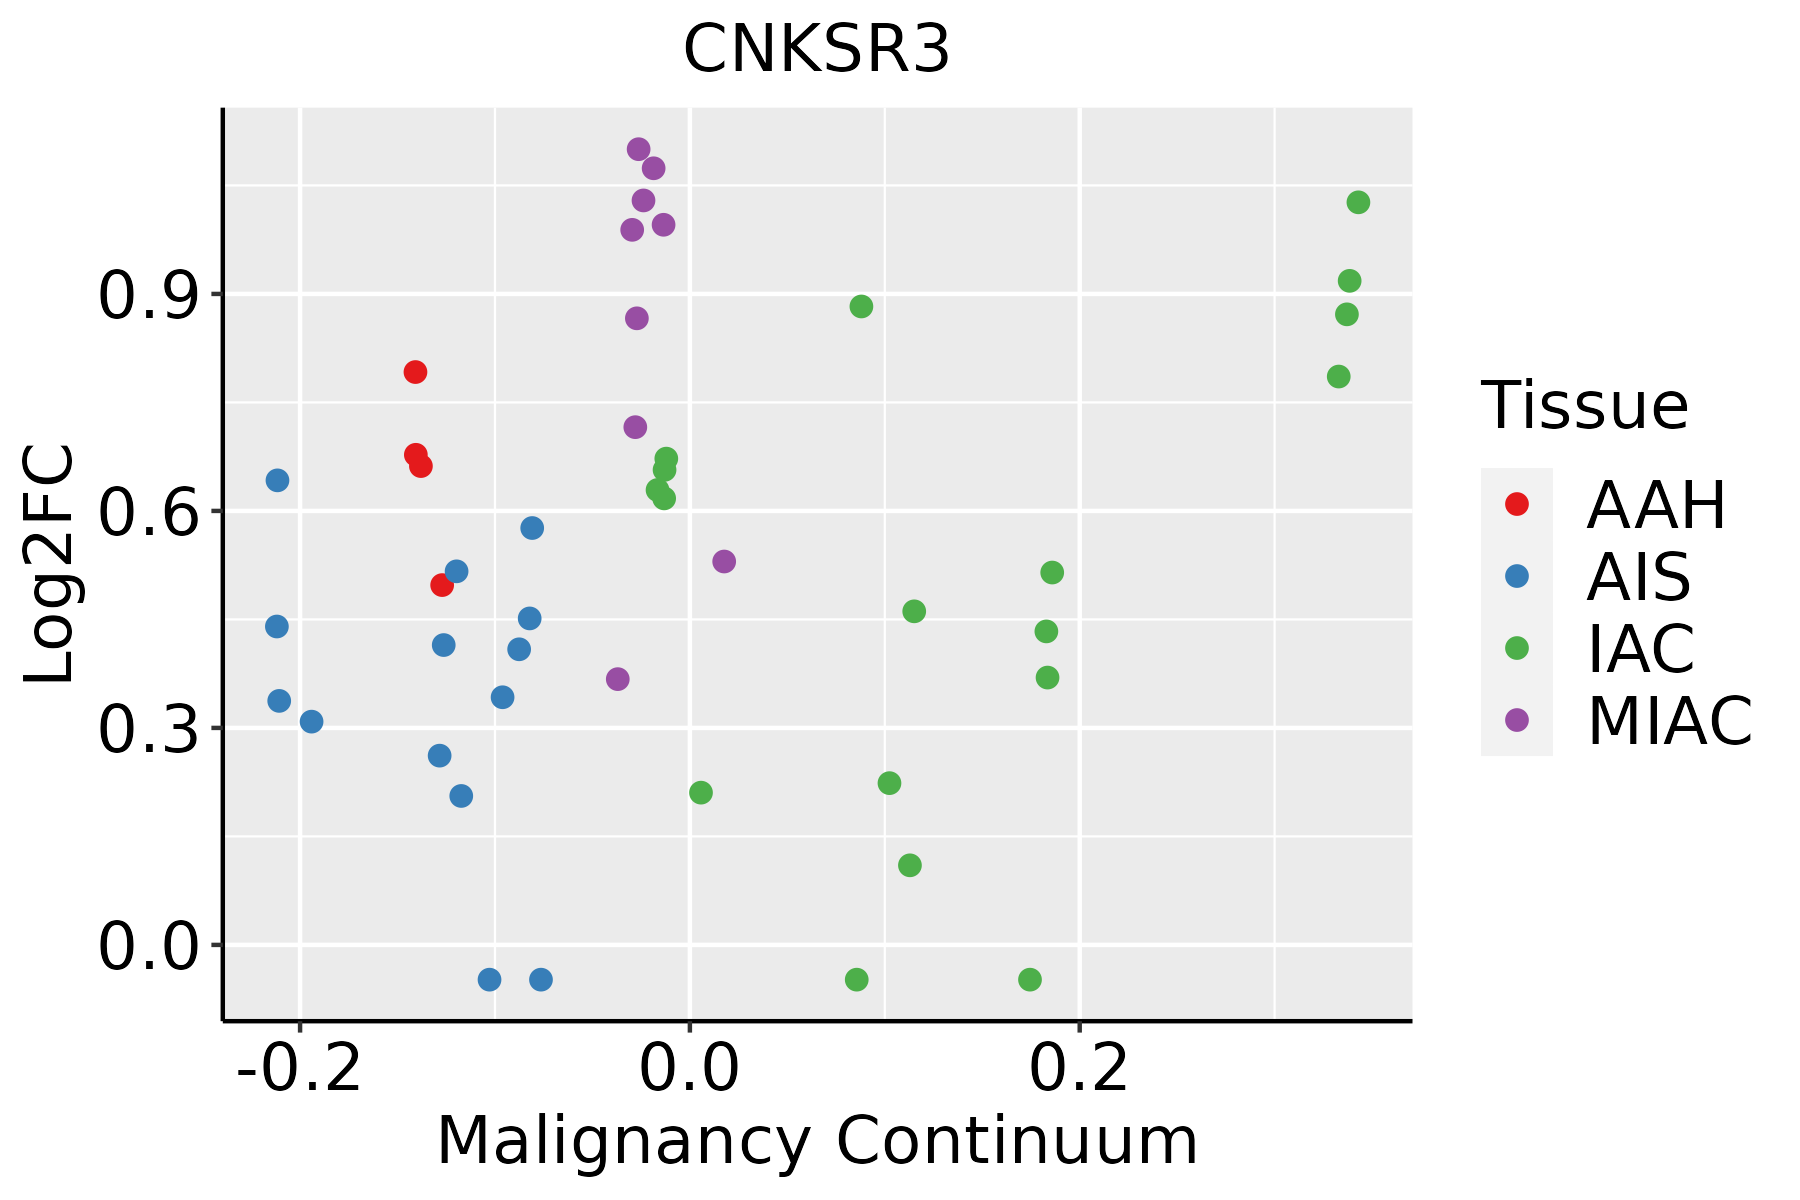 | AAH: Atypical adenomatous hyperplasia |
| AIS: Adenocarcinoma in situ | ||
| IAC: Invasive lung adenocarcinoma | ||
| MIA: Minimally invasive adenocarcinoma | ||
| Thyroid |  | ATC: Anaplastic thyroid cancer |
| HT: Hashimoto's thyroiditis | ||
| PTC: Papillary thyroid cancer |
| ∗log2FC in expression of this searched gene in stem-like cells from each diseased tissue sample relative to stem-like cells in normal samples in each tissue plotted against the malignancy continuum. Samples are colored based on if they are from different disease stage. |
Top |
Malignant transformation related pathway analysis |
| Find out the enriched GO biological processes and KEGG pathways involved in transition from healthy to precancer to cancer |
| Tissue | Disease Stage | Enriched GO biological Processes |
| Colorectum | AD |  |
| Colorectum | SER |  |
| Colorectum | MSS |  |
| Colorectum | MSI-H |  |
| Colorectum | FAP |  |
| ∗Top 15 enriched GO BP terms are showed in the bar plot of each disease state in each tissue. Each row represents a significant GO biological process which is colored according to the -log10(p.adjust). |
| Page: 1 2 3 4 5 6 7 8 9 |
| GO ID | Tissue | Disease Stage | Description | Gene Ratio | Bg Ratio | pvalue | p.adjust | Count |
| GO:004232623 | Lung | AAH | negative regulation of phosphorylation | 24/613 | 385/18723 | 2.06e-03 | 4.56e-02 | 24 |
| GO:000193323 | Lung | AAH | negative regulation of protein phosphorylation | 22/613 | 342/18723 | 2.11e-03 | 4.61e-02 | 22 |
| GO:001810521 | Lung | MIAC | peptidyl-serine phosphorylation | 37/967 | 315/18723 | 2.73e-06 | 3.12e-04 | 37 |
| GO:001820921 | Lung | MIAC | peptidyl-serine modification | 37/967 | 338/18723 | 1.38e-05 | 9.86e-04 | 37 |
| GO:004340931 | Lung | MIAC | negative regulation of MAPK cascade | 21/967 | 180/18723 | 4.12e-04 | 1.19e-02 | 21 |
| GO:004593632 | Lung | MIAC | negative regulation of phosphate metabolic process | 38/967 | 441/18723 | 1.44e-03 | 2.54e-02 | 38 |
| GO:001056332 | Lung | MIAC | negative regulation of phosphorus metabolic process | 38/967 | 442/18723 | 1.50e-03 | 2.60e-02 | 38 |
| GO:000202821 | Lung | MIAC | regulation of sodium ion transport | 12/967 | 90/18723 | 2.24e-03 | 3.43e-02 | 12 |
| GO:004232632 | Lung | MIAC | negative regulation of phosphorylation | 33/967 | 385/18723 | 3.11e-03 | 4.17e-02 | 33 |
| GO:00331351 | Lung | MIAC | regulation of peptidyl-serine phosphorylation | 16/967 | 144/18723 | 3.16e-03 | 4.23e-02 | 16 |
| GO:00703712 | Lung | MIAC | ERK1 and ERK2 cascade | 29/967 | 330/18723 | 3.78e-03 | 4.67e-02 | 29 |
| GO:0010563113 | Thyroid | PTC | negative regulation of phosphorus metabolic process | 219/5968 | 442/18723 | 4.47e-15 | 3.07e-13 | 219 |
| GO:0045936113 | Thyroid | PTC | negative regulation of phosphate metabolic process | 218/5968 | 441/18723 | 7.08e-15 | 4.75e-13 | 218 |
| GO:0001933113 | Thyroid | PTC | negative regulation of protein phosphorylation | 173/5968 | 342/18723 | 3.46e-13 | 1.75e-11 | 173 |
| GO:0042326113 | Thyroid | PTC | negative regulation of phosphorylation | 189/5968 | 385/18723 | 1.00e-12 | 4.64e-11 | 189 |
| GO:001810518 | Thyroid | PTC | peptidyl-serine phosphorylation | 143/5968 | 315/18723 | 2.94e-07 | 5.04e-06 | 143 |
| GO:001820916 | Thyroid | PTC | peptidyl-serine modification | 151/5968 | 338/18723 | 4.61e-07 | 7.51e-06 | 151 |
| GO:0043409112 | Thyroid | PTC | negative regulation of MAPK cascade | 76/5968 | 180/18723 | 2.15e-03 | 1.14e-02 | 76 |
| GO:00331356 | Thyroid | PTC | regulation of peptidyl-serine phosphorylation | 62/5968 | 144/18723 | 3.05e-03 | 1.50e-02 | 62 |
| GO:001056334 | Thyroid | ATC | negative regulation of phosphorus metabolic process | 234/6293 | 442/18723 | 2.30e-17 | 2.31e-15 | 234 |
| Page: 1 2 3 4 5 6 7 8 |
| Pathway ID | Tissue | Disease Stage | Description | Gene Ratio | Bg Ratio | pvalue | p.adjust | qvalue | Count |
| Page: 1 |
Top |
Cell-cell communication analysis |
| Identification of potential cell-cell interactions between two cell types and their ligand-receptor pairs for different disease states |
| Ligand | Receptor | LRpair | Pathway | Tissue | Disease Stage |
| Page: 1 |
Top |
Single-cell gene regulatory network inference analysis |
| Find out the significant the regulons (TFs) and the target genes of each regulon across cell types for different disease states |
| TF | Cell Type | Tissue | Disease Stage | Target Gene | RSS | Regulon Activity |
| ∗The dot plots of a searched regulon are shown for all cell subpopulations in each disease state of each tissue based on the regulon specific score inferred using pySCENIC and by calculating the average expression. |
| Page: 1 |
Top |
Somatic mutation of malignant transformation related genes |
| Annotation of somatic variants for genes involved in malignant transformation |
| Hugo Symbol | Variant Class | Variant Classification | dbSNP RS | HGVSc | HGVSp | HGVSp Short | SWISSPROT | BIOTYPE | SIFT | PolyPhen | Tumor Sample Barcode | Tissue | Histology | Sex | Age | Stage | Therapy Types | Drugs | Outcome |
| CNKSR3 | SNV | Missense_Mutation | c.106N>G | p.Asn36Asp | p.N36D | Q6P9H4 | protein_coding | tolerated(0.66) | benign(0) | TCGA-A8-A09Q-01 | Breast | breast invasive carcinoma | Female | >=65 | III/IV | Hormone Therapy | anastrozole | SD | |
| CNKSR3 | SNV | Missense_Mutation | rs749538561 | c.1402G>A | p.Glu468Lys | p.E468K | Q6P9H4 | protein_coding | deleterious(0) | probably_damaging(0.94) | TCGA-AN-A046-01 | Breast | breast invasive carcinoma | Female | >=65 | I/II | Unknown | Unknown | SD |
| CNKSR3 | SNV | Missense_Mutation | c.382N>T | p.Ile128Phe | p.I128F | Q6P9H4 | protein_coding | deleterious(0) | probably_damaging(0.999) | TCGA-AR-A0TU-01 | Breast | breast invasive carcinoma | Female | <65 | I/II | Unspecific | Doxorubicin | SD | |
| CNKSR3 | SNV | Missense_Mutation | c.1257N>A | p.Met419Ile | p.M419I | Q6P9H4 | protein_coding | tolerated(0.1) | benign(0.136) | TCGA-LP-A5U2-01 | Cervix | cervical & endocervical cancer | Female | <65 | III/IV | Unknown | Unknown | SD | |
| CNKSR3 | SNV | Missense_Mutation | c.487N>A | p.Leu163Met | p.L163M | Q6P9H4 | protein_coding | deleterious(0) | probably_damaging(1) | TCGA-AA-3947-01 | Colorectum | colon adenocarcinoma | Female | <65 | I/II | Unknown | Unknown | SD | |
| CNKSR3 | SNV | Missense_Mutation | c.1387C>T | p.Arg463Trp | p.R463W | Q6P9H4 | protein_coding | deleterious(0) | probably_damaging(0.984) | TCGA-AA-A029-01 | Colorectum | colon adenocarcinoma | Male | >=65 | I/II | Unknown | Unknown | SD | |
| CNKSR3 | SNV | Missense_Mutation | rs769098143 | c.164N>A | p.Arg55Gln | p.R55Q | Q6P9H4 | protein_coding | tolerated(0.05) | benign(0.368) | TCGA-AD-6895-01 | Colorectum | colon adenocarcinoma | Male | >=65 | III/IV | Unknown | Unknown | SD |
| CNKSR3 | SNV | Missense_Mutation | c.464N>C | p.Lys155Thr | p.K155T | Q6P9H4 | protein_coding | tolerated(0.28) | possibly_damaging(0.583) | TCGA-AY-4071-01 | Colorectum | colon adenocarcinoma | Female | <65 | I/II | Unknown | Unknown | SD | |
| CNKSR3 | SNV | Missense_Mutation | rs755857610 | c.769N>A | p.Glu257Lys | p.E257K | Q6P9H4 | protein_coding | deleterious(0) | probably_damaging(0.999) | TCGA-AZ-4315-01 | Colorectum | colon adenocarcinoma | Male | <65 | I/II | Unknown | Unknown | SD |
| CNKSR3 | SNV | Missense_Mutation | c.289N>G | p.Asn97Asp | p.N97D | Q6P9H4 | protein_coding | tolerated(0.08) | benign(0.233) | TCGA-AZ-6598-01 | Colorectum | colon adenocarcinoma | Female | >=65 | I/II | Unknown | Unknown | SD |
| Page: 1 2 3 4 5 |
Top |
Related drugs of malignant transformation related genes |
| Identification of chemicals and drugs interact with genes involved in malignant transfromation |
| (DGIdb 4.0) |
| Entrez ID | Symbol | Category | Interaction Types | Drug Claim Name | Drug Name | PMIDs |
| Page: 1 |

Copyright 2023-Present -The University of Texas Health Science Center at Houston |