
|
|||||
|
 | |
| |
| |
| |
| |
| |
|
Gene: CHTOP |
Gene summary for CHTOP |
| Gene information | Species | Human | Gene symbol | CHTOP | Gene ID | 26097 |
| Gene name | chromatin target of PRMT1 | |
| Gene Alias | C10orf77 | |
| Cytomap | 1q21.3 | |
| Gene Type | protein-coding | GO ID | GO:0001701 | UniProtAcc | Q9Y3Y2 |
Top |
Malignant transformation analysis |
| Identification of the aberrant gene expression in precancerous and cancerous lesions by comparing the gene expression of stem-like cells in diseased tissues with normal stem cells |
| Entrez ID | Symbol | Replicates | Species | Organ | Tissue | Adj P-value | Log2FC | Malignancy |
| 26097 | CHTOP | LZE2T | Human | Esophagus | ESCC | 2.50e-10 | 8.21e-01 | 0.082 |
| 26097 | CHTOP | LZE4T | Human | Esophagus | ESCC | 1.25e-19 | 5.01e-01 | 0.0811 |
| 26097 | CHTOP | LZE7T | Human | Esophagus | ESCC | 9.76e-12 | 5.45e-01 | 0.0667 |
| 26097 | CHTOP | LZE8T | Human | Esophagus | ESCC | 4.25e-12 | 3.01e-01 | 0.067 |
| 26097 | CHTOP | LZE20T | Human | Esophagus | ESCC | 1.29e-05 | 2.75e-01 | 0.0662 |
| 26097 | CHTOP | LZE24T | Human | Esophagus | ESCC | 2.11e-19 | 5.99e-01 | 0.0596 |
| 26097 | CHTOP | LZE21T | Human | Esophagus | ESCC | 1.60e-07 | 4.60e-01 | 0.0655 |
| 26097 | CHTOP | LZE6T | Human | Esophagus | ESCC | 1.15e-10 | 3.99e-01 | 0.0845 |
| 26097 | CHTOP | P1T-E | Human | Esophagus | ESCC | 1.03e-17 | 6.22e-01 | 0.0875 |
| 26097 | CHTOP | P2T-E | Human | Esophagus | ESCC | 1.78e-54 | 9.10e-01 | 0.1177 |
| 26097 | CHTOP | P4T-E | Human | Esophagus | ESCC | 4.75e-28 | 7.15e-01 | 0.1323 |
| 26097 | CHTOP | P5T-E | Human | Esophagus | ESCC | 3.21e-52 | 9.27e-01 | 0.1327 |
| 26097 | CHTOP | P8T-E | Human | Esophagus | ESCC | 6.85e-36 | 5.96e-01 | 0.0889 |
| 26097 | CHTOP | P9T-E | Human | Esophagus | ESCC | 6.43e-27 | 7.40e-01 | 0.1131 |
| 26097 | CHTOP | P10T-E | Human | Esophagus | ESCC | 5.58e-46 | 8.75e-01 | 0.116 |
| 26097 | CHTOP | P11T-E | Human | Esophagus | ESCC | 1.20e-27 | 1.04e+00 | 0.1426 |
| 26097 | CHTOP | P12T-E | Human | Esophagus | ESCC | 9.99e-31 | 5.51e-01 | 0.1122 |
| 26097 | CHTOP | P15T-E | Human | Esophagus | ESCC | 1.27e-37 | 9.52e-01 | 0.1149 |
| 26097 | CHTOP | P16T-E | Human | Esophagus | ESCC | 5.28e-29 | 6.44e-01 | 0.1153 |
| 26097 | CHTOP | P17T-E | Human | Esophagus | ESCC | 4.93e-14 | 6.95e-01 | 0.1278 |
| Page: 1 2 3 4 5 6 7 |
| Tissue | Expression Dynamics | Abbreviation |
| Esophagus | 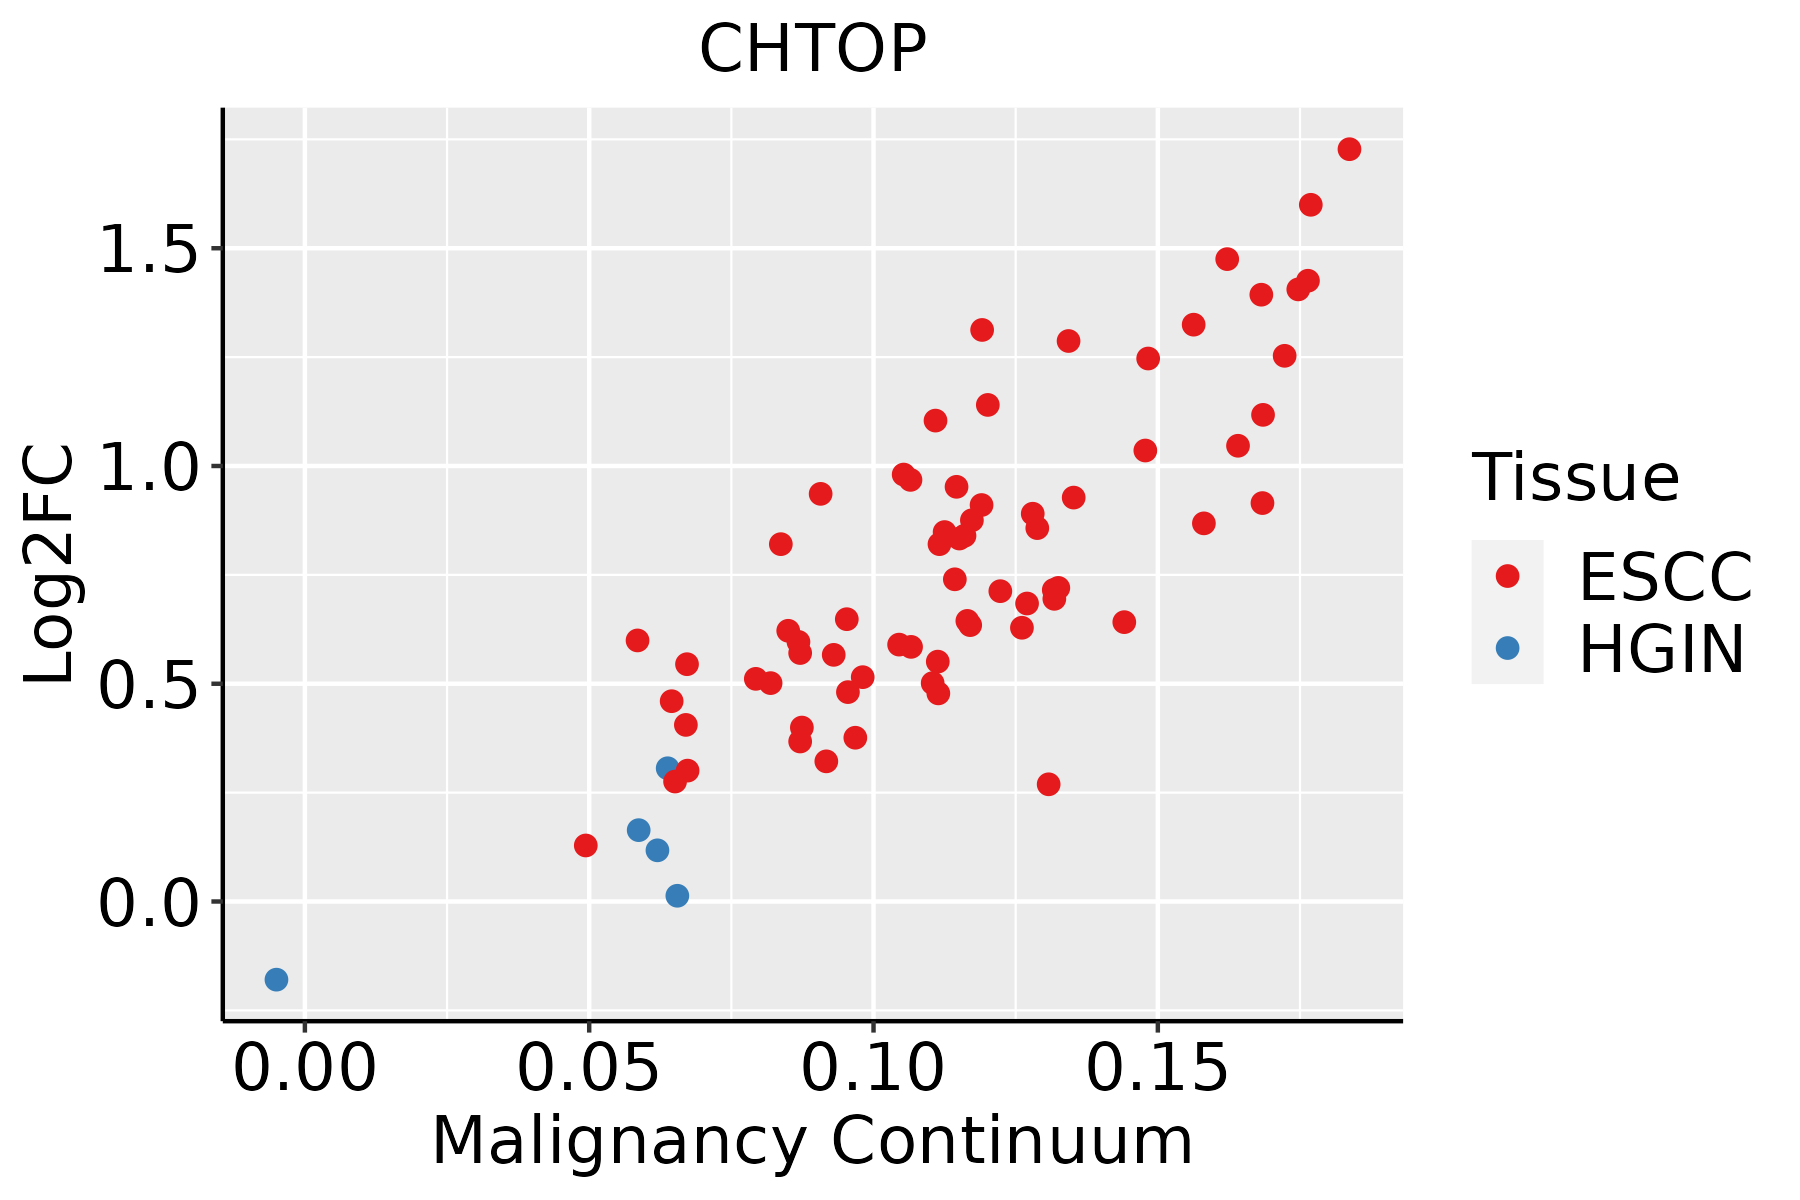 | ESCC: Esophageal squamous cell carcinoma |
| HGIN: High-grade intraepithelial neoplasias | ||
| LGIN: Low-grade intraepithelial neoplasias | ||
| Liver | 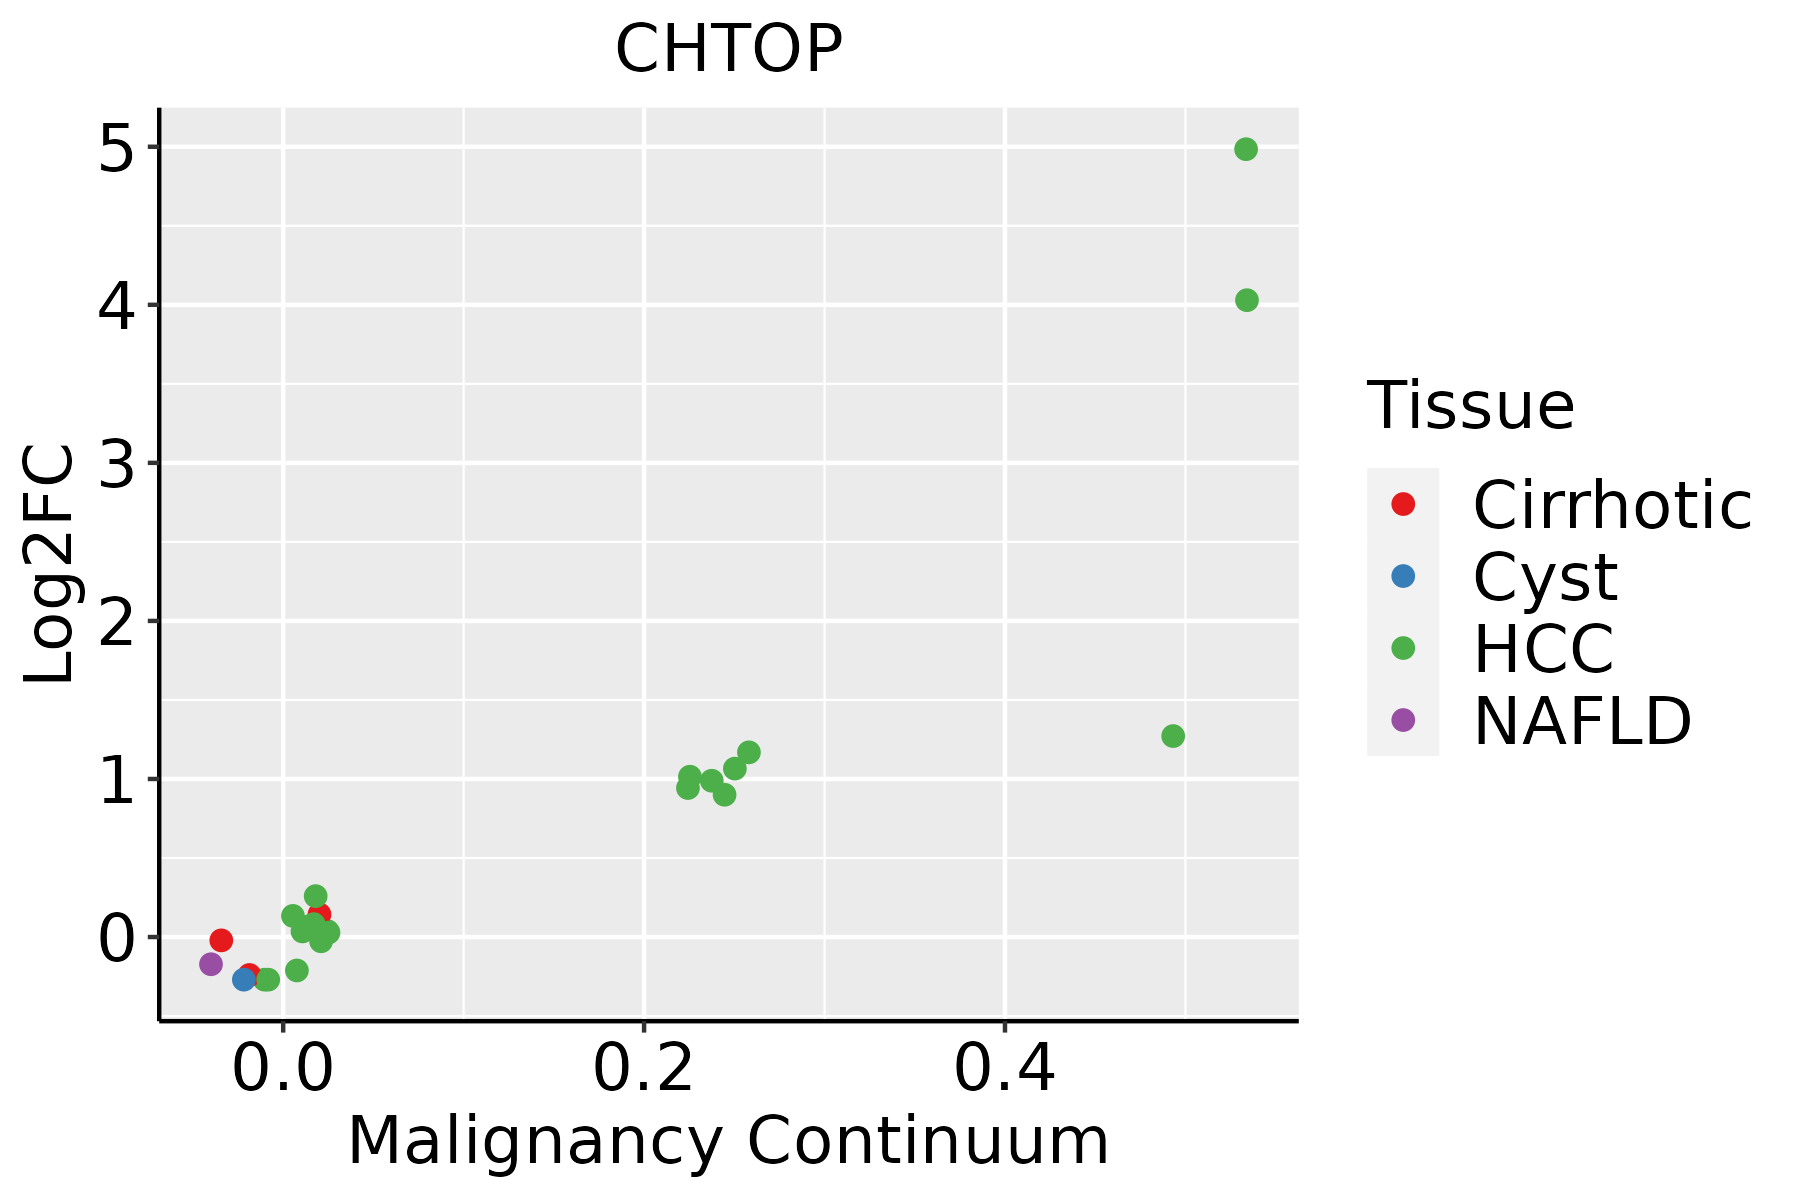 | HCC: Hepatocellular carcinoma |
| NAFLD: Non-alcoholic fatty liver disease | ||
| Oral Cavity |  | EOLP: Erosive Oral lichen planus |
| LP: leukoplakia | ||
| NEOLP: Non-erosive oral lichen planus | ||
| OSCC: Oral squamous cell carcinoma | ||
| Skin | 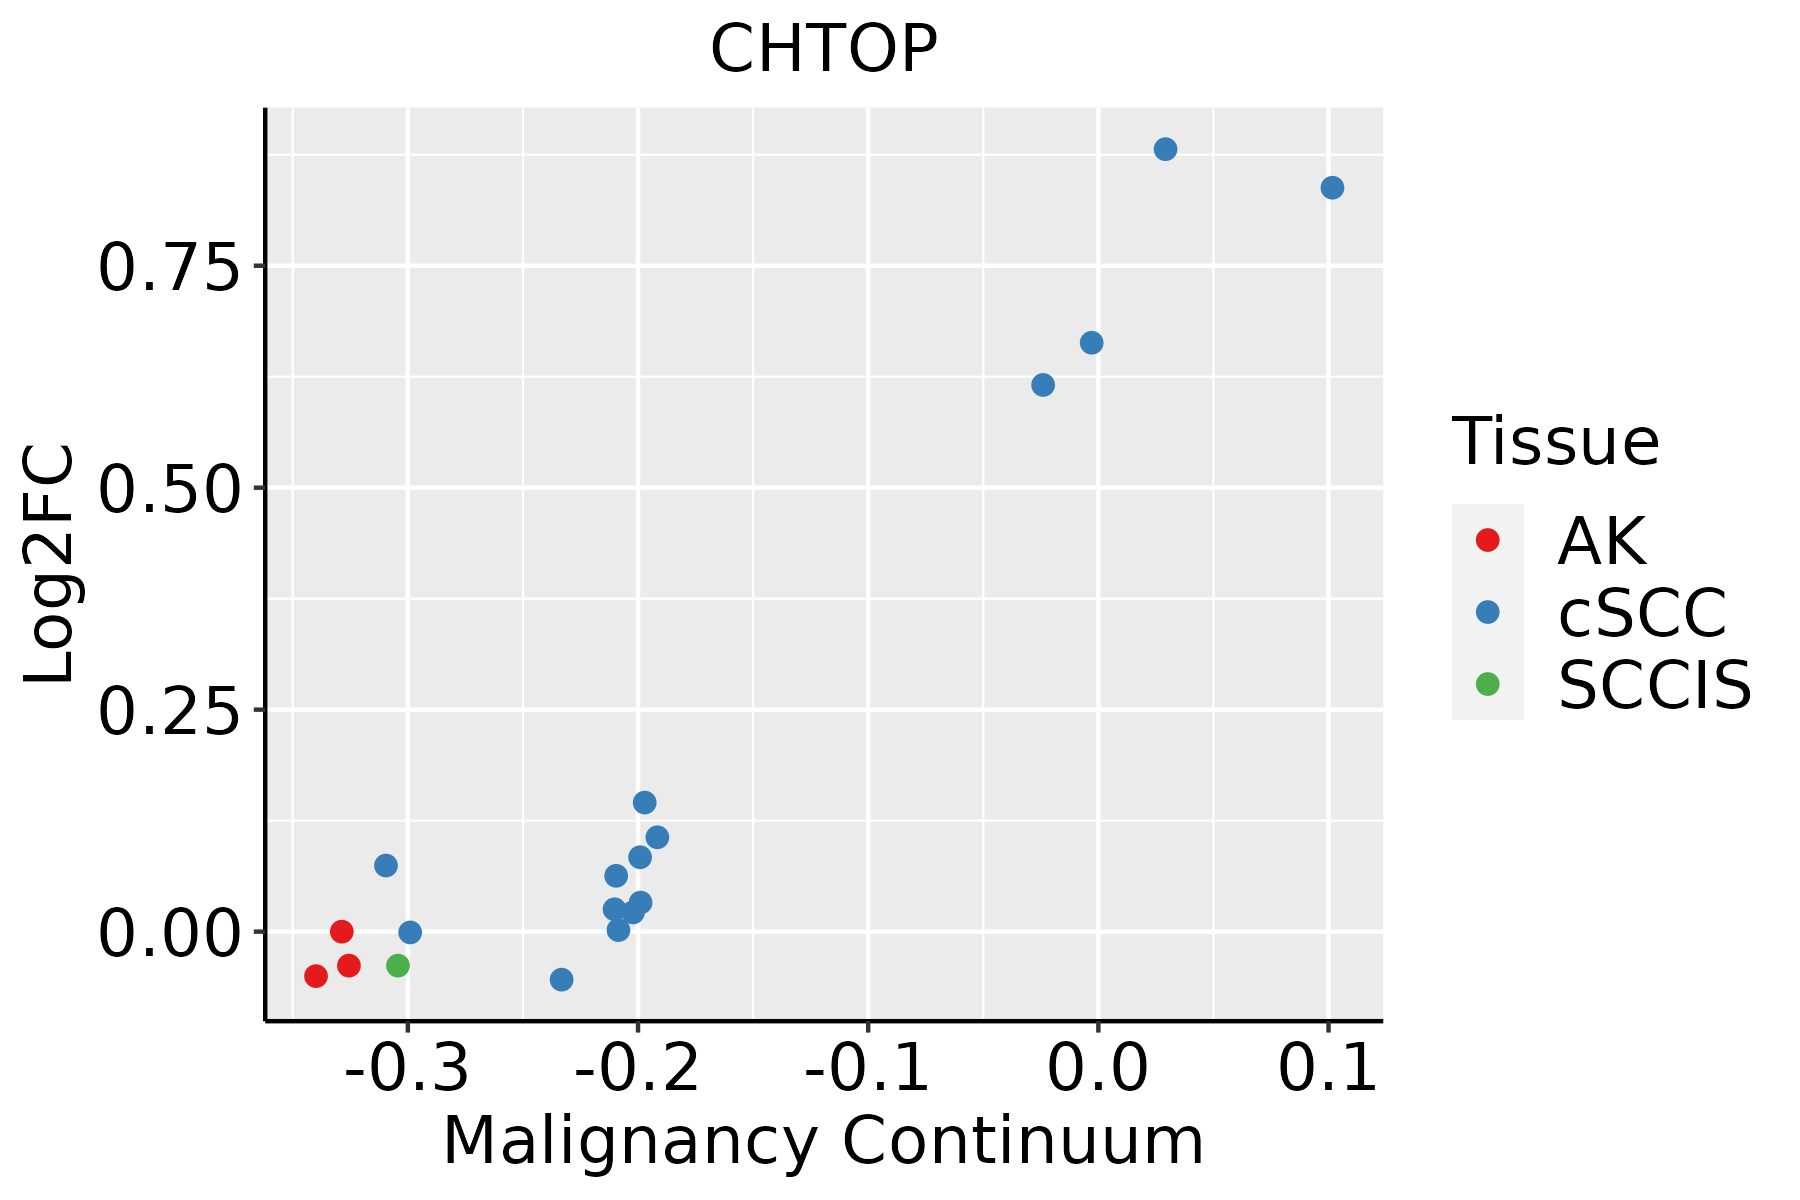 | AK: Actinic keratosis |
| cSCC: Cutaneous squamous cell carcinoma | ||
| SCCIS:squamous cell carcinoma in situ | ||
| Thyroid |  | ATC: Anaplastic thyroid cancer |
| HT: Hashimoto's thyroiditis | ||
| PTC: Papillary thyroid cancer |
| ∗log2FC in expression of this searched gene in stem-like cells from each diseased tissue sample relative to stem-like cells in normal samples in each tissue plotted against the malignancy continuum. Samples are colored based on if they are from different disease stage. |
Top |
Malignant transformation related pathway analysis |
| Find out the enriched GO biological processes and KEGG pathways involved in transition from healthy to precancer to cancer |
| Tissue | Disease Stage | Enriched GO biological Processes |
| Colorectum | AD |  |
| Colorectum | SER |  |
| Colorectum | MSS |  |
| Colorectum | MSI-H |  |
| Colorectum | FAP |  |
| ∗Top 15 enriched GO BP terms are showed in the bar plot of each disease state in each tissue. Each row represents a significant GO biological process which is colored according to the -log10(p.adjust). |
| Page: 1 2 3 4 5 6 7 8 9 |
| GO ID | Tissue | Disease Stage | Description | Gene Ratio | Bg Ratio | pvalue | p.adjust | Count |
| GO:000640511 | Oral cavity | LP | RNA export from nucleus | 40/4623 | 84/18723 | 4.24e-06 | 8.71e-05 | 40 |
| GO:007142611 | Oral cavity | LP | ribonucleoprotein complex export from nucleus | 37/4623 | 76/18723 | 5.02e-06 | 1.01e-04 | 37 |
| GO:003150313 | Oral cavity | LP | protein-containing complex localization | 82/4623 | 220/18723 | 2.08e-05 | 3.44e-04 | 82 |
| GO:001657014 | Oral cavity | LP | histone modification | 152/4623 | 463/18723 | 4.04e-05 | 5.90e-04 | 152 |
| GO:000640611 | Oral cavity | LP | mRNA export from nucleus | 28/4623 | 59/18723 | 1.22e-04 | 1.43e-03 | 28 |
| GO:007142711 | Oral cavity | LP | mRNA-containing ribonucleoprotein complex export from nucleus | 28/4623 | 59/18723 | 1.22e-04 | 1.43e-03 | 28 |
| GO:003105613 | Oral cavity | LP | regulation of histone modification | 55/4623 | 152/18723 | 1.01e-03 | 8.48e-03 | 55 |
| GO:00310581 | Oral cavity | LP | positive regulation of histone modification | 36/4623 | 92/18723 | 1.51e-03 | 1.18e-02 | 36 |
| GO:003278113 | Oral cavity | LP | positive regulation of ATPase activity | 13/4623 | 27/18723 | 6.92e-03 | 3.96e-02 | 13 |
| GO:000691324 | Skin | cSCC | nucleocytoplasmic transport | 162/4864 | 301/18723 | 4.20e-25 | 1.10e-22 | 162 |
| GO:005116924 | Skin | cSCC | nuclear transport | 162/4864 | 301/18723 | 4.20e-25 | 1.10e-22 | 162 |
| GO:0006403111 | Skin | cSCC | RNA localization | 120/4864 | 201/18723 | 4.17e-24 | 1.01e-21 | 120 |
| GO:0051168111 | Skin | cSCC | nuclear export | 91/4864 | 154/18723 | 3.33e-18 | 4.18e-16 | 91 |
| GO:005065719 | Skin | cSCC | nucleic acid transport | 92/4864 | 163/18723 | 1.35e-16 | 1.33e-14 | 92 |
| GO:005065819 | Skin | cSCC | RNA transport | 92/4864 | 163/18723 | 1.35e-16 | 1.33e-14 | 92 |
| GO:005123619 | Skin | cSCC | establishment of RNA localization | 93/4864 | 166/18723 | 1.78e-16 | 1.69e-14 | 93 |
| GO:005102816 | Skin | cSCC | mRNA transport | 77/4864 | 130/18723 | 1.06e-15 | 8.95e-14 | 77 |
| GO:007116613 | Skin | cSCC | ribonucleoprotein complex localization | 49/4864 | 77/18723 | 3.94e-12 | 2.13e-10 | 49 |
| GO:001593119 | Skin | cSCC | nucleobase-containing compound transport | 105/4864 | 222/18723 | 5.49e-12 | 2.89e-10 | 105 |
| GO:007142613 | Skin | cSCC | ribonucleoprotein complex export from nucleus | 48/4864 | 76/18723 | 9.76e-12 | 4.97e-10 | 48 |
| Page: 1 2 3 4 5 6 7 8 9 10 11 |
| Pathway ID | Tissue | Disease Stage | Description | Gene Ratio | Bg Ratio | pvalue | p.adjust | qvalue | Count |
| Page: 1 |
Top |
Cell-cell communication analysis |
| Identification of potential cell-cell interactions between two cell types and their ligand-receptor pairs for different disease states |
| Ligand | Receptor | LRpair | Pathway | Tissue | Disease Stage |
| Page: 1 |
Top |
Single-cell gene regulatory network inference analysis |
| Find out the significant the regulons (TFs) and the target genes of each regulon across cell types for different disease states |
| TF | Cell Type | Tissue | Disease Stage | Target Gene | RSS | Regulon Activity |
| ∗The dot plots of a searched regulon are shown for all cell subpopulations in each disease state of each tissue based on the regulon specific score inferred using pySCENIC and by calculating the average expression. |
| Page: 1 |
Top |
Somatic mutation of malignant transformation related genes |
| Annotation of somatic variants for genes involved in malignant transformation |
| Hugo Symbol | Variant Class | Variant Classification | dbSNP RS | HGVSc | HGVSp | HGVSp Short | SWISSPROT | BIOTYPE | SIFT | PolyPhen | Tumor Sample Barcode | Tissue | Histology | Sex | Age | Stage | Therapy Types | Drugs | Outcome |
| CHTOP | SNV | Missense_Mutation | rs764039585 | c.605N>A | p.Arg202Gln | p.R202Q | Q9Y3Y2 | protein_coding | tolerated(0.35) | benign(0.116) | TCGA-EW-A1J5-01 | Breast | breast invasive carcinoma | Female | <65 | I/II | Chemotherapy | adriamycin | SD |
| CHTOP | deletion | Frame_Shift_Del | c.235delC | p.Arg79AlafsTer11 | p.R79Afs*11 | Q9Y3Y2 | protein_coding | TCGA-D8-A27V-01 | Breast | breast invasive carcinoma | Female | <65 | I/II | Hormone Therapy | tamoxiphen | SD | |||
| CHTOP | SNV | Missense_Mutation | c.323N>C | p.Ile108Thr | p.I108T | Q9Y3Y2 | protein_coding | tolerated(0.41) | benign(0.026) | TCGA-AA-3715-01 | Colorectum | colon adenocarcinoma | Male | >=65 | I/II | Unknown | Unknown | PD | |
| CHTOP | SNV | Missense_Mutation | rs746372648 | c.119C>T | p.Ser40Leu | p.S40L | Q9Y3Y2 | protein_coding | deleterious(0.01) | benign(0.063) | TCGA-AG-A002-01 | Colorectum | rectum adenocarcinoma | Male | <65 | I/II | Unknown | Unknown | SD |
| CHTOP | SNV | Missense_Mutation | novel | c.355C>T | p.Arg119Cys | p.R119C | Q9Y3Y2 | protein_coding | tolerated(0.07) | probably_damaging(0.942) | TCGA-A5-A1OF-01 | Endometrium | uterine corpus endometrioid carcinoma | Female | <65 | I/II | Unknown | Unknown | SD |
| CHTOP | SNV | Missense_Mutation | novel | c.64N>T | p.Arg22Cys | p.R22C | Q9Y3Y2 | protein_coding | deleterious(0.02) | possibly_damaging(0.616) | TCGA-AJ-A3EL-01 | Endometrium | uterine corpus endometrioid carcinoma | Female | <65 | I/II | Unknown | Unknown | SD |
| CHTOP | SNV | Missense_Mutation | novel | c.508N>T | p.Arg170Cys | p.R170C | Q9Y3Y2 | protein_coding | tolerated(0.15) | probably_damaging(0.942) | TCGA-AJ-A8CW-01 | Endometrium | uterine corpus endometrioid carcinoma | Female | <65 | I/II | Unknown | Unknown | SD |
| CHTOP | SNV | Missense_Mutation | c.225C>A | p.Ser75Arg | p.S75R | Q9Y3Y2 | protein_coding | deleterious(0.02) | probably_damaging(0.986) | TCGA-AP-A051-01 | Endometrium | uterine corpus endometrioid carcinoma | Female | >=65 | I/II | Unknown | Unknown | SD | |
| CHTOP | SNV | Missense_Mutation | c.700G>A | p.Ala234Thr | p.A234T | Q9Y3Y2 | protein_coding | deleterious(0) | probably_damaging(0.99) | TCGA-AP-A051-01 | Endometrium | uterine corpus endometrioid carcinoma | Female | >=65 | I/II | Unknown | Unknown | SD | |
| CHTOP | SNV | Missense_Mutation | novel | c.236N>A | p.Arg79His | p.R79H | Q9Y3Y2 | protein_coding | deleterious(0.01) | probably_damaging(0.991) | TCGA-AP-A1DV-01 | Endometrium | uterine corpus endometrioid carcinoma | Female | <65 | I/II | Unknown | Unknown | SD |
| Page: 1 2 3 |
Top |
Related drugs of malignant transformation related genes |
| Identification of chemicals and drugs interact with genes involved in malignant transfromation |
| (DGIdb 4.0) |
| Entrez ID | Symbol | Category | Interaction Types | Drug Claim Name | Drug Name | PMIDs |
| Page: 1 |

Copyright 2023-Present -The University of Texas Health Science Center at Houston |