
|
|||||
|
 | |
| |
| |
| |
| |
| |
|
Gene: CEBPA |
Gene summary for CEBPA |
| Gene information | Species | Human | Gene symbol | CEBPA | Gene ID | 1050 |
| Gene name | CCAAT enhancer binding protein alpha | |
| Gene Alias | C/EBP-alpha | |
| Cytomap | 19q13.11 | |
| Gene Type | protein-coding | GO ID | GO:0000003 | UniProtAcc | P49715 |
Top |
Malignant transformation analysis |
| Identification of the aberrant gene expression in precancerous and cancerous lesions by comparing the gene expression of stem-like cells in diseased tissues with normal stem cells |
| Entrez ID | Symbol | Replicates | Species | Organ | Tissue | Adj P-value | Log2FC | Malignancy |
| 1050 | CEBPA | LZE4T | Human | Esophagus | ESCC | 1.37e-02 | 5.32e-02 | 0.0811 |
| 1050 | CEBPA | LZE24T | Human | Esophagus | ESCC | 2.83e-07 | 9.25e-02 | 0.0596 |
| 1050 | CEBPA | LZE21T | Human | Esophagus | ESCC | 1.94e-03 | 1.47e-01 | 0.0655 |
| 1050 | CEBPA | P1T-E | Human | Esophagus | ESCC | 3.11e-06 | 5.20e-01 | 0.0875 |
| 1050 | CEBPA | P2T-E | Human | Esophagus | ESCC | 2.41e-14 | 2.09e-01 | 0.1177 |
| 1050 | CEBPA | P4T-E | Human | Esophagus | ESCC | 9.29e-07 | 1.48e-01 | 0.1323 |
| 1050 | CEBPA | P5T-E | Human | Esophagus | ESCC | 4.62e-02 | 3.08e-02 | 0.1327 |
| 1050 | CEBPA | P8T-E | Human | Esophagus | ESCC | 4.63e-16 | 1.82e-01 | 0.0889 |
| 1050 | CEBPA | P9T-E | Human | Esophagus | ESCC | 1.92e-13 | 3.61e-01 | 0.1131 |
| 1050 | CEBPA | P10T-E | Human | Esophagus | ESCC | 2.90e-19 | 3.66e-01 | 0.116 |
| 1050 | CEBPA | P11T-E | Human | Esophagus | ESCC | 1.82e-09 | 2.16e-01 | 0.1426 |
| 1050 | CEBPA | P12T-E | Human | Esophagus | ESCC | 1.58e-17 | 3.30e-01 | 0.1122 |
| 1050 | CEBPA | P15T-E | Human | Esophagus | ESCC | 4.95e-21 | 5.47e-01 | 0.1149 |
| 1050 | CEBPA | P16T-E | Human | Esophagus | ESCC | 4.76e-04 | 5.12e-02 | 0.1153 |
| 1050 | CEBPA | P20T-E | Human | Esophagus | ESCC | 6.65e-08 | 1.23e-01 | 0.1124 |
| 1050 | CEBPA | P22T-E | Human | Esophagus | ESCC | 1.12e-18 | 2.37e-01 | 0.1236 |
| 1050 | CEBPA | P23T-E | Human | Esophagus | ESCC | 9.10e-14 | 2.34e-01 | 0.108 |
| 1050 | CEBPA | P26T-E | Human | Esophagus | ESCC | 2.70e-14 | 1.38e-01 | 0.1276 |
| 1050 | CEBPA | P27T-E | Human | Esophagus | ESCC | 2.04e-02 | 7.49e-02 | 0.1055 |
| 1050 | CEBPA | P28T-E | Human | Esophagus | ESCC | 2.84e-12 | 2.53e-01 | 0.1149 |
| Page: 1 2 3 4 |
| Tissue | Expression Dynamics | Abbreviation |
| Esophagus | 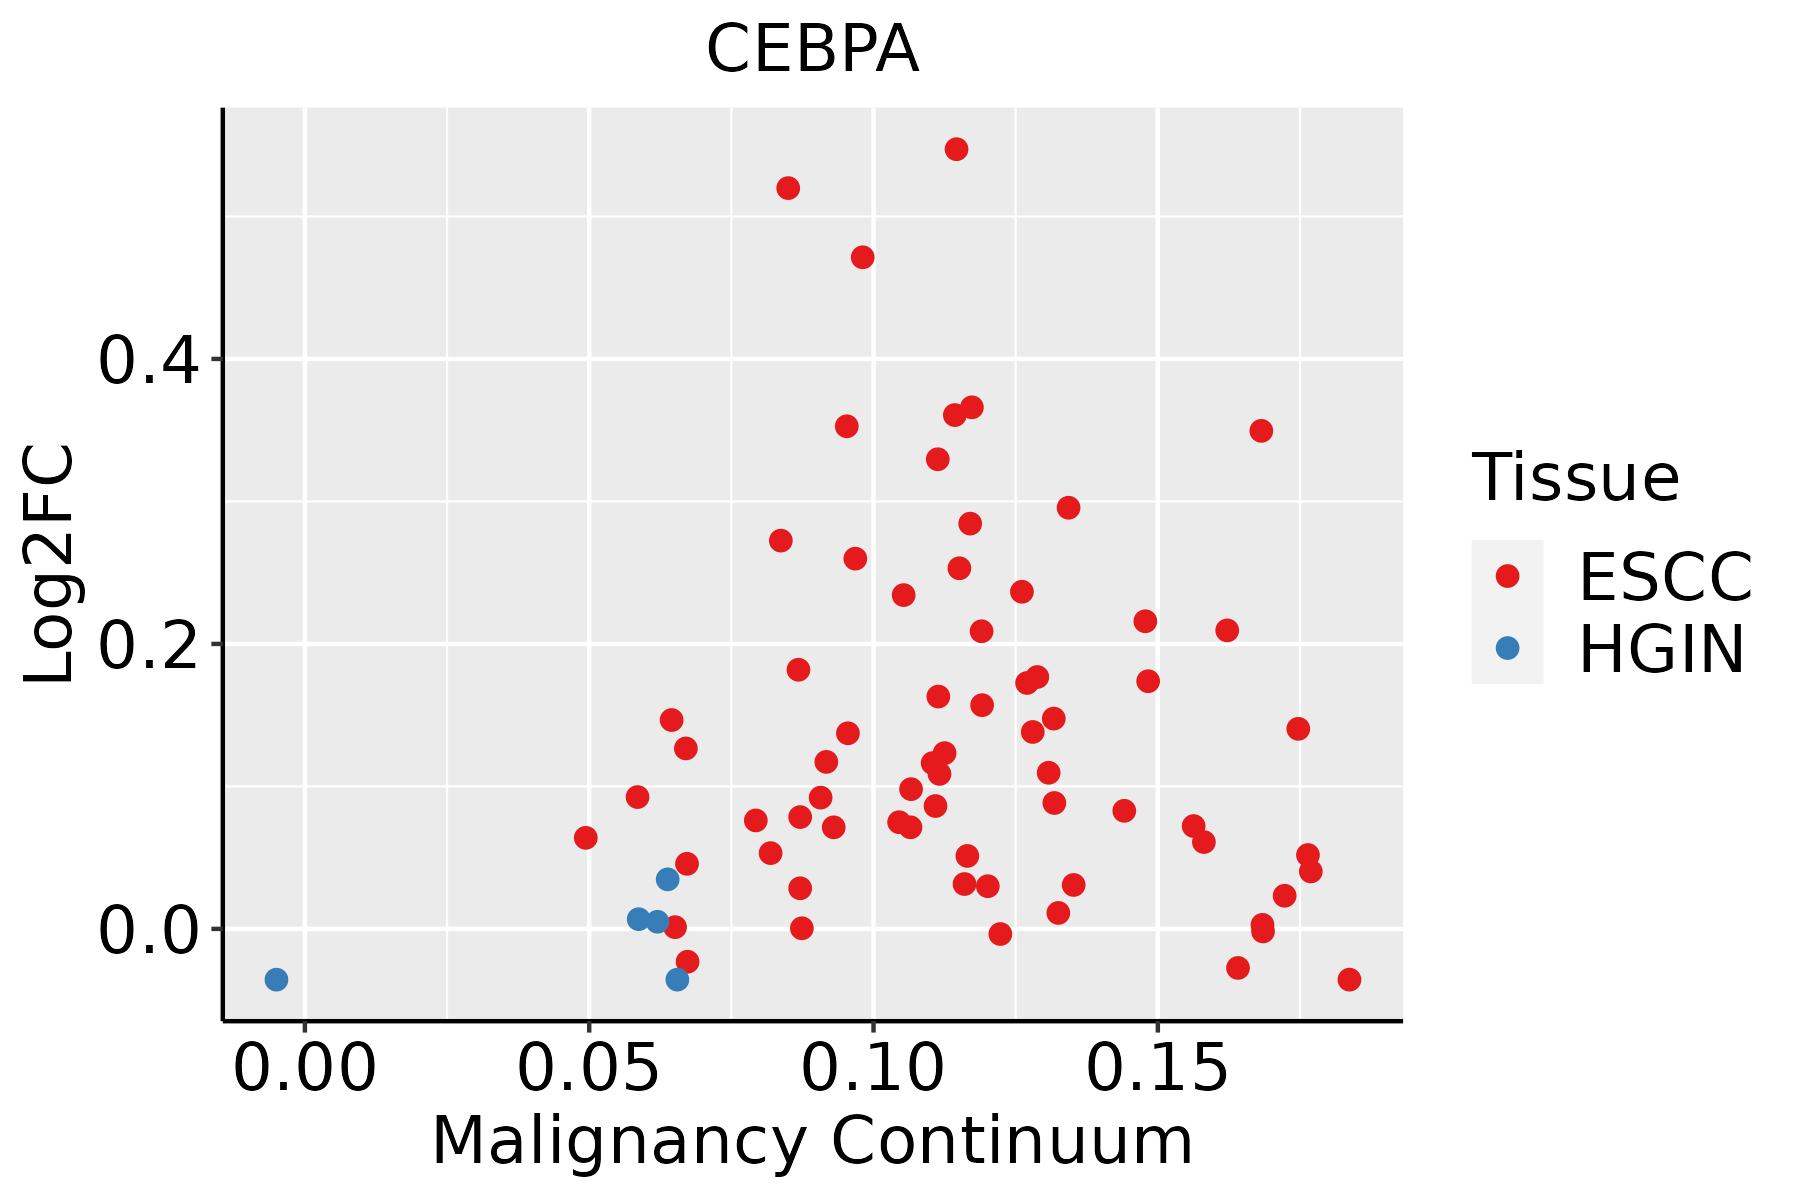 | ESCC: Esophageal squamous cell carcinoma |
| HGIN: High-grade intraepithelial neoplasias | ||
| LGIN: Low-grade intraepithelial neoplasias | ||
| Liver | 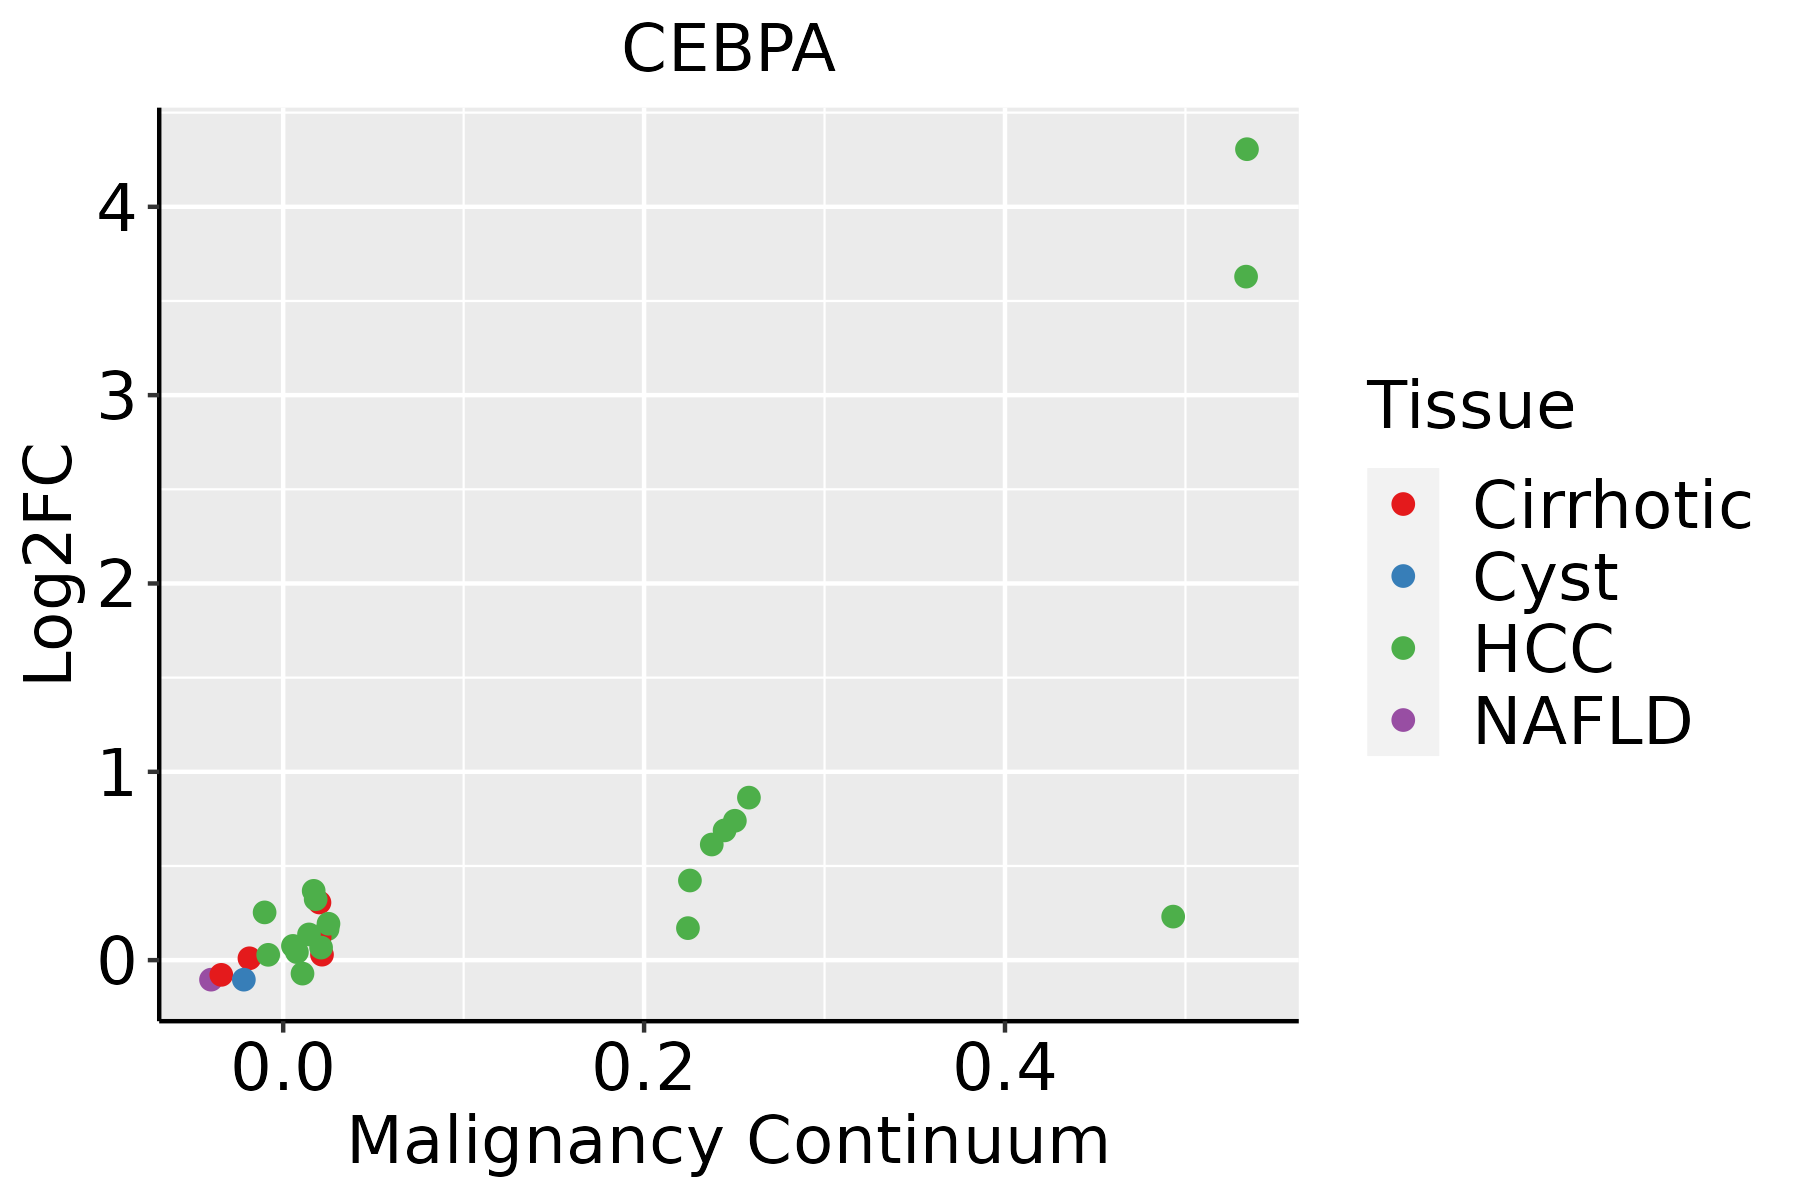 | HCC: Hepatocellular carcinoma |
| NAFLD: Non-alcoholic fatty liver disease | ||
| Oral Cavity | 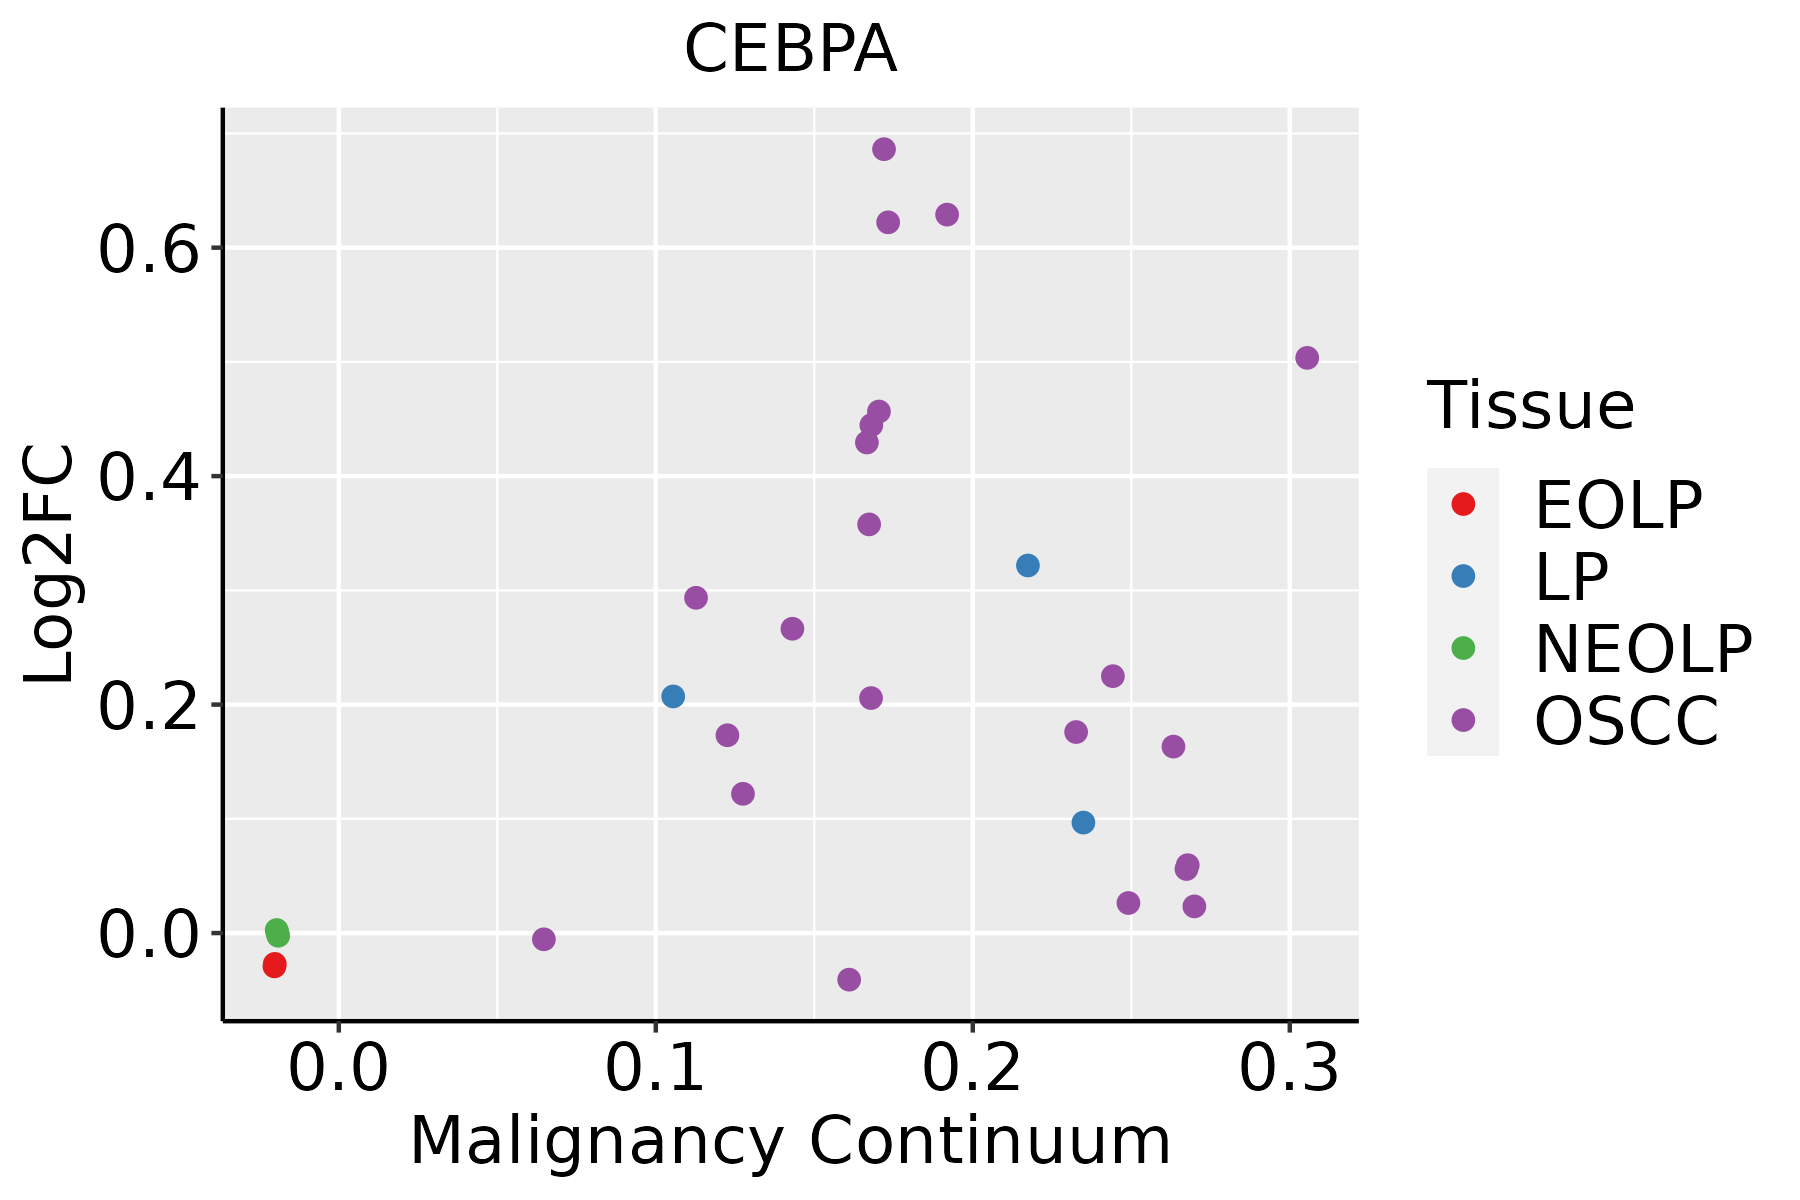 | EOLP: Erosive Oral lichen planus |
| LP: leukoplakia | ||
| NEOLP: Non-erosive oral lichen planus | ||
| OSCC: Oral squamous cell carcinoma | ||
| Skin | 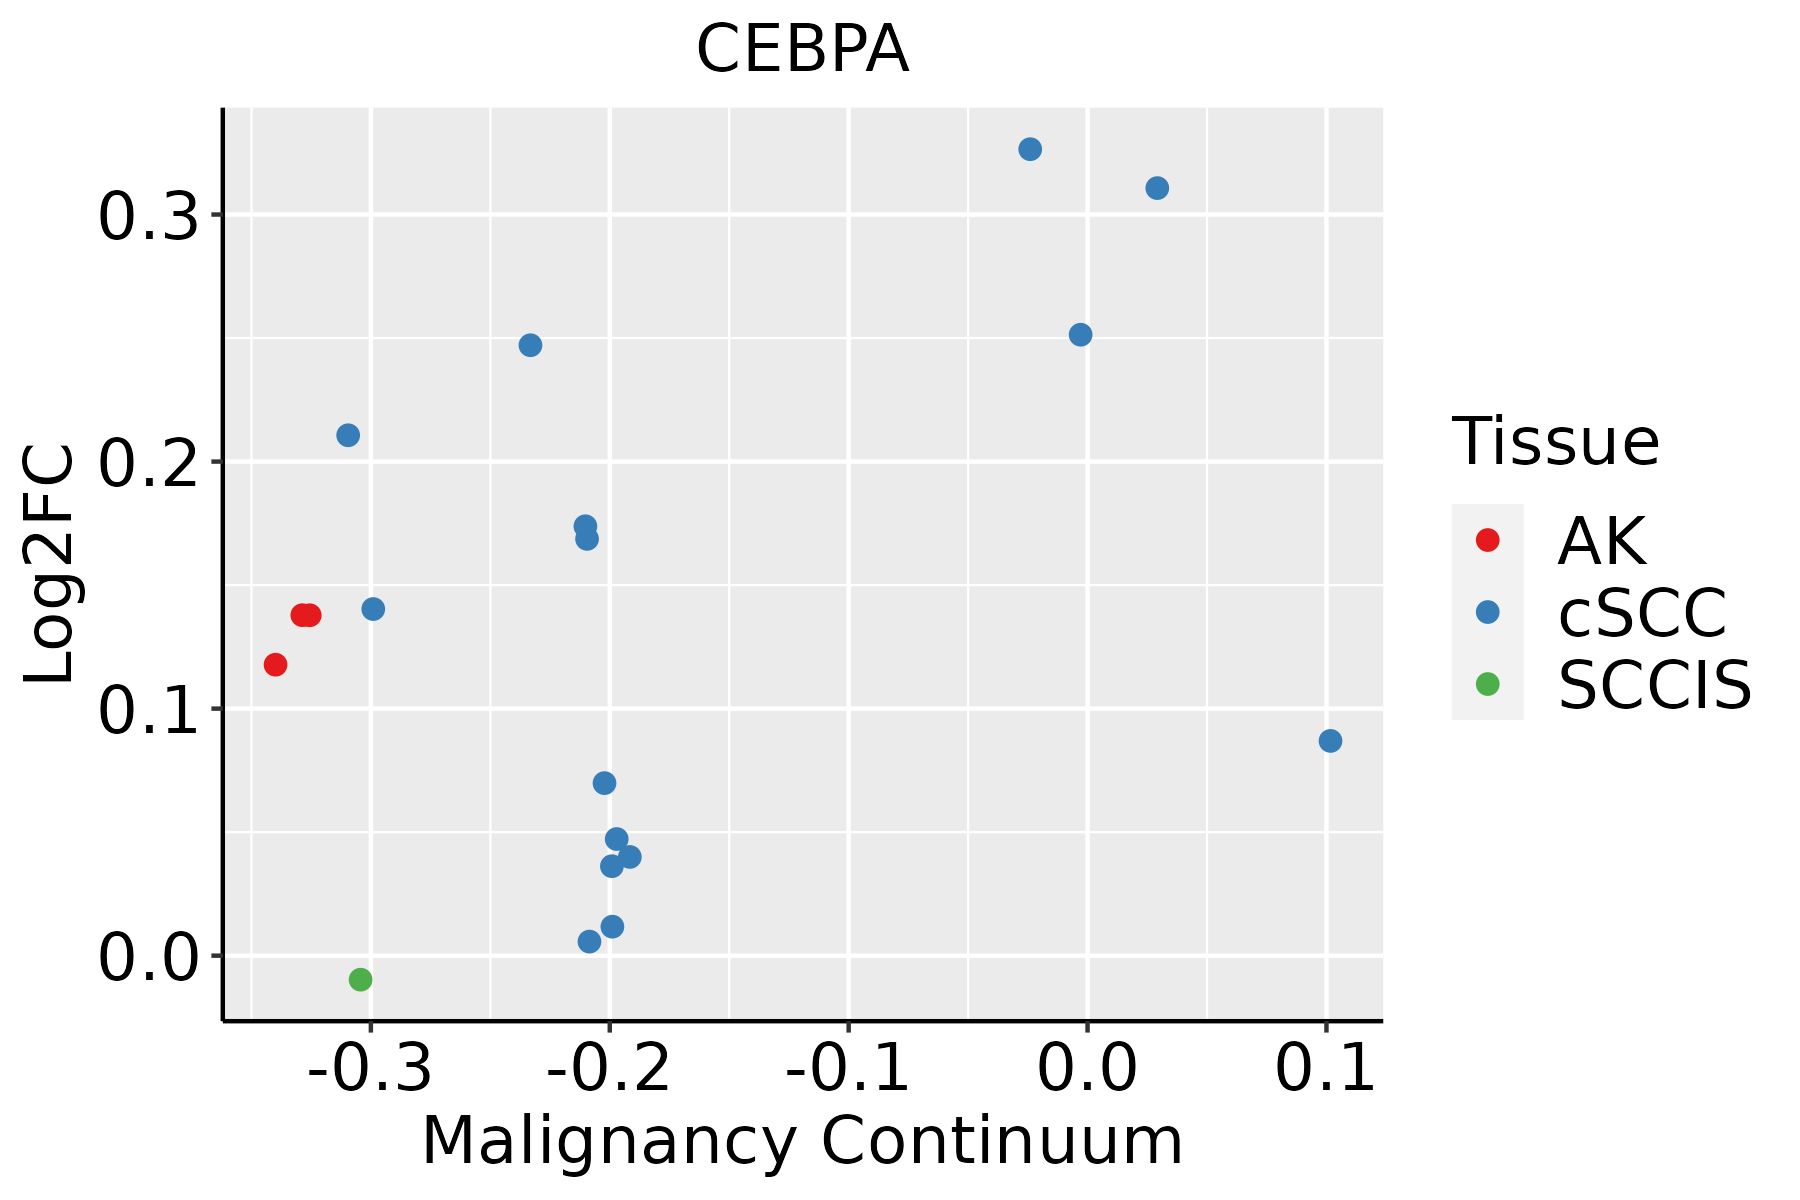 | AK: Actinic keratosis |
| cSCC: Cutaneous squamous cell carcinoma | ||
| SCCIS:squamous cell carcinoma in situ |
| ∗log2FC in expression of this searched gene in stem-like cells from each diseased tissue sample relative to stem-like cells in normal samples in each tissue plotted against the malignancy continuum. Samples are colored based on if they are from different disease stage. |
Top |
Malignant transformation related pathway analysis |
| Find out the enriched GO biological processes and KEGG pathways involved in transition from healthy to precancer to cancer |
| Tissue | Disease Stage | Enriched GO biological Processes |
| Colorectum | AD |  |
| Colorectum | SER |  |
| Colorectum | MSS |  |
| Colorectum | MSI-H |  |
| Colorectum | FAP |  |
| ∗Top 15 enriched GO BP terms are showed in the bar plot of each disease state in each tissue. Each row represents a significant GO biological process which is colored according to the -log10(p.adjust). |
| Page: 1 2 3 4 5 6 7 8 9 |
| GO ID | Tissue | Disease Stage | Description | Gene Ratio | Bg Ratio | pvalue | p.adjust | Count |
| GO:007190011 | Liver | Cirrhotic | regulation of protein serine/threonine kinase activity | 110/4634 | 359/18723 | 6.19e-03 | 3.08e-02 | 110 |
| GO:00454442 | Liver | Cirrhotic | fat cell differentiation | 73/4634 | 229/18723 | 8.57e-03 | 3.97e-02 | 73 |
| GO:00064697 | Liver | Cirrhotic | negative regulation of protein kinase activity | 68/4634 | 212/18723 | 9.35e-03 | 4.29e-02 | 68 |
| GO:001049822 | Liver | HCC | proteasomal protein catabolic process | 351/7958 | 490/18723 | 6.92e-40 | 1.46e-36 | 351 |
| GO:004316122 | Liver | HCC | proteasome-mediated ubiquitin-dependent protein catabolic process | 299/7958 | 412/18723 | 7.82e-36 | 8.27e-33 | 299 |
| GO:000609122 | Liver | HCC | generation of precursor metabolites and energy | 340/7958 | 490/18723 | 4.04e-34 | 2.85e-31 | 340 |
| GO:000989622 | Liver | HCC | positive regulation of catabolic process | 335/7958 | 492/18723 | 3.83e-31 | 1.87e-28 | 335 |
| GO:003133122 | Liver | HCC | positive regulation of cellular catabolic process | 295/7958 | 427/18723 | 3.20e-29 | 1.45e-26 | 295 |
| GO:004217622 | Liver | HCC | regulation of protein catabolic process | 267/7958 | 391/18723 | 2.45e-25 | 7.38e-23 | 267 |
| GO:190336222 | Liver | HCC | regulation of cellular protein catabolic process | 182/7958 | 255/18723 | 5.91e-21 | 8.52e-19 | 182 |
| GO:004573222 | Liver | HCC | positive regulation of protein catabolic process | 163/7958 | 231/18723 | 4.00e-18 | 4.69e-16 | 163 |
| GO:190305022 | Liver | HCC | regulation of proteolysis involved in cellular protein catabolic process | 157/7958 | 221/18723 | 5.93e-18 | 6.83e-16 | 157 |
| GO:006113622 | Liver | HCC | regulation of proteasomal protein catabolic process | 134/7958 | 187/18723 | 5.03e-16 | 4.09e-14 | 134 |
| GO:190336422 | Liver | HCC | positive regulation of cellular protein catabolic process | 115/7958 | 155/18723 | 9.30e-16 | 7.19e-14 | 115 |
| GO:200005822 | Liver | HCC | regulation of ubiquitin-dependent protein catabolic process | 120/7958 | 164/18723 | 1.31e-15 | 9.74e-14 | 120 |
| GO:004586222 | Liver | HCC | positive regulation of proteolysis | 232/7958 | 372/18723 | 5.66e-15 | 3.98e-13 | 232 |
| GO:000188922 | Liver | HCC | liver development | 108/7958 | 147/18723 | 2.16e-14 | 1.41e-12 | 108 |
| GO:003243422 | Liver | HCC | regulation of proteasomal ubiquitin-dependent protein catabolic process | 100/7958 | 134/18723 | 3.67e-14 | 2.32e-12 | 100 |
| GO:006100822 | Liver | HCC | hepaticobiliary system development | 109/7958 | 150/18723 | 5.72e-14 | 3.42e-12 | 109 |
| GO:190305221 | Liver | HCC | positive regulation of proteolysis involved in cellular protein catabolic process | 96/7958 | 133/18723 | 3.47e-12 | 1.57e-10 | 96 |
| Page: 1 2 3 4 5 6 7 8 9 10 11 12 13 14 15 |
| Pathway ID | Tissue | Disease Stage | Description | Gene Ratio | Bg Ratio | pvalue | p.adjust | qvalue | Count |
| hsa04932210 | Esophagus | ESCC | Non-alcoholic fatty liver disease | 122/4205 | 155/8465 | 5.69e-14 | 1.59e-12 | 8.14e-13 | 122 |
| hsa052215 | Esophagus | ESCC | Acute myeloid leukemia | 49/4205 | 67/8465 | 7.43e-05 | 3.07e-04 | 1.57e-04 | 49 |
| hsa052028 | Esophagus | ESCC | Transcriptional misregulation in cancer | 116/4205 | 193/8465 | 2.08e-03 | 5.95e-03 | 3.05e-03 | 116 |
| hsa0493238 | Esophagus | ESCC | Non-alcoholic fatty liver disease | 122/4205 | 155/8465 | 5.69e-14 | 1.59e-12 | 8.14e-13 | 122 |
| hsa0522113 | Esophagus | ESCC | Acute myeloid leukemia | 49/4205 | 67/8465 | 7.43e-05 | 3.07e-04 | 1.57e-04 | 49 |
| hsa0520213 | Esophagus | ESCC | Transcriptional misregulation in cancer | 116/4205 | 193/8465 | 2.08e-03 | 5.95e-03 | 3.05e-03 | 116 |
| hsa0493222 | Liver | Cirrhotic | Non-alcoholic fatty liver disease | 106/2530 | 155/8465 | 2.16e-23 | 2.40e-21 | 1.48e-21 | 106 |
| hsa0493232 | Liver | Cirrhotic | Non-alcoholic fatty liver disease | 106/2530 | 155/8465 | 2.16e-23 | 2.40e-21 | 1.48e-21 | 106 |
| hsa0493242 | Liver | HCC | Non-alcoholic fatty liver disease | 124/4020 | 155/8465 | 4.54e-17 | 2.54e-15 | 1.41e-15 | 124 |
| hsa05221 | Liver | HCC | Acute myeloid leukemia | 41/4020 | 67/8465 | 1.64e-02 | 3.90e-02 | 2.17e-02 | 41 |
| hsa0493252 | Liver | HCC | Non-alcoholic fatty liver disease | 124/4020 | 155/8465 | 4.54e-17 | 2.54e-15 | 1.41e-15 | 124 |
| hsa052211 | Liver | HCC | Acute myeloid leukemia | 41/4020 | 67/8465 | 1.64e-02 | 3.90e-02 | 2.17e-02 | 41 |
| hsa0493228 | Oral cavity | OSCC | Non-alcoholic fatty liver disease | 124/3704 | 155/8465 | 1.22e-20 | 1.37e-18 | 6.96e-19 | 124 |
| hsa052214 | Oral cavity | OSCC | Acute myeloid leukemia | 42/3704 | 67/8465 | 1.34e-03 | 3.75e-03 | 1.91e-03 | 42 |
| hsa04932112 | Oral cavity | OSCC | Non-alcoholic fatty liver disease | 124/3704 | 155/8465 | 1.22e-20 | 1.37e-18 | 6.96e-19 | 124 |
| hsa0522112 | Oral cavity | OSCC | Acute myeloid leukemia | 42/3704 | 67/8465 | 1.34e-03 | 3.75e-03 | 1.91e-03 | 42 |
| Page: 1 |
Top |
Cell-cell communication analysis |
| Identification of potential cell-cell interactions between two cell types and their ligand-receptor pairs for different disease states |
| Ligand | Receptor | LRpair | Pathway | Tissue | Disease Stage |
| Page: 1 |
Top |
Single-cell gene regulatory network inference analysis |
| Find out the significant the regulons (TFs) and the target genes of each regulon across cell types for different disease states |
| TF | Cell Type | Tissue | Disease Stage | Target Gene | RSS | Regulon Activity |
| CEBPA | M2MAC | Endometrium | ADJ | PSAP,GYG1,TREM2, etc. | 2.66e-01 |  |
| CEBPA | INMON | Endometrium | ADJ | PSAP,GYG1,TREM2, etc. | 7.69e-02 | |
| CEBPA | M2MAC | Endometrium | AEH | PSAP,GYG1,TREM2, etc. | 2.79e-01 |  |
| CEBPA | INMON | Endometrium | AEH | PSAP,GYG1,TREM2, etc. | 6.26e-02 | |
| CEBPA | M2MAC | Endometrium | EEC | PSAP,GYG1,TREM2, etc. | 3.49e-01 |  |
| CEBPA | INMON | Endometrium | EEC | PSAP,GYG1,TREM2, etc. | 5.59e-02 | |
| CEBPA | M2MAC | Endometrium | Healthy | PSAP,GYG1,TREM2, etc. | 4.51e-01 |  |
| CEBPA | INMON | Endometrium | Healthy | PSAP,GYG1,TREM2, etc. | 6.97e-02 | |
| CEBPA | HEP | Liver | HCC | SNORA76,FSTL5,FAM115A, etc. | 8.20e-01 |  |
| CEBPA | M2MAC | Lung | MIAC | AC124016.1,PSAP,CTSD, etc. | 3.25e-01 |  |
| ∗The dot plots of a searched regulon are shown for all cell subpopulations in each disease state of each tissue based on the regulon specific score inferred using pySCENIC and by calculating the average expression. |
| Page: 1 2 3 |
Top |
Somatic mutation of malignant transformation related genes |
| Annotation of somatic variants for genes involved in malignant transformation |
| Hugo Symbol | Variant Class | Variant Classification | dbSNP RS | HGVSc | HGVSp | HGVSp Short | SWISSPROT | BIOTYPE | SIFT | PolyPhen | Tumor Sample Barcode | Tissue | Histology | Sex | Age | Stage | Therapy Types | Drugs | Outcome |
| CEBPA | SNV | Missense_Mutation | rs780335632 | c.803N>T | p.Gly268Val | p.G268V | P49715 | protein_coding | tolerated(0.09) | benign(0.001) | TCGA-C5-A3HL-01 | Cervix | cervical & endocervical cancer | Female | >=65 | I/II | Unknown | Unknown | SD |
| CEBPA | SNV | Missense_Mutation | c.840N>C | p.Lys280Asn | p.K280N | P49715 | protein_coding | deleterious(0) | probably_damaging(0.92) | TCGA-DR-A0ZM-01 | Cervix | cervical & endocervical cancer | Female | <65 | III/IV | Unspecific | Cisplatin | SD | |
| CEBPA | SNV | Missense_Mutation | c.1015C>T | p.Arg339Trp | p.R339W | P49715 | protein_coding | deleterious(0) | probably_damaging(0.997) | TCGA-JW-A5VL-01 | Cervix | cervical & endocervical cancer | Female | <65 | I/II | Unknown | Unknown | SD | |
| CEBPA | SNV | Missense_Mutation | c.947A>C | p.Glu316Ala | p.E316A | P49715 | protein_coding | deleterious(0) | probably_damaging(0.998) | TCGA-AA-3663-01 | Colorectum | colon adenocarcinoma | Male | <65 | I/II | Unknown | Unknown | SD | |
| CEBPA | SNV | Missense_Mutation | novel | c.955A>G | p.Ser319Gly | p.S319G | P49715 | protein_coding | tolerated(0.05) | benign(0.171) | TCGA-AA-A01P-01 | Colorectum | colon adenocarcinoma | Female | >=65 | III/IV | Unknown | Unknown | PD |
| CEBPA | SNV | Missense_Mutation | c.1073N>T | p.Ala358Val | p.A358V | P49715 | protein_coding | deleterious(0.01) | possibly_damaging(0.788) | TCGA-EC-A1QX-01 | Endometrium | uterine corpus endometrioid carcinoma | Female | >=65 | I/II | Chemotherapy | cyclophosphamide | PD | |
| CEBPA | SNV | Missense_Mutation | c.866N>A | p.Arg289His | p.R289H | P49715 | protein_coding | deleterious(0) | probably_damaging(0.999) | TCGA-VQ-A8PP-01 | Stomach | stomach adenocarcinoma | Male | >=65 | III/IV | Chemotherapy | fluorouracil | PD | |
| CEBPA | SNV | Missense_Mutation | novel | c.869N>T | p.Glu290Val | p.E290V | P49715 | protein_coding | deleterious(0) | probably_damaging(0.993) | TCGA-VQ-A91K-01 | Stomach | stomach adenocarcinoma | Male | >=65 | III/IV | Chemotherapy | fluorouracil | CR |
| Page: 1 |
Top |
Related drugs of malignant transformation related genes |
| Identification of chemicals and drugs interact with genes involved in malignant transfromation |
| (DGIdb 4.0) |
| Entrez ID | Symbol | Category | Interaction Types | Drug Claim Name | Drug Name | PMIDs |
| 1050 | CEBPA | TRANSCRIPTION FACTOR COMPLEX, TRANSCRIPTION FACTOR, CLINICALLY ACTIONABLE | OICR-9429 | 26167872 | ||
| 1050 | CEBPA | TRANSCRIPTION FACTOR COMPLEX, TRANSCRIPTION FACTOR, CLINICALLY ACTIONABLE | N/A | 20038735,26601784,19171880,22814295,25241285,23521373 |
| Page: 1 |

Copyright 2023-Present -The University of Texas Health Science Center at Houston |