Schematic overview of the cellular and molecular mechanisms involved in the cancer progression, including the proposed cellular and molecular mechanisms in cancer cells trajectory. AT1: alveolar type 1 cells; AT2: alveolar type 2 cells; AAH: atypical adenomatous hyperplasia; AIS: adenocarcinoma in situ; MIA: minimally invasive adenocarcinoma; IA: invasive adenocarcinoma; EMT: epithelial-mesenchymal transition

Home

Download

Statistics

Help

Contact

Center for Computational Systems Medicine
leaf

Gene summary

leaf

Malignant transformation analysis

leaf

Malignant transformation related pathway analysis

leaf

Cell-cell communication analysis

leaf

Single-cell gene regulatory network inference analysis

leaf

Somatic mutation of malignant transformation related genes

leaf

Related drugs of malignant transformation related genes

Gene: CD109

Gene summary for CD109

check button Gene summary.

Gene informationSpeciesHuman
Gene symbol

CD109

Gene ID

135228

Gene nameCD109 molecule
Gene AliasCPAMD7
Cytomap6q13
Gene Typeprotein-coding
GO ID

GO:0000768

UniProtAcc

Q6YHK3


Top

Malignant transformation analysis

check button Identification of the aberrant gene expression in precancerous and cancerous lesions by comparing the gene expression of stem-like cells in diseased tissues with normal stem cells
check button Malignant transformation involving gene list.
Entrez IDSymbolReplicatesSpeciesOrganTissueAdj P-valueLog2FCMalignancy
135228CD109CA_HPV_2HumanCervixCC8.22e-042.97e-010.0391
135228CD109CCI_1HumanCervixCC3.11e-121.47e+000.528
135228CD109TumorHumanCervixCC2.04e-022.21e-010.1241
135228CD109sample3HumanCervixCC2.49e-032.62e-010.1387
135228CD109H2HumanCervixHSIL_HPV4.09e-05-1.66e-010.0632
135228CD109T3HumanCervixCC4.56e-072.35e-010.1389
135228CD109LZE2THumanEsophagusESCC1.40e-023.36e-010.082
135228CD109LZE4THumanEsophagusESCC1.57e-163.99e-010.0811
135228CD109LZE24THumanEsophagusESCC3.88e-04-4.32e-020.0596
135228CD109LZE6THumanEsophagusESCC5.42e-03-3.94e-020.0845
135228CD109P2T-EHumanEsophagusESCC7.05e-132.04e-010.1177
135228CD109P4T-EHumanEsophagusESCC1.90e-176.25e-010.1323
135228CD109P5T-EHumanEsophagusESCC4.03e-265.18e-010.1327
135228CD109P8T-EHumanEsophagusESCC5.98e-061.85e-010.0889
135228CD109P9T-EHumanEsophagusESCC2.47e-092.68e-010.1131
135228CD109P10T-EHumanEsophagusESCC2.54e-163.07e-010.116
135228CD109P11T-EHumanEsophagusESCC1.85e-066.39e-010.1426
135228CD109P12T-EHumanEsophagusESCC2.55e-225.43e-010.1122
135228CD109P15T-EHumanEsophagusESCC2.39e-176.11e-010.1149
135228CD109P16T-EHumanEsophagusESCC1.46e-043.26e-040.1153
Page: 1 2 3 4 5 6 

check button Transcriptomic changes along malignancy continuum.
TissueExpression DynamicsAbbreviation
CervixThe image shows the transcriptomic changes along malignancy continuum.log2FC in expression of this searched gene in stem-like cells from each diseased tissue sample relative to stem-like cells in normal samples in each tissue plotted against the malignancy continuum. Samples are colored based on if they are from different disease stage.CC: Cervix cancer
HSIL_HPV: HPV-infected high-grade squamous intraepithelial lesions
N_HPV: HPV-infected normal cervix
EsophagusThe image shows the transcriptomic changes along malignancy continuum.log2FC in expression of this searched gene in stem-like cells from each diseased tissue sample relative to stem-like cells in normal samples in each tissue plotted against the malignancy continuum. Samples are colored based on if they are from different disease stage.
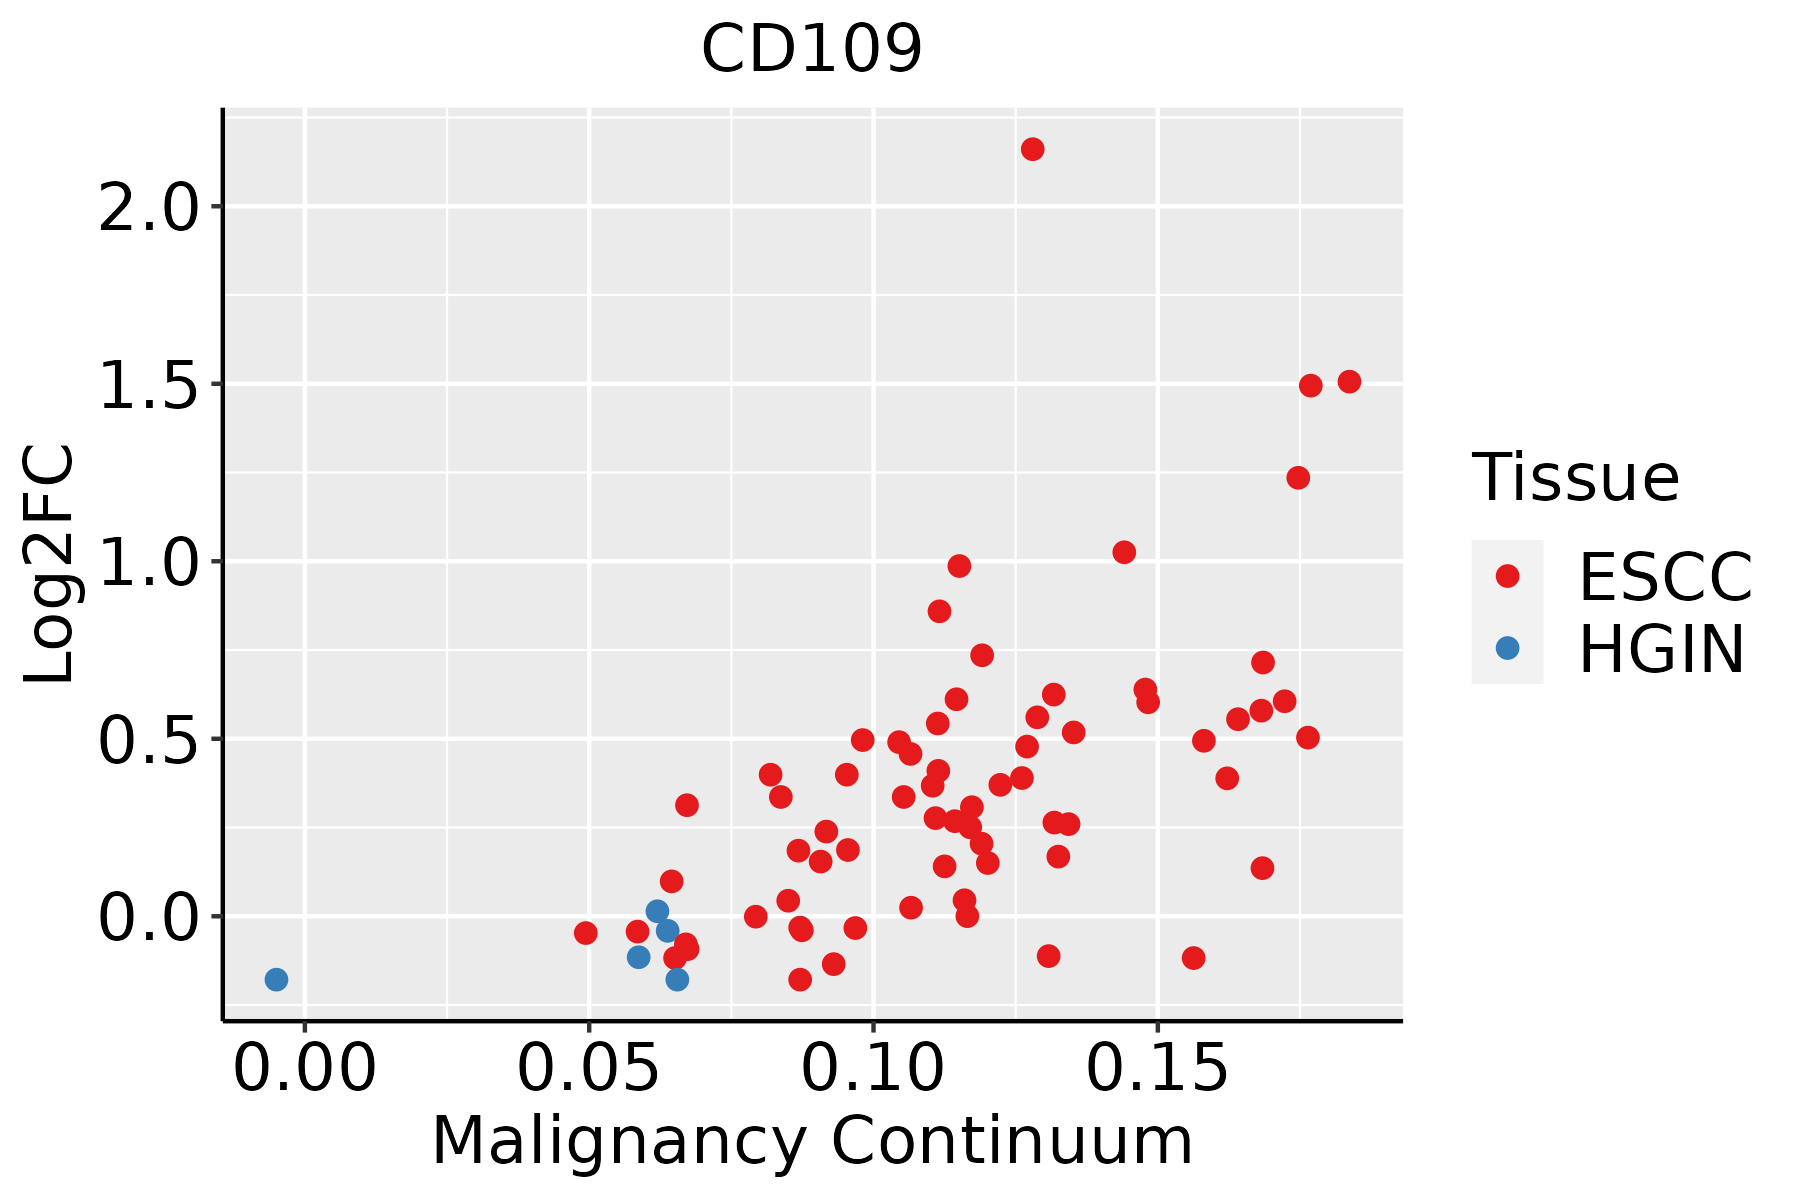
ESCC: Esophageal squamous cell carcinoma
HGIN: High-grade intraepithelial neoplasias
LGIN: Low-grade intraepithelial neoplasias
LiverThe image shows the transcriptomic changes along malignancy continuum.log2FC in expression of this searched gene in stem-like cells from each diseased tissue sample relative to stem-like cells in normal samples in each tissue plotted against the malignancy continuum. Samples are colored based on if they are from different disease stage.HCC: Hepatocellular carcinoma
NAFLD: Non-alcoholic fatty liver disease
Oral CavityThe image shows the transcriptomic changes along malignancy continuum.log2FC in expression of this searched gene in stem-like cells from each diseased tissue sample relative to stem-like cells in normal samples in each tissue plotted against the malignancy continuum. Samples are colored based on if they are from different disease stage.EOLP: Erosive Oral lichen planus
LP: leukoplakia
NEOLP: Non-erosive oral lichen planus
OSCC: Oral squamous cell carcinoma
SkinThe image shows the transcriptomic changes along malignancy continuum.log2FC in expression of this searched gene in stem-like cells from each diseased tissue sample relative to stem-like cells in normal samples in each tissue plotted against the malignancy continuum. Samples are colored based on if they are from different disease stage.AK: Actinic keratosis
cSCC: Cutaneous squamous cell carcinoma
SCCIS:squamous cell carcinoma in situ
ThyroidThe image shows the transcriptomic changes along malignancy continuum.log2FC in expression of this searched gene in stem-like cells from each diseased tissue sample relative to stem-like cells in normal samples in each tissue plotted against the malignancy continuum. Samples are colored based on if they are from different disease stage.
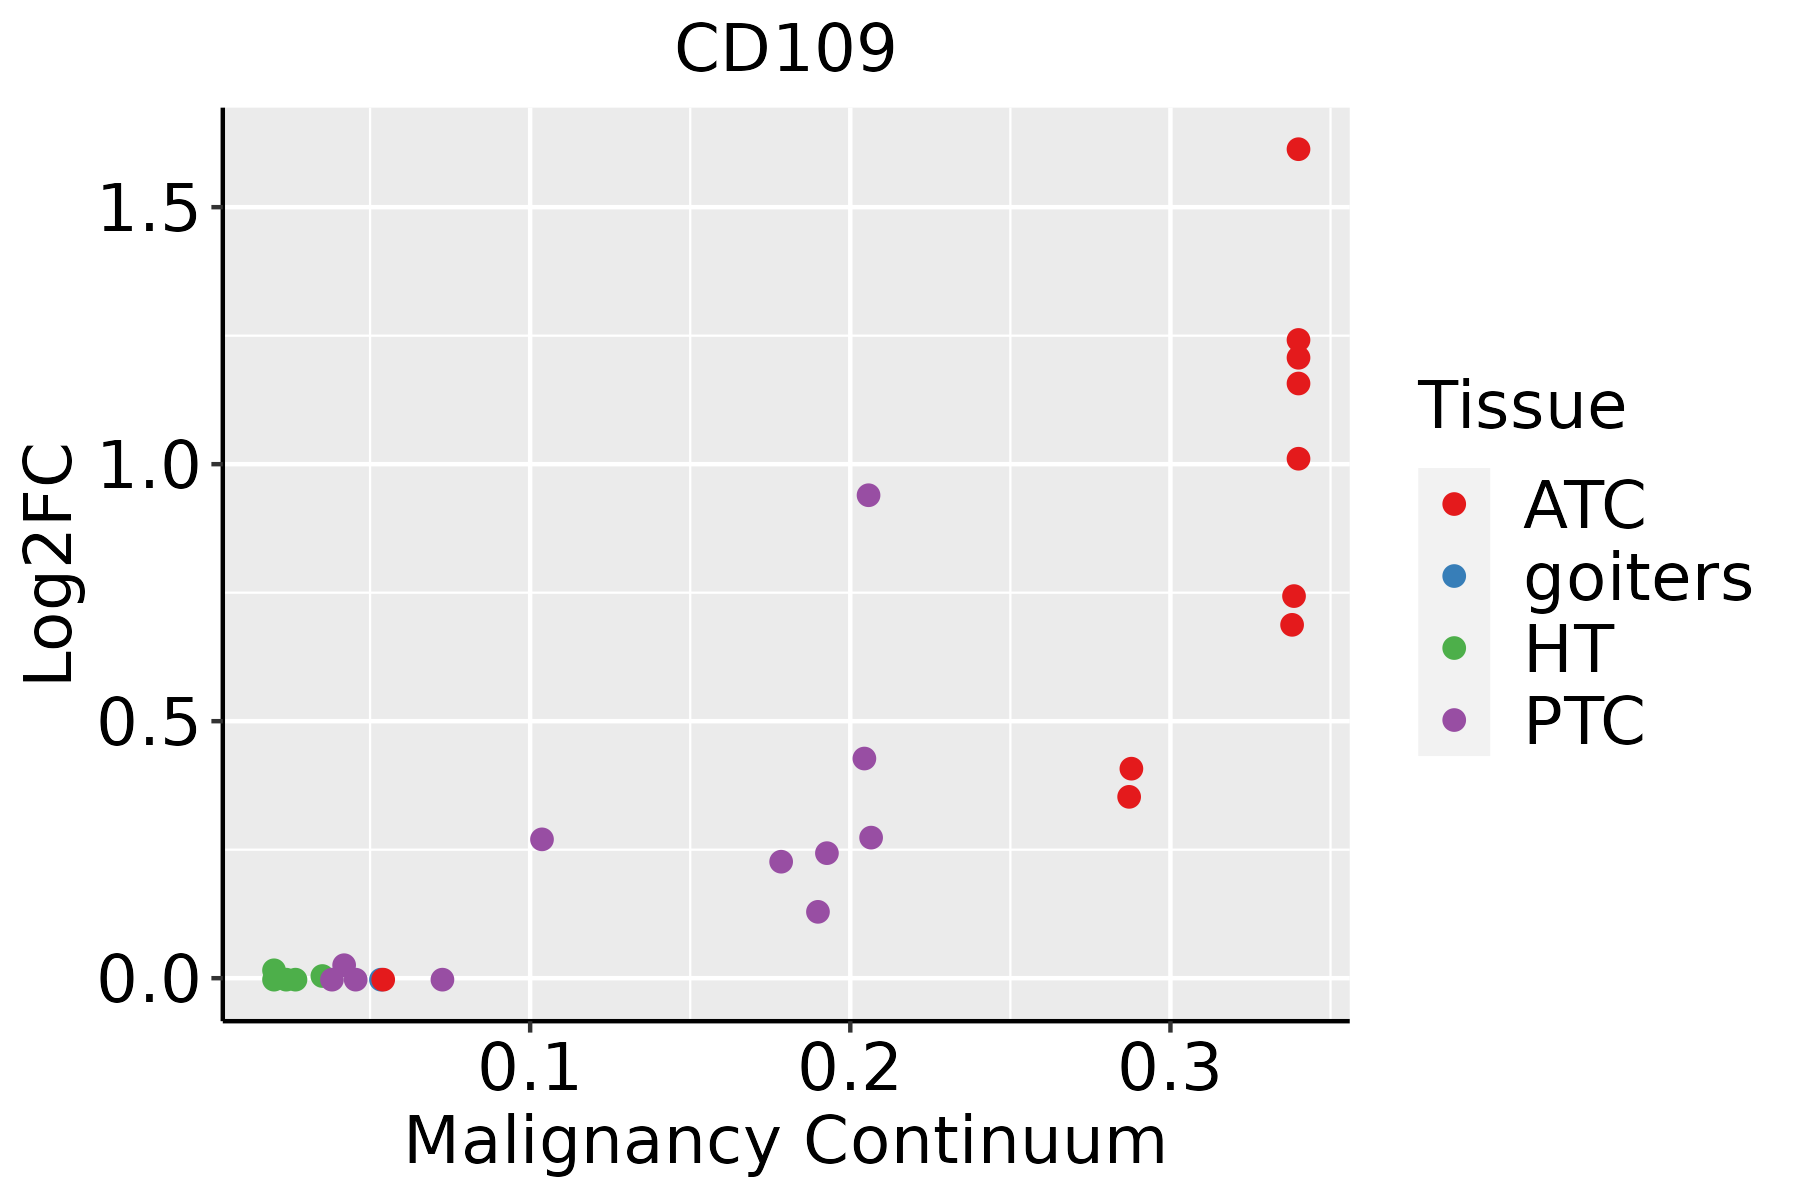
ATC: Anaplastic thyroid cancer
HT: Hashimoto's thyroiditis
PTC: Papillary thyroid cancer
∗log2FC in expression of this searched gene in stem-like cells from each diseased tissue sample relative to stem-like cells in normal samples in each tissue plotted against the malignancy continuum. Samples are colored based on if they are from different disease stage.

Top

Malignant transformation related pathway analysis

check buttonFind out the enriched GO biological processes and KEGG pathways involved in transition from healthy to precancer to cancer
check button Figure of enriched GO biological processes.
TissueDisease StageEnriched GO biological Processes
ColorectumADGO analysis - Figure of enriched GO biological processes: Top 15 enriched GO BP terms are showed in the bar plot of each disease state in each tissue. Each row represents a significant GO biological process which is colored according to the -log10(p.adjust).
ColorectumSERGO analysis - Figure of enriched GO biological processes: Top 15 enriched GO BP terms are showed in the bar plot of each disease state in each tissue. Each row represents a significant GO biological process which is colored according to the -log10(p.adjust).
ColorectumMSSGO analysis - Figure of enriched GO biological processes: Top 15 enriched GO BP terms are showed in the bar plot of each disease state in each tissue. Each row represents a significant GO biological process which is colored according to the -log10(p.adjust).
ColorectumMSI-HGO analysis - Figure of enriched GO biological processes: Top 15 enriched GO BP terms are showed in the bar plot of each disease state in each tissue. Each row represents a significant GO biological process which is colored according to the -log10(p.adjust).
ColorectumFAPGO analysis - Figure of enriched GO biological processes: Top 15 enriched GO BP terms are showed in the bar plot of each disease state in each tissue. Each row represents a significant GO biological process which is colored according to the -log10(p.adjust).
∗Top 15 enriched GO BP terms are showed in the bar plot of each disease state in each tissue. Each row represents a significant GO biological process which is colored according to the -log10(p.adjust).
Page: 1 2 3 4 5 6 7 8 9 

check button Enriched GO biological processes.
GO IDTissueDisease StageDescriptionGene RatioBg Ratiopvaluep.adjustCount
GO:005134622LiverHCCnegative regulation of hydrolase activity195/7958379/187232.44e-041.82e-03195
GO:000717921LiverHCCtransforming growth factor beta receptor signaling pathway106/7958198/187231.09e-036.23e-03106
GO:19038442LiverHCCregulation of cellular response to transforming growth factor beta stimulus72/7958131/187232.65e-031.27e-0272
GO:001095121LiverHCCnegative regulation of endopeptidase activity129/7958252/187233.17e-031.47e-02129
GO:001701511LiverHCCregulation of transforming growth factor beta receptor signaling pathway70/7958128/187233.56e-031.59e-0270
GO:001046621LiverHCCnegative regulation of peptidase activity132/7958262/187235.82e-032.42e-02132
GO:004206020Oral cavityOSCCwound healing237/7305422/187234.51e-132.18e-11237
GO:005254720Oral cavityOSCCregulation of peptidase activity255/7305461/187235.78e-132.75e-11255
GO:001056320Oral cavityOSCCnegative regulation of phosphorus metabolic process246/7305442/187236.12e-132.89e-11246
GO:004593620Oral cavityOSCCnegative regulation of phosphate metabolic process245/7305441/187238.85e-134.09e-11245
GO:003009920Oral cavityOSCCmyeloid cell differentiation213/7305381/187231.24e-114.42e-10213
GO:004232619Oral cavityOSCCnegative regulation of phosphorylation214/7305385/187232.30e-117.74e-10214
GO:005254820Oral cavityOSCCregulation of endopeptidase activity235/7305432/187234.35e-111.40e-09235
GO:000193319Oral cavityOSCCnegative regulation of protein phosphorylation191/7305342/187231.58e-104.62e-09191
GO:000257310Oral cavityOSCCmyeloid leukocyte differentiation119/7305208/187237.29e-081.29e-06119
GO:00715598Oral cavityOSCCresponse to transforming growth factor beta140/7305256/187232.34e-073.70e-06140
GO:00715608Oral cavityOSCCcellular response to transforming growth factor beta stimulus137/7305250/187232.68e-074.15e-06137
GO:00435887Oral cavityOSCCskin development143/7305263/187232.77e-074.27e-06143
GO:00085449Oral cavityOSCCepidermis development171/7305324/187232.89e-074.43e-06171
GO:004586120Oral cavityOSCCnegative regulation of proteolysis181/7305351/187231.01e-061.37e-05181
Page: 1 2 3 4 5 6 7 8 9 10 11 12 13 14 15 16 

check button Enriched KEGG pathways.
Pathway IDTissueDisease StageDescriptionGene RatioBg Ratiopvaluep.adjustqvalueCount
Page: 1 

Top

Cell-cell communication analysis

check buttonIdentification of potential cell-cell interactions between two cell types and their ligand-receptor pairs for different disease states
LigandReceptorLRpairPathwayTissueDisease Stage
Page: 1 

Top

Single-cell gene regulatory network inference analysis

check buttonFind out the significant the regulons (TFs) and the target genes of each regulon across cell types for different disease states
TFCell TypeTissueDisease StageTarget GeneRSSRegulon Activity
∗The dot plots of a searched regulon are shown for all cell subpopulations in each disease state of each tissue based on the regulon specific score inferred using pySCENIC and by calculating the average expression.
Page: 1 

Top

Somatic mutation of malignant transformation related genes

check buttonAnnotation of somatic variants for genes involved in malignant transformation
Hugo SymbolVariant ClassVariant ClassificationdbSNP RSHGVScHGVSpHGVSp ShortSWISSPROTBIOTYPESIFTPolyPhenTumor Sample BarcodeTissueHistologySexAgeStageTherapy TypesDrugsOutcome
CD109SNVMissense_Mutationrs137899447c.445N>Tp.Arg149Cysp.R149CQ6YHK3protein_codingdeleterious(0)probably_damaging(1)TCGA-A8-A07U-01Breastbreast invasive carcinomaFemale>=65III/IVChemotherapy5-fluorouracilSD
CD109SNVMissense_Mutationc.3391C>Gp.Leu1131Valp.L1131VQ6YHK3protein_codingdeleterious(0.01)benign(0.062)TCGA-A8-A07W-01Breastbreast invasive carcinomaFemale>=65III/IVHormone TherapyexemestaneSD
CD109SNVMissense_Mutationrs745425108c.917C>Tp.Ser306Leup.S306LQ6YHK3protein_codingtolerated(0.16)benign(0.013)TCGA-AC-A23H-01Breastbreast invasive carcinomaFemale>=65I/IIUnknownUnknownPD
CD109SNVMissense_Mutationc.2918C>Gp.Ser973Cysp.S973CQ6YHK3protein_codingdeleterious(0)probably_damaging(1)TCGA-AC-A23H-01Breastbreast invasive carcinomaFemale>=65I/IIUnknownUnknownPD
CD109SNVMissense_Mutationc.3850G>Cp.Asp1284Hisp.D1284HQ6YHK3protein_codingdeleterious(0.02)possibly_damaging(0.813)TCGA-AC-A23H-01Breastbreast invasive carcinomaFemale>=65I/IIUnknownUnknownPD
CD109SNVMissense_Mutationrs137899447c.445C>Tp.Arg149Cysp.R149CQ6YHK3protein_codingdeleterious(0)probably_damaging(1)TCGA-AN-A046-01Breastbreast invasive carcinomaFemale>=65I/IIUnknownUnknownSD
CD109SNVMissense_Mutationrs776870550c.627A>Tp.Gln209Hisp.Q209HQ6YHK3protein_codingdeleterious(0.02)possibly_damaging(0.722)TCGA-AN-A0FL-01Breastbreast invasive carcinomaFemale<65I/IIUnknownUnknownSD
CD109SNVMissense_Mutationnovelc.2636C>Tp.Thr879Ilep.T879IQ6YHK3protein_codingtolerated(0.09)benign(0.101)TCGA-BH-A0HB-01Breastbreast invasive carcinomaFemale<65I/IIChemotherapydocetaxelSD
CD109SNVMissense_Mutationc.1090N>Gp.Leu364Valp.L364VQ6YHK3protein_codingdeleterious(0)probably_damaging(0.927)TCGA-C8-A12P-01Breastbreast invasive carcinomaFemale<65I/IIUnknownUnknownSD
CD109SNVMissense_Mutationrs202157387c.79N>Tp.Arg27Trpp.R27WQ6YHK3protein_codingdeleterious(0.01)possibly_damaging(0.727)TCGA-E2-A2P5-01Breastbreast invasive carcinomaFemale>=65III/IVHormone TherapyarimidexPD
Page: 1 2 3 4 5 6 7 8 9 10 11 12 13 14 15 16 17 

Top

Related drugs of malignant transformation related genes

check buttonIdentification of chemicals and drugs interact with genes involved in malignant transfromation
(DGIdb 4.0)
Entrez IDSymbolCategoryInteraction TypesDrug Claim NameDrug NamePMIDs
Page: 1