
|
|||||
|
 | |
| |
| |
| |
| |
| |
|
Gene: CCDC47 |
Gene summary for CCDC47 |
| Gene information | Species | Human | Gene symbol | CCDC47 | Gene ID | 57003 |
| Gene name | coiled-coil domain containing 47 | |
| Gene Alias | GK001 | |
| Cytomap | 17q23.3 | |
| Gene Type | protein-coding | GO ID | GO:0001503 | UniProtAcc | Q96A33 |
Top |
Malignant transformation analysis |
| Identification of the aberrant gene expression in precancerous and cancerous lesions by comparing the gene expression of stem-like cells in diseased tissues with normal stem cells |
| Entrez ID | Symbol | Replicates | Species | Organ | Tissue | Adj P-value | Log2FC | Malignancy |
| 57003 | CCDC47 | HTA11_78_2000001011 | Human | Colorectum | AD | 8.51e-06 | 4.42e-01 | -0.1088 |
| 57003 | CCDC47 | HTA11_347_2000001011 | Human | Colorectum | AD | 2.57e-23 | 7.34e-01 | -0.1954 |
| 57003 | CCDC47 | HTA11_99999970781_79442 | Human | Colorectum | MSS | 1.12e-05 | 4.41e-01 | 0.294 |
| 57003 | CCDC47 | HTA11_99999965104_69814 | Human | Colorectum | MSS | 3.38e-05 | 5.76e-01 | 0.281 |
| 57003 | CCDC47 | HTA11_99999971662_82457 | Human | Colorectum | MSS | 2.03e-04 | 3.79e-01 | 0.3859 |
| 57003 | CCDC47 | A015-C-203 | Human | Colorectum | FAP | 8.81e-03 | -8.02e-02 | -0.1294 |
| 57003 | CCDC47 | A015-C-104 | Human | Colorectum | FAP | 2.00e-03 | -9.47e-02 | -0.1899 |
| 57003 | CCDC47 | A002-C-016 | Human | Colorectum | FAP | 2.76e-02 | -5.82e-02 | 0.0521 |
| 57003 | CCDC47 | AEH-subject2 | Human | Endometrium | AEH | 1.10e-02 | -9.95e-02 | -0.2525 |
| 57003 | CCDC47 | EEC-subject3 | Human | Endometrium | EEC | 8.71e-08 | -6.46e-03 | -0.2525 |
| 57003 | CCDC47 | GSM5276934 | Human | Endometrium | EEC | 6.64e-14 | 4.21e-01 | -0.0913 |
| 57003 | CCDC47 | GSM5276937 | Human | Endometrium | EEC | 3.86e-15 | 5.06e-01 | -0.0897 |
| 57003 | CCDC47 | GSM6177620_NYU_UCEC1_lib1_lib1 | Human | Endometrium | EEC | 1.50e-21 | 1.33e-02 | -0.1869 |
| 57003 | CCDC47 | GSM6177620_NYU_UCEC1_lib2_lib2 | Human | Endometrium | EEC | 2.79e-18 | -2.14e-02 | -0.1875 |
| 57003 | CCDC47 | GSM6177620_NYU_UCEC1_lib3_lib3 | Human | Endometrium | EEC | 1.96e-20 | -1.47e-01 | -0.1883 |
| 57003 | CCDC47 | GSM6177621_NYU_UCEC2_lib1_lib1 | Human | Endometrium | EEC | 3.12e-11 | -4.02e-02 | -0.1934 |
| 57003 | CCDC47 | GSM6177622_NYU_UCEC3_lib1_lib1 | Human | Endometrium | EEC | 1.81e-18 | -1.23e-01 | -0.1917 |
| 57003 | CCDC47 | GSM6177622_NYU_UCEC3_lib2_lib2 | Human | Endometrium | EEC | 1.18e-23 | -9.98e-02 | -0.1916 |
| 57003 | CCDC47 | LZE4T | Human | Esophagus | ESCC | 4.22e-09 | 5.86e-01 | 0.0811 |
| 57003 | CCDC47 | LZE8T | Human | Esophagus | ESCC | 3.22e-04 | 2.15e-01 | 0.067 |
| Page: 1 2 3 4 5 6 7 8 |
| Tissue | Expression Dynamics | Abbreviation |
| Colorectum (GSE201348) |  | FAP: Familial adenomatous polyposis |
| CRC: Colorectal cancer | ||
| Colorectum (HTA11) |  | AD: Adenomas |
| SER: Sessile serrated lesions | ||
| MSI-H: Microsatellite-high colorectal cancer | ||
| MSS: Microsatellite stable colorectal cancer | ||
| Endometrium |  | AEH: Atypical endometrial hyperplasia |
| EEC: Endometrioid Cancer | ||
| Esophagus | 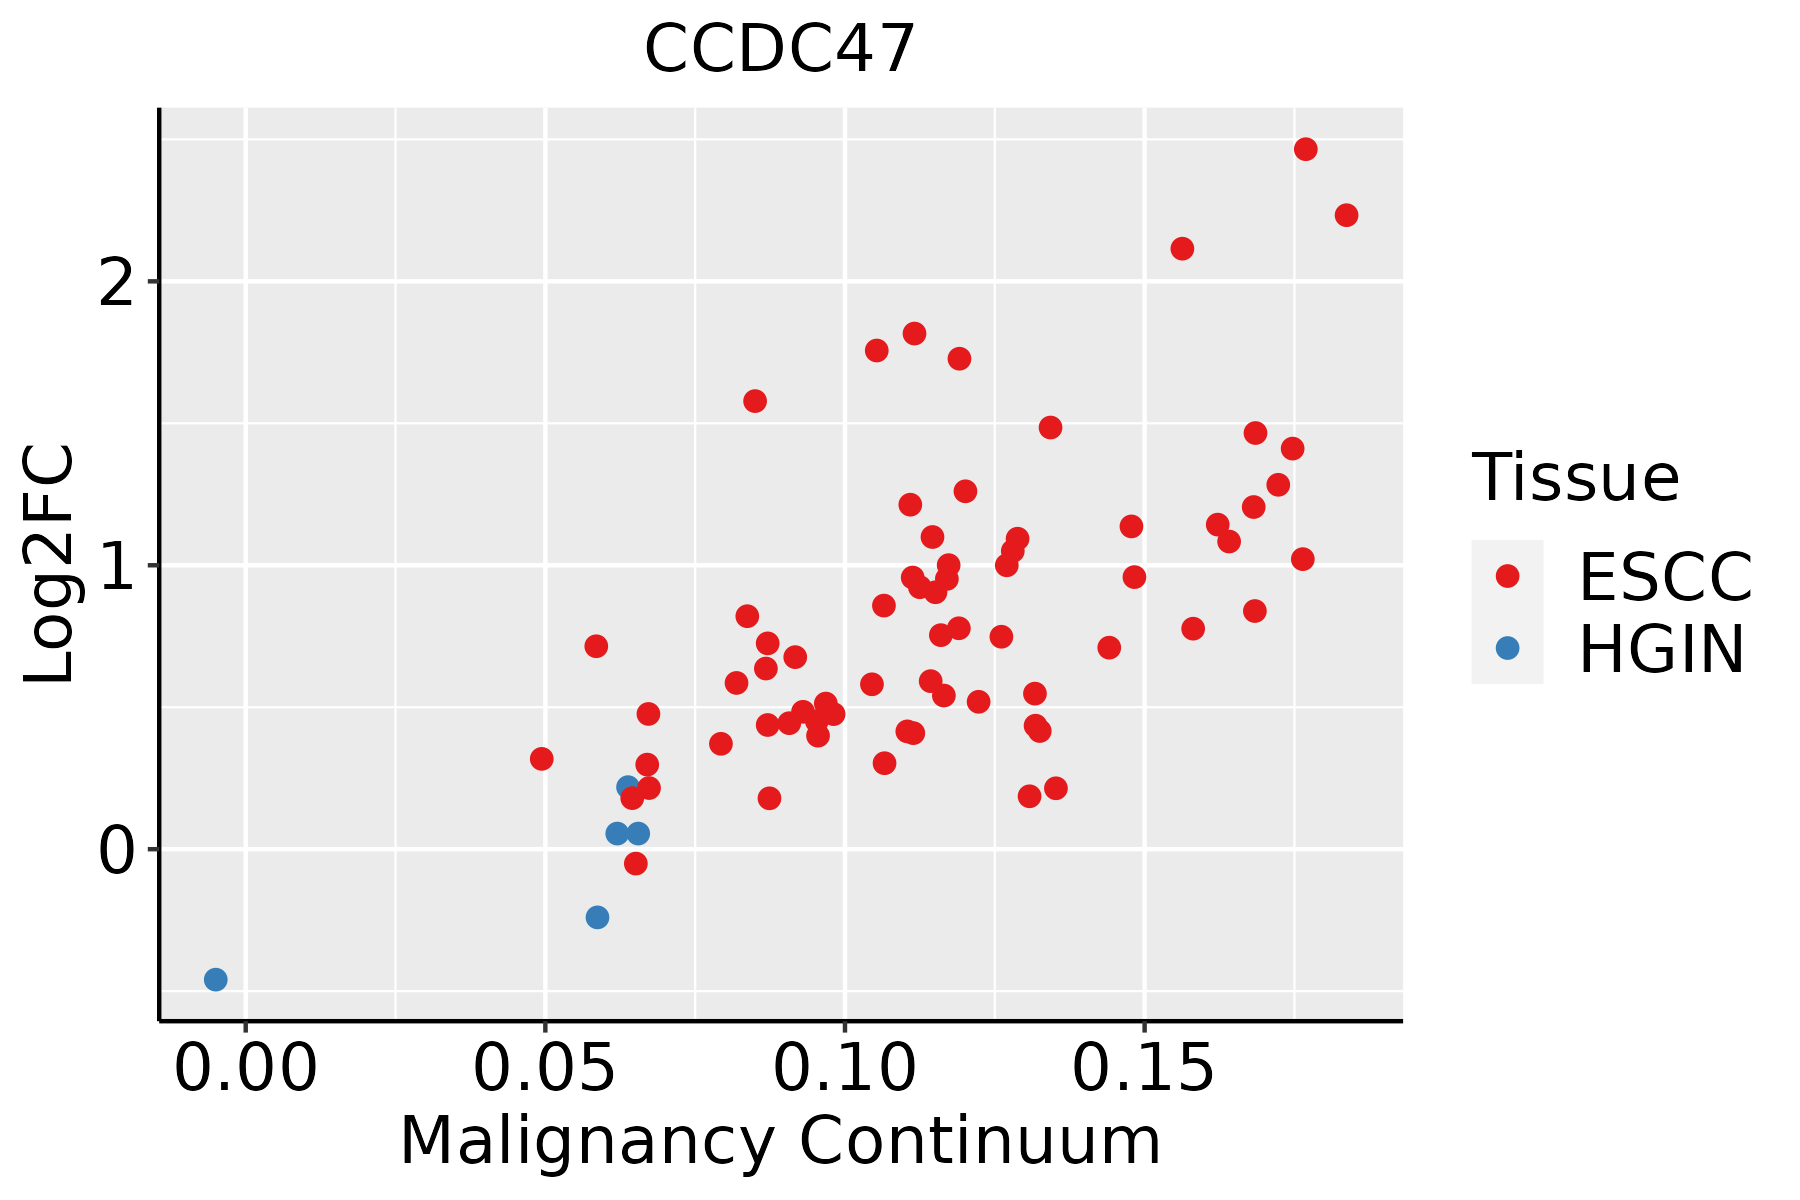 | ESCC: Esophageal squamous cell carcinoma |
| HGIN: High-grade intraepithelial neoplasias | ||
| LGIN: Low-grade intraepithelial neoplasias | ||
| Liver |  | HCC: Hepatocellular carcinoma |
| NAFLD: Non-alcoholic fatty liver disease | ||
| Oral Cavity |  | EOLP: Erosive Oral lichen planus |
| LP: leukoplakia | ||
| NEOLP: Non-erosive oral lichen planus | ||
| OSCC: Oral squamous cell carcinoma | ||
| Prostate |  | BPH: Benign Prostatic Hyperplasia |
| Skin |  | AK: Actinic keratosis |
| cSCC: Cutaneous squamous cell carcinoma | ||
| SCCIS:squamous cell carcinoma in situ | ||
| Thyroid | 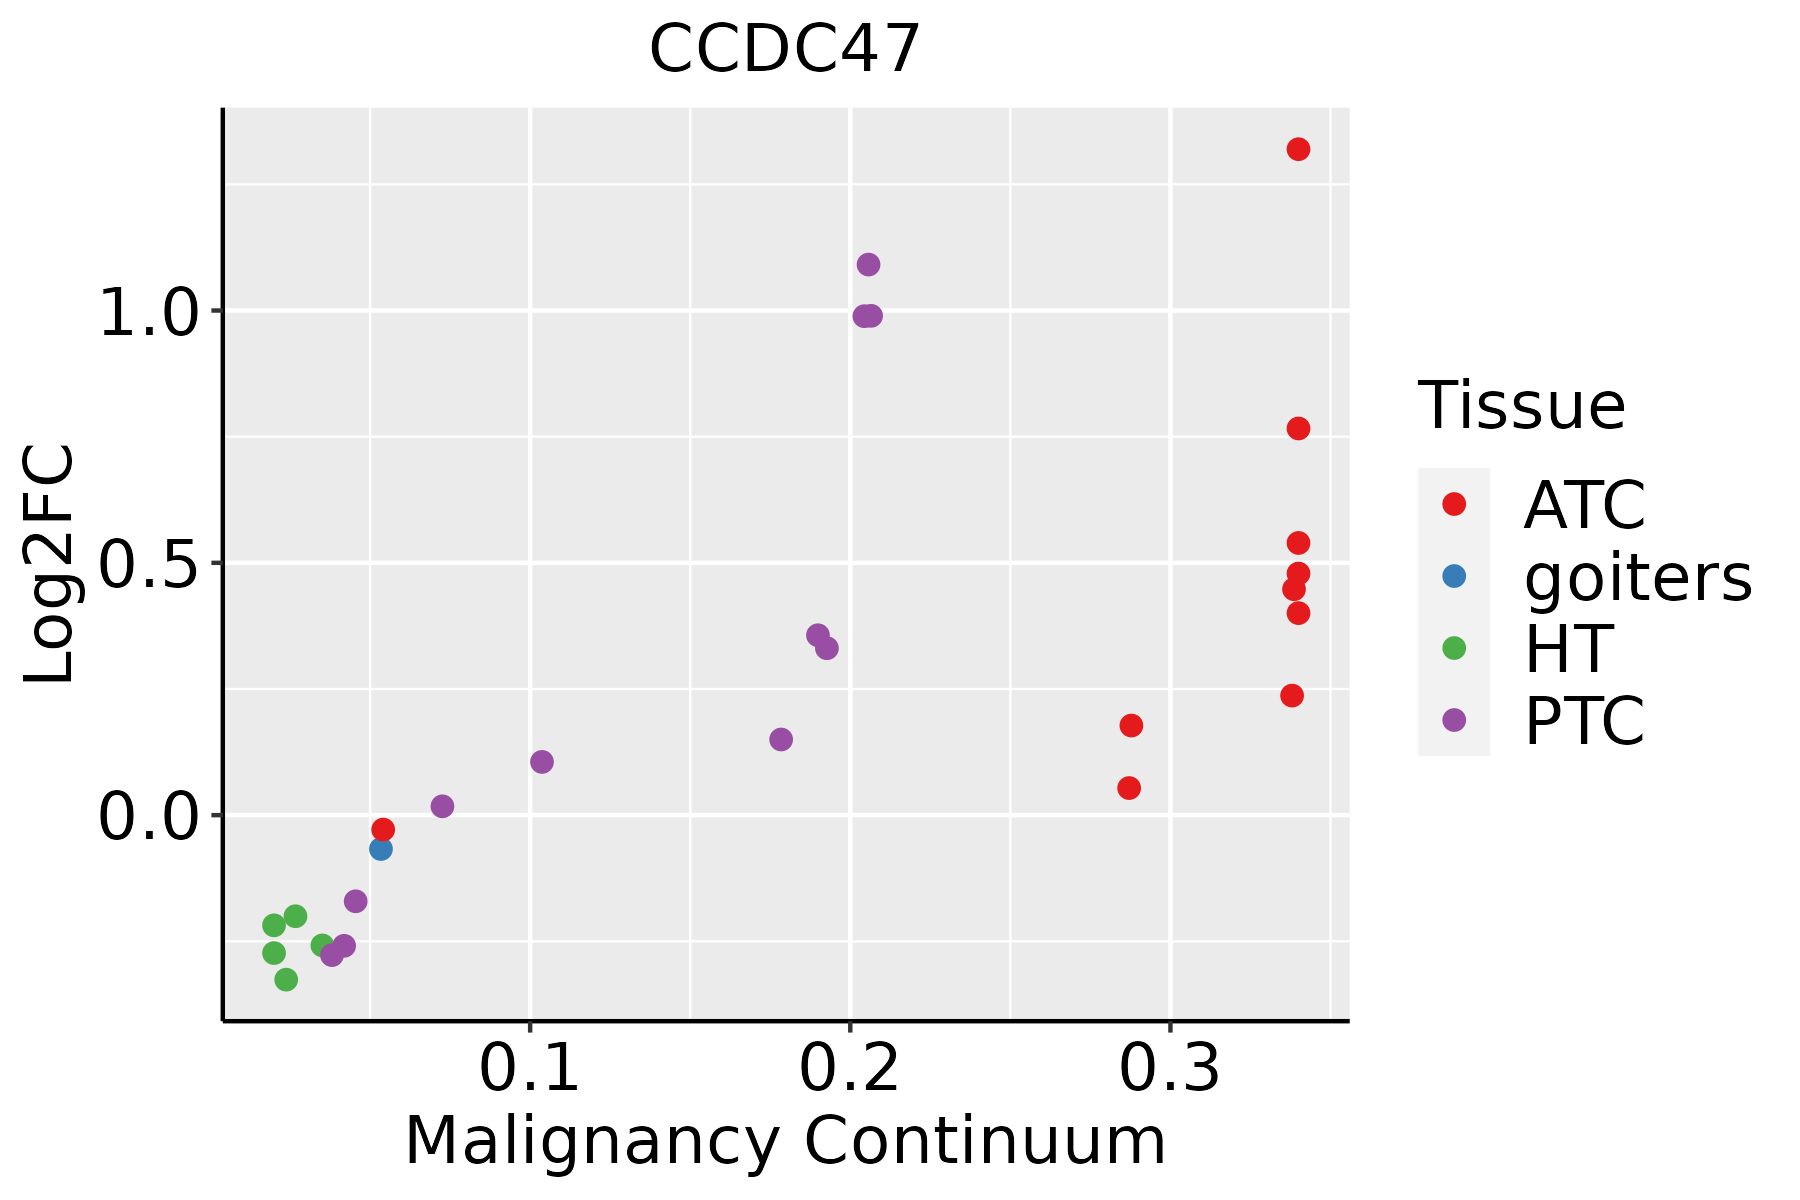 | ATC: Anaplastic thyroid cancer |
| HT: Hashimoto's thyroiditis | ||
| PTC: Papillary thyroid cancer |
| ∗log2FC in expression of this searched gene in stem-like cells from each diseased tissue sample relative to stem-like cells in normal samples in each tissue plotted against the malignancy continuum. Samples are colored based on if they are from different disease stage. |
Top |
Malignant transformation related pathway analysis |
| Find out the enriched GO biological processes and KEGG pathways involved in transition from healthy to precancer to cancer |
| Tissue | Disease Stage | Enriched GO biological Processes |
| Colorectum | AD |  |
| Colorectum | SER |  |
| Colorectum | MSS |  |
| Colorectum | MSI-H |  |
| Colorectum | FAP |  |
| ∗Top 15 enriched GO BP terms are showed in the bar plot of each disease state in each tissue. Each row represents a significant GO biological process which is colored according to the -log10(p.adjust). |
| Page: 1 2 3 4 5 6 7 8 9 |
| GO ID | Tissue | Disease Stage | Description | Gene Ratio | Bg Ratio | pvalue | p.adjust | Count |
| GO:000164911 | Liver | HCC | osteoblast differentiation | 115/7958 | 229/18723 | 1.08e-02 | 3.99e-02 | 115 |
| GO:001049820 | Oral cavity | OSCC | proteasomal protein catabolic process | 336/7305 | 490/18723 | 5.45e-41 | 8.63e-38 | 336 |
| GO:004316120 | Oral cavity | OSCC | proteasome-mediated ubiquitin-dependent protein catabolic process | 285/7305 | 412/18723 | 5.68e-36 | 5.99e-33 | 285 |
| GO:000645718 | Oral cavity | OSCC | protein folding | 154/7305 | 212/18723 | 1.89e-23 | 4.60e-21 | 154 |
| GO:003497620 | Oral cavity | OSCC | response to endoplasmic reticulum stress | 178/7305 | 256/18723 | 2.59e-23 | 6.06e-21 | 178 |
| GO:009015018 | Oral cavity | OSCC | establishment of protein localization to membrane | 163/7305 | 260/18723 | 7.13e-15 | 4.47e-13 | 163 |
| GO:00304334 | Oral cavity | OSCC | ubiquitin-dependent ERAD pathway | 65/7305 | 85/18723 | 2.12e-12 | 8.99e-11 | 65 |
| GO:00365035 | Oral cavity | OSCC | ERAD pathway | 76/7305 | 107/18723 | 1.76e-11 | 6.11e-10 | 76 |
| GO:00069849 | Oral cavity | OSCC | ER-nucleus signaling pathway | 36/7305 | 46/18723 | 6.49e-08 | 1.16e-06 | 36 |
| GO:00070294 | Oral cavity | OSCC | endoplasmic reticulum organization | 58/7305 | 87/18723 | 1.59e-07 | 2.61e-06 | 58 |
| GO:00512056 | Oral cavity | OSCC | protein insertion into membrane | 40/7305 | 57/18723 | 1.81e-06 | 2.34e-05 | 40 |
| GO:000150310 | Oral cavity | OSCC | ossification | 203/7305 | 408/18723 | 5.54e-06 | 6.19e-05 | 203 |
| GO:00097918 | Oral cavity | OSCC | post-embryonic development | 51/7305 | 80/18723 | 6.43e-06 | 7.13e-05 | 51 |
| GO:007121615 | Oral cavity | OSCC | cellular response to biotic stimulus | 129/7305 | 246/18723 | 1.20e-05 | 1.23e-04 | 129 |
| GO:000164910 | Oral cavity | OSCC | osteoblast differentiation | 118/7305 | 229/18723 | 7.51e-05 | 5.85e-04 | 118 |
| GO:003246917 | Oral cavity | OSCC | endoplasmic reticulum calcium ion homeostasis | 19/7305 | 25/18723 | 1.89e-04 | 1.28e-03 | 19 |
| GO:00450482 | Oral cavity | OSCC | protein insertion into ER membrane | 17/7305 | 22/18723 | 2.99e-04 | 1.87e-03 | 17 |
| GO:00069833 | Oral cavity | OSCC | ER overload response | 10/7305 | 13/18723 | 6.32e-03 | 2.35e-02 | 10 |
| GO:000645719 | Oral cavity | LP | protein folding | 125/4623 | 212/18723 | 1.62e-26 | 8.45e-24 | 125 |
| GO:0010498110 | Oral cavity | LP | proteasomal protein catabolic process | 224/4623 | 490/18723 | 9.57e-25 | 4.00e-22 | 224 |
| Page: 1 2 3 4 5 6 7 8 9 10 11 12 13 |
| Pathway ID | Tissue | Disease Stage | Description | Gene Ratio | Bg Ratio | pvalue | p.adjust | qvalue | Count |
| Page: 1 |
Top |
Cell-cell communication analysis |
| Identification of potential cell-cell interactions between two cell types and their ligand-receptor pairs for different disease states |
| Ligand | Receptor | LRpair | Pathway | Tissue | Disease Stage |
| Page: 1 |
Top |
Single-cell gene regulatory network inference analysis |
| Find out the significant the regulons (TFs) and the target genes of each regulon across cell types for different disease states |
| TF | Cell Type | Tissue | Disease Stage | Target Gene | RSS | Regulon Activity |
| ∗The dot plots of a searched regulon are shown for all cell subpopulations in each disease state of each tissue based on the regulon specific score inferred using pySCENIC and by calculating the average expression. |
| Page: 1 |
Top |
Somatic mutation of malignant transformation related genes |
| Annotation of somatic variants for genes involved in malignant transformation |
| Hugo Symbol | Variant Class | Variant Classification | dbSNP RS | HGVSc | HGVSp | HGVSp Short | SWISSPROT | BIOTYPE | SIFT | PolyPhen | Tumor Sample Barcode | Tissue | Histology | Sex | Age | Stage | Therapy Types | Drugs | Outcome |
| CCDC47 | SNV | Missense_Mutation | c.1149G>T | p.Met383Ile | p.M383I | Q96A33 | protein_coding | deleterious(0.03) | benign(0.096) | TCGA-D8-A27G-01 | Breast | breast invasive carcinoma | Female | >=65 | I/II | Unknown | Unknown | SD | |
| CCDC47 | insertion | Frame_Shift_Ins | novel | c.1312_1313insA | p.Arg438LysfsTer10 | p.R438Kfs*10 | Q96A33 | protein_coding | TCGA-A8-A07B-01 | Breast | breast invasive carcinoma | Female | >=65 | I/II | Unknown | Unknown | SD | ||
| CCDC47 | SNV | Missense_Mutation | c.342C>G | p.Ser114Arg | p.S114R | Q96A33 | protein_coding | tolerated(0.48) | benign(0.104) | TCGA-C5-A2LX-01 | Cervix | cervical & endocervical cancer | Female | <65 | I/II | Chemotherapy | cisplatin | SD | |
| CCDC47 | SNV | Missense_Mutation | novel | c.466N>A | p.Gly156Arg | p.G156R | Q96A33 | protein_coding | deleterious(0) | probably_damaging(0.979) | TCGA-EA-A410-01 | Cervix | cervical & endocervical cancer | Female | <65 | I/II | Unknown | Unknown | SD |
| CCDC47 | SNV | Missense_Mutation | c.72N>G | p.Asp24Glu | p.D24E | Q96A33 | protein_coding | tolerated(0.45) | benign(0) | TCGA-FU-A3HZ-01 | Cervix | cervical & endocervical cancer | Female | <65 | I/II | Chemotherapy | cisplatin | CR | |
| CCDC47 | SNV | Missense_Mutation | novel | c.654N>A | p.Met218Ile | p.M218I | Q96A33 | protein_coding | deleterious(0.01) | probably_damaging(0.988) | TCGA-MA-AA3Y-01 | Cervix | cervical & endocervical cancer | Female | <65 | I/II | Unknown | Unknown | SD |
| CCDC47 | SNV | Missense_Mutation | novel | c.1166N>A | p.Ser389Tyr | p.S389Y | Q96A33 | protein_coding | deleterious(0.03) | possibly_damaging(0.722) | TCGA-CA-6717-01 | Colorectum | colon adenocarcinoma | Male | <65 | I/II | Chemotherapy | oxaliplatin | CR |
| CCDC47 | insertion | Frame_Shift_Ins | novel | c.146_147dupCT | p.Val50LeufsTer10 | p.V50Lfs*10 | Q96A33 | protein_coding | TCGA-AA-3821-01 | Colorectum | colon adenocarcinoma | Female | >=65 | I/II | Unknown | Unknown | SD | ||
| CCDC47 | insertion | Frame_Shift_Ins | novel | c.347dupA | p.Asn116LysfsTer2 | p.N116Kfs*2 | Q96A33 | protein_coding | TCGA-CM-4746-01 | Colorectum | colon adenocarcinoma | Male | <65 | I/II | Unknown | Unknown | SD | ||
| CCDC47 | SNV | Missense_Mutation | novel | c.515N>T | p.Arg172Met | p.R172M | Q96A33 | protein_coding | deleterious(0) | possibly_damaging(0.6) | TCGA-A5-A0G2-01 | Endometrium | uterine corpus endometrioid carcinoma | Female | <65 | III/IV | Unknown | Unknown | SD |
| Page: 1 2 3 4 |
Top |
Related drugs of malignant transformation related genes |
| Identification of chemicals and drugs interact with genes involved in malignant transfromation |
| (DGIdb 4.0) |
| Entrez ID | Symbol | Category | Interaction Types | Drug Claim Name | Drug Name | PMIDs |
| Page: 1 |

Copyright 2023-Present -The University of Texas Health Science Center at Houston |