
|
|||||
|
 | |
| |
| |
| |
| |
| |
|
Gene: BUB3 |
Gene summary for BUB3 |
| Gene information | Species | Human | Gene symbol | BUB3 | Gene ID | 9184 |
| Gene name | BUB3 mitotic checkpoint protein | |
| Gene Alias | BUB3L | |
| Cytomap | 10q26.13 | |
| Gene Type | protein-coding | GO ID | GO:0000003 | UniProtAcc | A0A140VJF3 |
Top |
Malignant transformation analysis |
| Identification of the aberrant gene expression in precancerous and cancerous lesions by comparing the gene expression of stem-like cells in diseased tissues with normal stem cells |
| Entrez ID | Symbol | Replicates | Species | Organ | Tissue | Adj P-value | Log2FC | Malignancy |
| 9184 | BUB3 | HTA11_99999970781_79442 | Human | Colorectum | MSS | 3.60e-10 | 5.19e-01 | 0.294 |
| 9184 | BUB3 | HTA11_99999965104_69814 | Human | Colorectum | MSS | 2.62e-02 | 2.79e-01 | 0.281 |
| 9184 | BUB3 | HTA11_99999971662_82457 | Human | Colorectum | MSS | 1.72e-02 | 3.34e-01 | 0.3859 |
| 9184 | BUB3 | LZE4T | Human | Esophagus | ESCC | 1.04e-11 | 5.92e-01 | 0.0811 |
| 9184 | BUB3 | LZE7T | Human | Esophagus | ESCC | 4.71e-04 | 4.80e-01 | 0.0667 |
| 9184 | BUB3 | LZE8T | Human | Esophagus | ESCC | 4.54e-07 | 3.53e-01 | 0.067 |
| 9184 | BUB3 | LZE20T | Human | Esophagus | ESCC | 1.69e-03 | 2.16e-01 | 0.0662 |
| 9184 | BUB3 | LZE22D1 | Human | Esophagus | HGIN | 4.96e-05 | 8.64e-02 | 0.0595 |
| 9184 | BUB3 | LZE22T | Human | Esophagus | ESCC | 3.33e-04 | 1.84e-01 | 0.068 |
| 9184 | BUB3 | LZE24T | Human | Esophagus | ESCC | 3.42e-21 | 7.19e-01 | 0.0596 |
| 9184 | BUB3 | LZE21T | Human | Esophagus | ESCC | 4.95e-02 | 3.46e-01 | 0.0655 |
| 9184 | BUB3 | LZE6T | Human | Esophagus | ESCC | 5.20e-12 | 7.97e-01 | 0.0845 |
| 9184 | BUB3 | P1T-E | Human | Esophagus | ESCC | 1.14e-03 | 4.93e-01 | 0.0875 |
| 9184 | BUB3 | P2T-E | Human | Esophagus | ESCC | 1.26e-58 | 1.27e+00 | 0.1177 |
| 9184 | BUB3 | P4T-E | Human | Esophagus | ESCC | 3.79e-41 | 1.24e+00 | 0.1323 |
| 9184 | BUB3 | P5T-E | Human | Esophagus | ESCC | 1.36e-58 | 1.46e+00 | 0.1327 |
| 9184 | BUB3 | P8T-E | Human | Esophagus | ESCC | 1.67e-21 | 5.48e-01 | 0.0889 |
| 9184 | BUB3 | P9T-E | Human | Esophagus | ESCC | 1.09e-08 | 5.08e-01 | 0.1131 |
| 9184 | BUB3 | P10T-E | Human | Esophagus | ESCC | 4.35e-30 | 7.36e-01 | 0.116 |
| 9184 | BUB3 | P11T-E | Human | Esophagus | ESCC | 8.45e-19 | 9.87e-01 | 0.1426 |
| Page: 1 2 3 4 5 6 7 |
| Tissue | Expression Dynamics | Abbreviation |
| Colorectum (GSE201348) |  | FAP: Familial adenomatous polyposis |
| CRC: Colorectal cancer | ||
| Colorectum (HTA11) |  | AD: Adenomas |
| SER: Sessile serrated lesions | ||
| MSI-H: Microsatellite-high colorectal cancer | ||
| MSS: Microsatellite stable colorectal cancer | ||
| Esophagus | 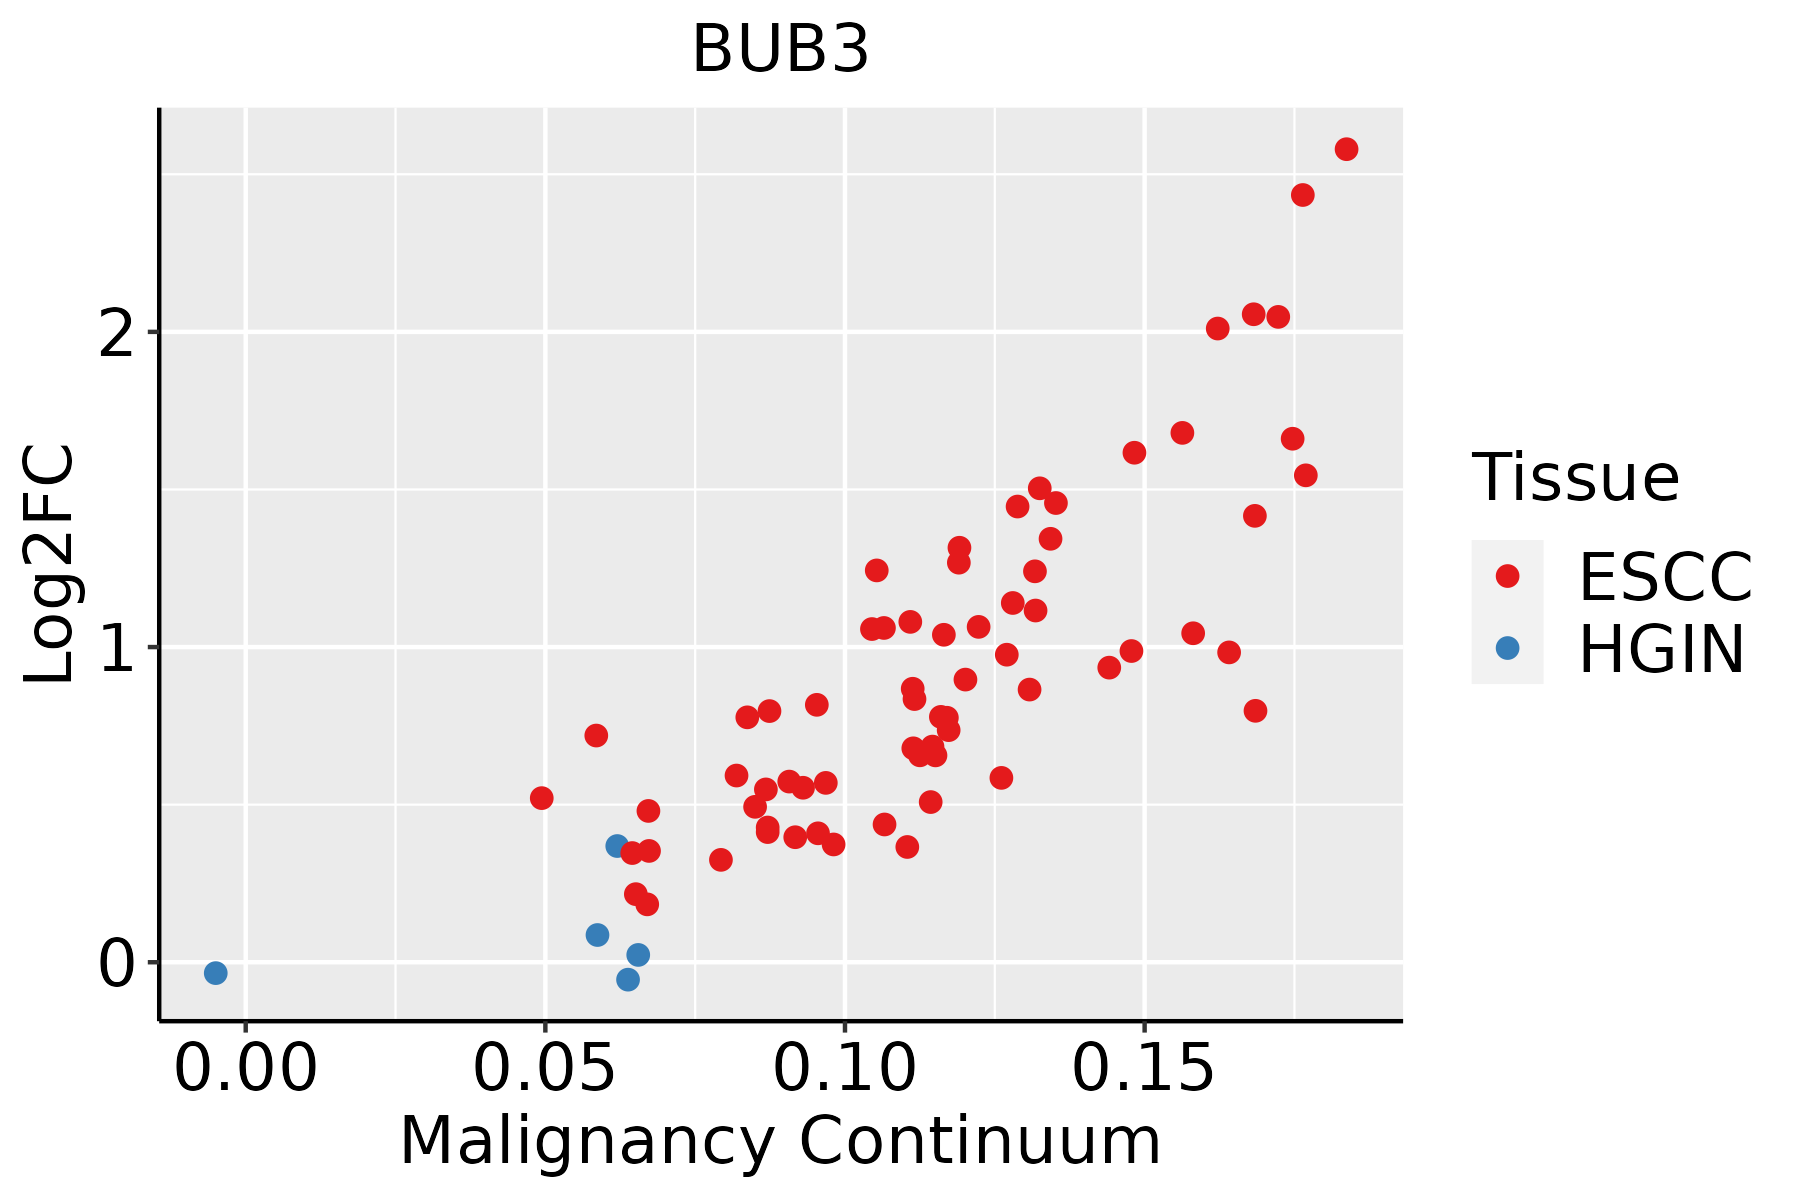 | ESCC: Esophageal squamous cell carcinoma |
| HGIN: High-grade intraepithelial neoplasias | ||
| LGIN: Low-grade intraepithelial neoplasias | ||
| Liver | 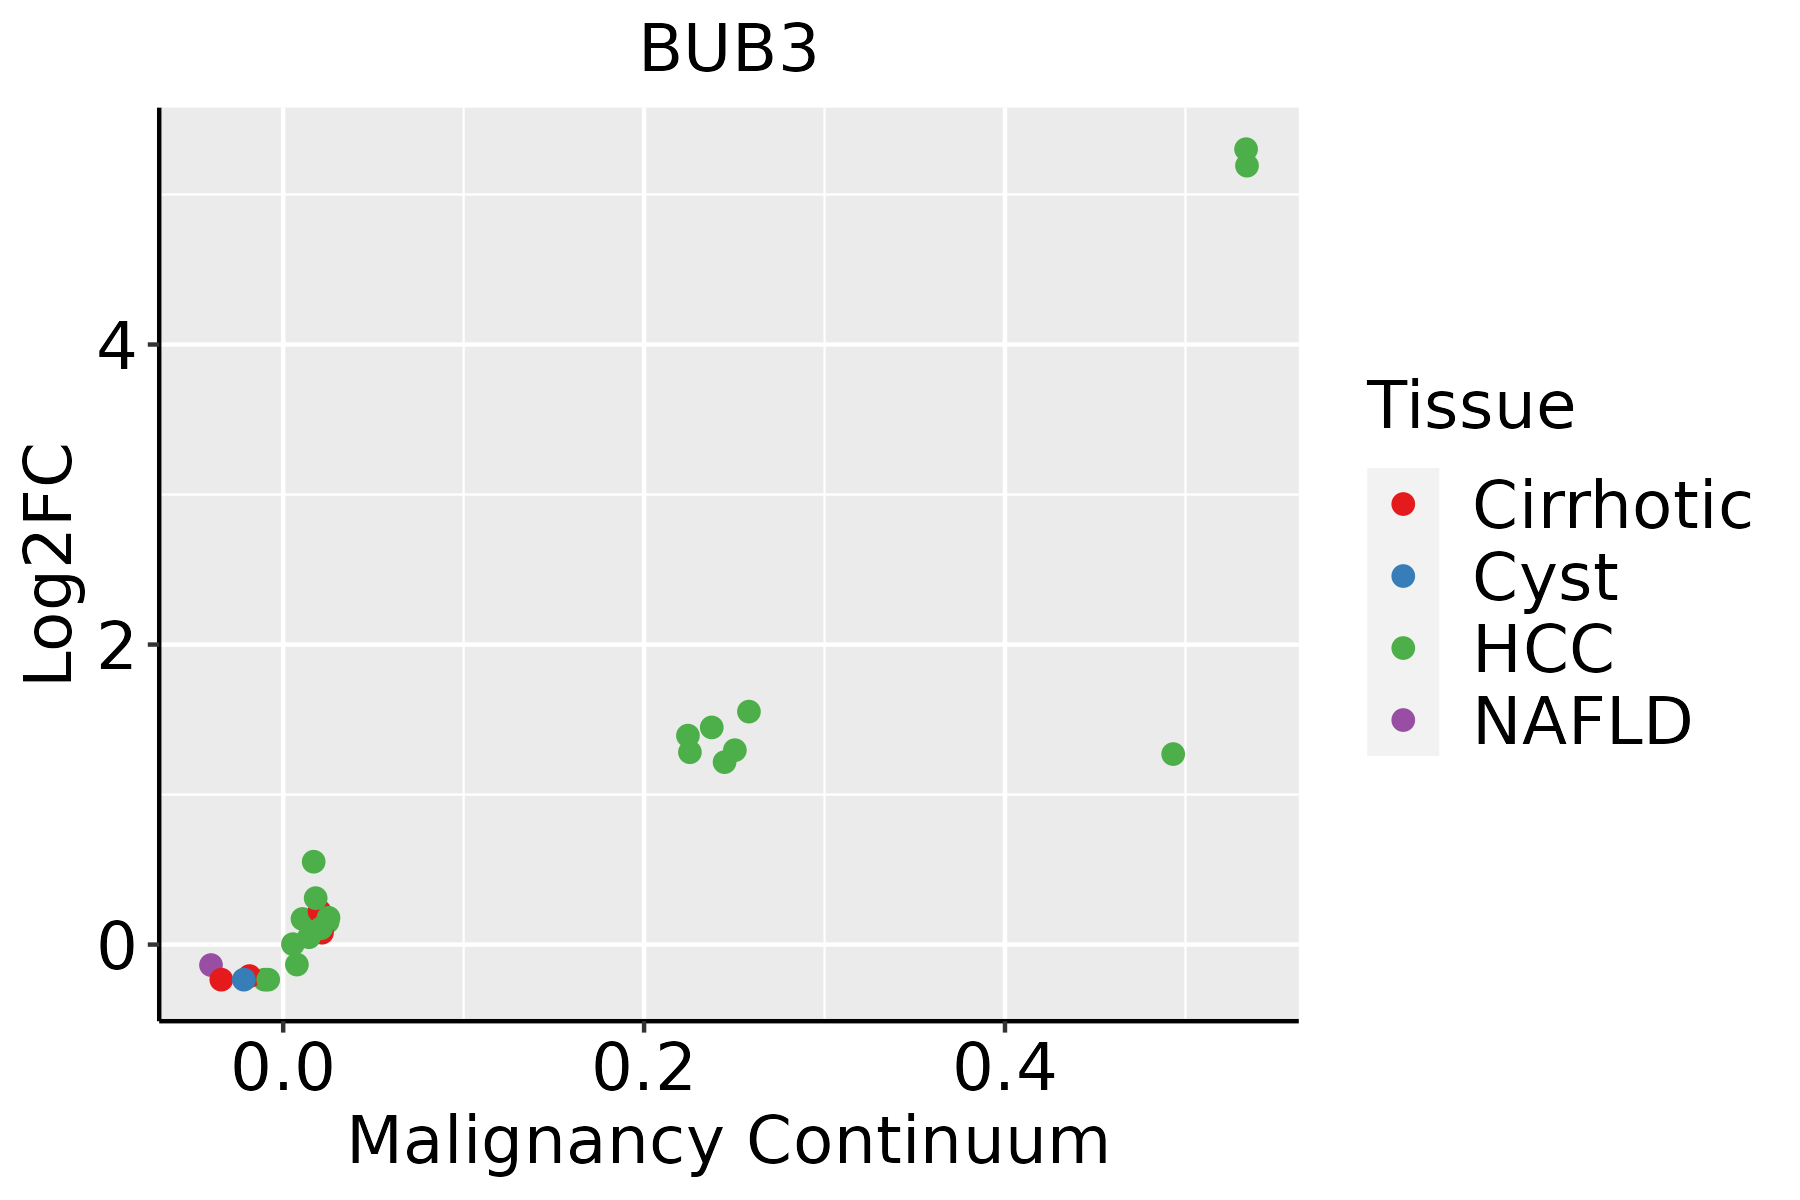 | HCC: Hepatocellular carcinoma |
| NAFLD: Non-alcoholic fatty liver disease | ||
| Oral Cavity | 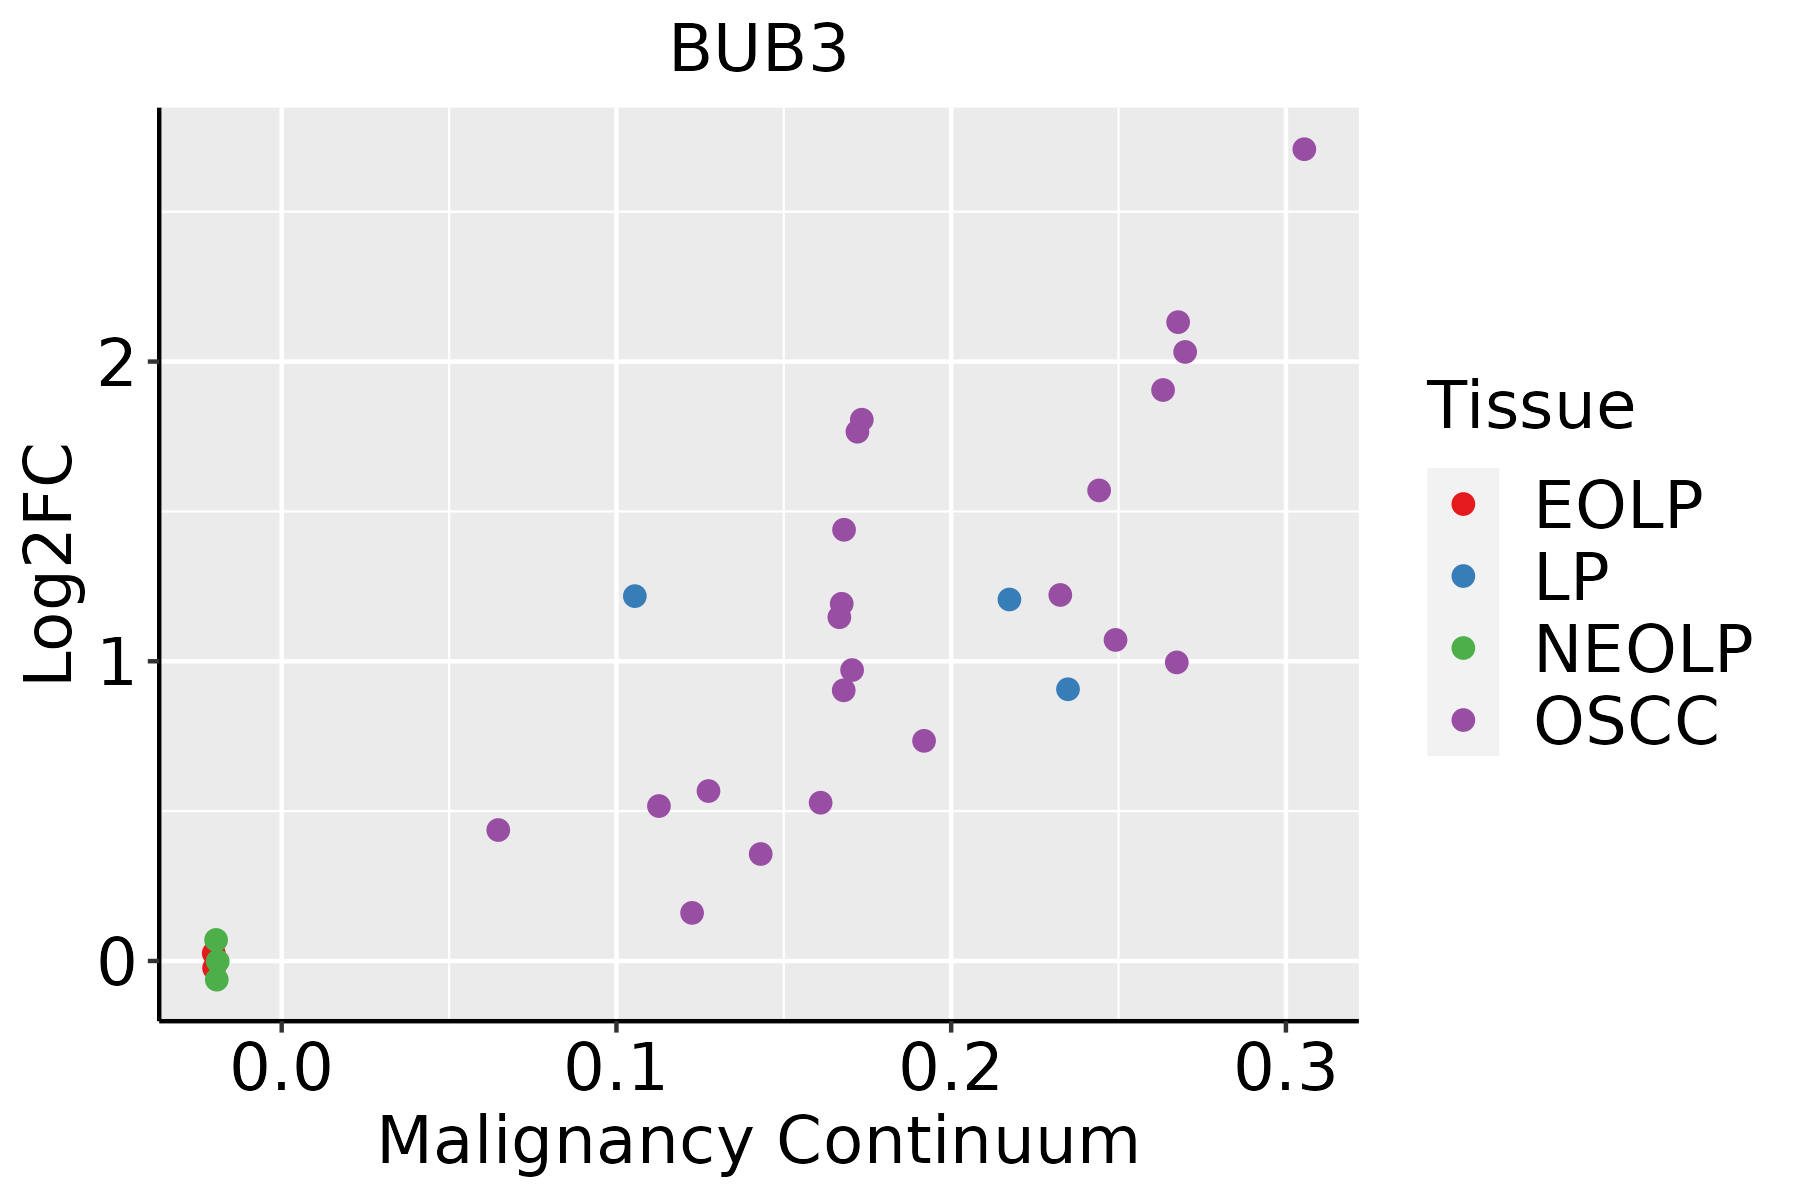 | EOLP: Erosive Oral lichen planus |
| LP: leukoplakia | ||
| NEOLP: Non-erosive oral lichen planus | ||
| OSCC: Oral squamous cell carcinoma | ||
| Skin |  | AK: Actinic keratosis |
| cSCC: Cutaneous squamous cell carcinoma | ||
| SCCIS:squamous cell carcinoma in situ | ||
| Thyroid | 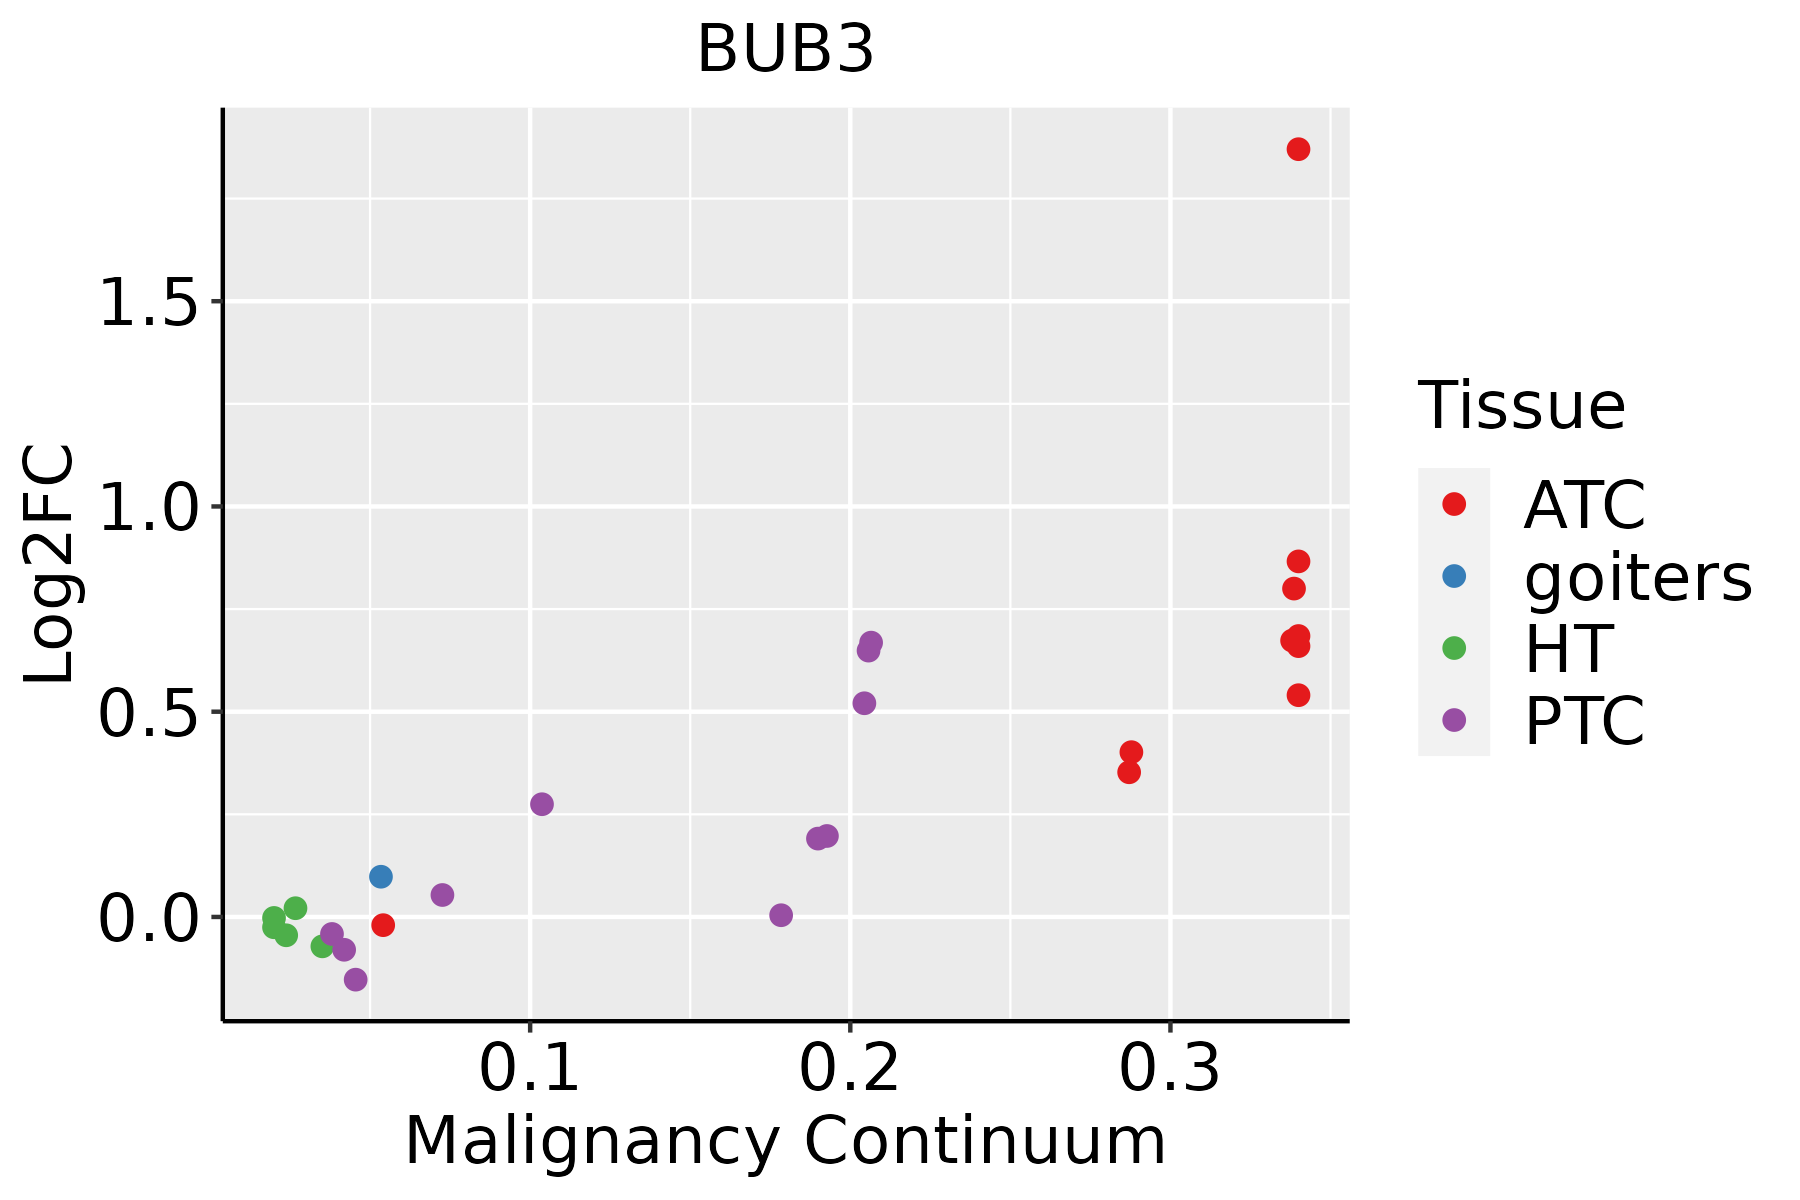 | ATC: Anaplastic thyroid cancer |
| HT: Hashimoto's thyroiditis | ||
| PTC: Papillary thyroid cancer |
| ∗log2FC in expression of this searched gene in stem-like cells from each diseased tissue sample relative to stem-like cells in normal samples in each tissue plotted against the malignancy continuum. Samples are colored based on if they are from different disease stage. |
Top |
Malignant transformation related pathway analysis |
| Find out the enriched GO biological processes and KEGG pathways involved in transition from healthy to precancer to cancer |
| Tissue | Disease Stage | Enriched GO biological Processes |
| Colorectum | AD |  |
| Colorectum | SER |  |
| Colorectum | MSS |  |
| Colorectum | MSI-H |  |
| Colorectum | FAP |  |
| ∗Top 15 enriched GO BP terms are showed in the bar plot of each disease state in each tissue. Each row represents a significant GO biological process which is colored according to the -log10(p.adjust). |
| Page: 1 2 3 4 5 6 7 8 9 |
| GO ID | Tissue | Disease Stage | Description | Gene Ratio | Bg Ratio | pvalue | p.adjust | Count |
| GO:0051304 | Liver | HCC | chromosome separation | 53/7958 | 96/18723 | 8.05e-03 | 3.17e-02 | 53 |
| GO:01400145 | Oral cavity | OSCC | mitotic nuclear division | 191/7305 | 287/18723 | 1.99e-21 | 3.70e-19 | 191 |
| GO:00447728 | Oral cavity | OSCC | mitotic cell cycle phase transition | 255/7305 | 424/18723 | 5.29e-19 | 6.98e-17 | 255 |
| GO:00073469 | Oral cavity | OSCC | regulation of mitotic cell cycle | 266/7305 | 457/18723 | 3.87e-17 | 3.41e-15 | 266 |
| GO:00000702 | Oral cavity | OSCC | mitotic sister chromatid segregation | 118/7305 | 168/18723 | 1.89e-16 | 1.48e-14 | 118 |
| GO:00008193 | Oral cavity | OSCC | sister chromatid segregation | 135/7305 | 202/18723 | 8.88e-16 | 6.52e-14 | 135 |
| GO:00070592 | Oral cavity | OSCC | chromosome segregation | 206/7305 | 346/18723 | 5.82e-15 | 3.76e-13 | 206 |
| GO:00330448 | Oral cavity | OSCC | regulation of chromosome organization | 123/7305 | 187/18723 | 9.87e-14 | 5.17e-12 | 123 |
| GO:00482852 | Oral cavity | OSCC | organelle fission | 265/7305 | 488/18723 | 3.22e-12 | 1.27e-10 | 265 |
| GO:19019905 | Oral cavity | OSCC | regulation of mitotic cell cycle phase transition | 173/7305 | 299/18723 | 2.49e-11 | 8.35e-10 | 173 |
| GO:00002801 | Oral cavity | OSCC | nuclear division | 237/7305 | 439/18723 | 9.62e-11 | 2.90e-09 | 237 |
| GO:00988132 | Oral cavity | OSCC | nuclear chromosome segregation | 162/7305 | 281/18723 | 1.56e-10 | 4.56e-09 | 162 |
| GO:001063918 | Oral cavity | OSCC | negative regulation of organelle organization | 190/7305 | 348/18723 | 2.12e-09 | 4.97e-08 | 190 |
| GO:19019875 | Oral cavity | OSCC | regulation of cell cycle phase transition | 209/7305 | 390/18723 | 2.79e-09 | 6.42e-08 | 209 |
| GO:00457864 | Oral cavity | OSCC | negative regulation of cell cycle | 206/7305 | 385/18723 | 4.28e-09 | 9.55e-08 | 206 |
| GO:00000753 | Oral cavity | OSCC | cell cycle checkpoint | 101/7305 | 169/18723 | 3.53e-08 | 6.68e-07 | 101 |
| GO:00070933 | Oral cavity | OSCC | mitotic cell cycle checkpoint | 81/7305 | 129/18723 | 3.75e-08 | 7.06e-07 | 81 |
| GO:00459304 | Oral cavity | OSCC | negative regulation of mitotic cell cycle | 132/7305 | 235/18723 | 6.51e-08 | 1.16e-06 | 132 |
| GO:19019914 | Oral cavity | OSCC | negative regulation of mitotic cell cycle phase transition | 104/7305 | 179/18723 | 1.67e-07 | 2.73e-06 | 104 |
| GO:00345023 | Oral cavity | OSCC | protein localization to chromosome | 60/7305 | 92/18723 | 3.17e-07 | 4.79e-06 | 60 |
| Page: 1 2 3 4 5 6 7 8 9 10 11 12 13 14 15 16 17 |
| Pathway ID | Tissue | Disease Stage | Description | Gene Ratio | Bg Ratio | pvalue | p.adjust | qvalue | Count |
| hsa051662 | Colorectum | MSS | Human T-cell leukemia virus 1 infection | 68/1875 | 222/8465 | 1.84e-03 | 9.61e-03 | 5.89e-03 | 68 |
| hsa051663 | Colorectum | MSS | Human T-cell leukemia virus 1 infection | 68/1875 | 222/8465 | 1.84e-03 | 9.61e-03 | 5.89e-03 | 68 |
| hsa0516639 | Esophagus | HGIN | Human T-cell leukemia virus 1 infection | 51/1383 | 222/8465 | 5.84e-03 | 4.05e-02 | 3.22e-02 | 51 |
| hsa041109 | Esophagus | HGIN | Cell cycle | 38/1383 | 157/8465 | 6.70e-03 | 4.37e-02 | 3.47e-02 | 38 |
| hsa05166114 | Esophagus | HGIN | Human T-cell leukemia virus 1 infection | 51/1383 | 222/8465 | 5.84e-03 | 4.05e-02 | 3.22e-02 | 51 |
| hsa0411016 | Esophagus | HGIN | Cell cycle | 38/1383 | 157/8465 | 6.70e-03 | 4.37e-02 | 3.47e-02 | 38 |
| hsa0411023 | Esophagus | ESCC | Cell cycle | 126/4205 | 157/8465 | 1.34e-15 | 5.60e-14 | 2.87e-14 | 126 |
| hsa05166211 | Esophagus | ESCC | Human T-cell leukemia virus 1 infection | 164/4205 | 222/8465 | 8.13e-14 | 2.09e-12 | 1.07e-12 | 164 |
| hsa0411033 | Esophagus | ESCC | Cell cycle | 126/4205 | 157/8465 | 1.34e-15 | 5.60e-14 | 2.87e-14 | 126 |
| hsa05166310 | Esophagus | ESCC | Human T-cell leukemia virus 1 infection | 164/4205 | 222/8465 | 8.13e-14 | 2.09e-12 | 1.07e-12 | 164 |
| hsa0516614 | Liver | Cirrhotic | Human T-cell leukemia virus 1 infection | 87/2530 | 222/8465 | 1.69e-03 | 8.01e-03 | 4.94e-03 | 87 |
| hsa041104 | Liver | Cirrhotic | Cell cycle | 61/2530 | 157/8465 | 9.53e-03 | 3.21e-02 | 1.98e-02 | 61 |
| hsa0516615 | Liver | Cirrhotic | Human T-cell leukemia virus 1 infection | 87/2530 | 222/8465 | 1.69e-03 | 8.01e-03 | 4.94e-03 | 87 |
| hsa0411011 | Liver | Cirrhotic | Cell cycle | 61/2530 | 157/8465 | 9.53e-03 | 3.21e-02 | 1.98e-02 | 61 |
| hsa041102 | Liver | HCC | Cell cycle | 106/4020 | 157/8465 | 2.54e-07 | 3.04e-06 | 1.69e-06 | 106 |
| hsa0516622 | Liver | HCC | Human T-cell leukemia virus 1 infection | 139/4020 | 222/8465 | 3.17e-06 | 2.79e-05 | 1.55e-05 | 139 |
| hsa041103 | Liver | HCC | Cell cycle | 106/4020 | 157/8465 | 2.54e-07 | 3.04e-06 | 1.69e-06 | 106 |
| hsa0516632 | Liver | HCC | Human T-cell leukemia virus 1 infection | 139/4020 | 222/8465 | 3.17e-06 | 2.79e-05 | 1.55e-05 | 139 |
| hsa041108 | Oral cavity | OSCC | Cell cycle | 118/3704 | 157/8465 | 7.15e-16 | 2.66e-14 | 1.35e-14 | 118 |
| hsa0516630 | Oral cavity | OSCC | Human T-cell leukemia virus 1 infection | 150/3704 | 222/8465 | 3.68e-13 | 7.26e-12 | 3.70e-12 | 150 |
| Page: 1 2 |
Top |
Cell-cell communication analysis |
| Identification of potential cell-cell interactions between two cell types and their ligand-receptor pairs for different disease states |
| Ligand | Receptor | LRpair | Pathway | Tissue | Disease Stage |
| Page: 1 |
Top |
Single-cell gene regulatory network inference analysis |
| Find out the significant the regulons (TFs) and the target genes of each regulon across cell types for different disease states |
| TF | Cell Type | Tissue | Disease Stage | Target Gene | RSS | Regulon Activity |
| ∗The dot plots of a searched regulon are shown for all cell subpopulations in each disease state of each tissue based on the regulon specific score inferred using pySCENIC and by calculating the average expression. |
| Page: 1 |
Top |
Somatic mutation of malignant transformation related genes |
| Annotation of somatic variants for genes involved in malignant transformation |
| Hugo Symbol | Variant Class | Variant Classification | dbSNP RS | HGVSc | HGVSp | HGVSp Short | SWISSPROT | BIOTYPE | SIFT | PolyPhen | Tumor Sample Barcode | Tissue | Histology | Sex | Age | Stage | Therapy Types | Drugs | Outcome |
| BUB3 | SNV | Missense_Mutation | novel | c.358G>C | p.Val120Leu | p.V120L | O43684 | protein_coding | tolerated(0.56) | benign(0.052) | TCGA-A2-A3XX-01 | Breast | breast invasive carcinoma | Female | <65 | I/II | Chemotherapy | cyclophosphamide | CR |
| BUB3 | SNV | Missense_Mutation | c.637G>A | p.Glu213Lys | p.E213K | O43684 | protein_coding | deleterious(0.02) | possibly_damaging(0.835) | TCGA-AC-A23H-01 | Breast | breast invasive carcinoma | Female | >=65 | I/II | Unknown | Unknown | PD | |
| BUB3 | SNV | Missense_Mutation | c.548G>A | p.Arg183His | p.R183H | O43684 | protein_coding | deleterious(0) | possibly_damaging(0.503) | TCGA-AO-A128-01 | Breast | breast invasive carcinoma | Female | <65 | I/II | Chemotherapy | doxorubicin | SD | |
| BUB3 | SNV | Missense_Mutation | c.169G>C | p.Gly57Arg | p.G57R | O43684 | protein_coding | tolerated(0.13) | benign(0.001) | TCGA-GM-A2DD-01 | Breast | breast invasive carcinoma | Female | <65 | I/II | Chemotherapy | fluorouracil | CR | |
| BUB3 | SNV | Missense_Mutation | novel | c.715G>A | p.Ala239Thr | p.A239T | O43684 | protein_coding | tolerated(0.05) | possibly_damaging(0.606) | TCGA-2W-A8YY-01 | Cervix | cervical & endocervical cancer | Female | <65 | I/II | Chemotherapy | cisplatin | CR |
| BUB3 | SNV | Missense_Mutation | c.506N>G | p.Tyr169Cys | p.Y169C | O43684 | protein_coding | tolerated(0.18) | possibly_damaging(0.598) | TCGA-A6-2686-01 | Colorectum | colon adenocarcinoma | Female | >=65 | I/II | Unknown | Unknown | SD | |
| BUB3 | SNV | Missense_Mutation | c.550N>C | p.Cys184Arg | p.C184R | O43684 | protein_coding | tolerated(0.06) | possibly_damaging(0.736) | TCGA-AA-3710-01 | Colorectum | colon adenocarcinoma | Female | >=65 | I/II | Unknown | Unknown | SD | |
| BUB3 | SNV | Missense_Mutation | c.548N>A | p.Arg183His | p.R183H | O43684 | protein_coding | deleterious(0) | possibly_damaging(0.503) | TCGA-NH-A5IV-01 | Colorectum | colon adenocarcinoma | Female | >=65 | I/II | Unknown | Unknown | SD | |
| BUB3 | insertion | In_Frame_Ins | novel | c.196_197insGGC | p.Asp66delinsGlyHis | p.D66delinsGH | O43684 | protein_coding | TCGA-AA-3821-01 | Colorectum | colon adenocarcinoma | Female | >=65 | I/II | Unknown | Unknown | SD | ||
| BUB3 | insertion | Frame_Shift_Ins | novel | c.690_691insGGTAA | p.Ile231GlyfsTer30 | p.I231Gfs*30 | O43684 | protein_coding | TCGA-AM-5820-01 | Colorectum | colon adenocarcinoma | Female | <65 | I/II | Unknown | Unknown | SD |
| Page: 1 2 3 4 |
Top |
Related drugs of malignant transformation related genes |
| Identification of chemicals and drugs interact with genes involved in malignant transfromation |
| (DGIdb 4.0) |
| Entrez ID | Symbol | Category | Interaction Types | Drug Claim Name | Drug Name | PMIDs |
| Page: 1 |

Copyright 2023-Present -The University of Texas Health Science Center at Houston |