
|
|||||
|
 | |
| |
| |
| |
| |
| |
|
Gene: BRK1 |
Gene summary for BRK1 |
| Gene information | Species | Human | Gene symbol | BRK1 | Gene ID | 55845 |
| Gene name | BRICK1 subunit of SCAR/WAVE actin nucleating complex | |
| Gene Alias | C3orf10 | |
| Cytomap | 3p25.3 | |
| Gene Type | protein-coding | GO ID | GO:0001701 | UniProtAcc | Q8WUW1 |
Top |
Malignant transformation analysis |
| Identification of the aberrant gene expression in precancerous and cancerous lesions by comparing the gene expression of stem-like cells in diseased tissues with normal stem cells |
| Entrez ID | Symbol | Replicates | Species | Organ | Tissue | Adj P-value | Log2FC | Malignancy |
| 55845 | BRK1 | GSM4909281 | Human | Breast | IDC | 3.47e-14 | 4.10e-01 | 0.21 |
| 55845 | BRK1 | GSM4909282 | Human | Breast | IDC | 6.28e-03 | 1.97e-01 | -0.0288 |
| 55845 | BRK1 | GSM4909285 | Human | Breast | IDC | 1.25e-39 | 6.30e-01 | 0.21 |
| 55845 | BRK1 | GSM4909286 | Human | Breast | IDC | 5.72e-07 | 2.72e-01 | 0.1081 |
| 55845 | BRK1 | GSM4909288 | Human | Breast | IDC | 1.80e-04 | -3.02e-02 | 0.0988 |
| 55845 | BRK1 | GSM4909290 | Human | Breast | IDC | 4.38e-09 | 3.61e-01 | 0.2096 |
| 55845 | BRK1 | GSM4909293 | Human | Breast | IDC | 1.01e-02 | 2.34e-01 | 0.1581 |
| 55845 | BRK1 | GSM4909294 | Human | Breast | IDC | 8.71e-08 | 1.26e-02 | 0.2022 |
| 55845 | BRK1 | GSM4909296 | Human | Breast | IDC | 6.74e-16 | 9.48e-02 | 0.1524 |
| 55845 | BRK1 | GSM4909297 | Human | Breast | IDC | 2.47e-27 | -8.61e-02 | 0.1517 |
| 55845 | BRK1 | GSM4909298 | Human | Breast | IDC | 2.86e-09 | 3.50e-01 | 0.1551 |
| 55845 | BRK1 | GSM4909301 | Human | Breast | IDC | 6.76e-05 | 1.23e-01 | 0.1577 |
| 55845 | BRK1 | GSM4909304 | Human | Breast | IDC | 7.38e-24 | 4.53e-01 | 0.1636 |
| 55845 | BRK1 | GSM4909306 | Human | Breast | IDC | 6.09e-03 | 2.51e-01 | 0.1564 |
| 55845 | BRK1 | GSM4909307 | Human | Breast | IDC | 5.07e-15 | 3.90e-01 | 0.1569 |
| 55845 | BRK1 | GSM4909308 | Human | Breast | IDC | 3.13e-34 | 5.84e-01 | 0.158 |
| 55845 | BRK1 | GSM4909309 | Human | Breast | IDC | 4.84e-08 | 1.10e-01 | 0.0483 |
| 55845 | BRK1 | GSM4909311 | Human | Breast | IDC | 3.10e-50 | -3.84e-01 | 0.1534 |
| 55845 | BRK1 | GSM4909312 | Human | Breast | IDC | 5.72e-21 | 2.13e-01 | 0.1552 |
| 55845 | BRK1 | GSM4909313 | Human | Breast | IDC | 1.48e-12 | 1.69e-01 | 0.0391 |
| Page: 1 2 3 4 5 6 7 8 9 10 11 12 13 14 15 |
| Tissue | Expression Dynamics | Abbreviation |
| Breast | 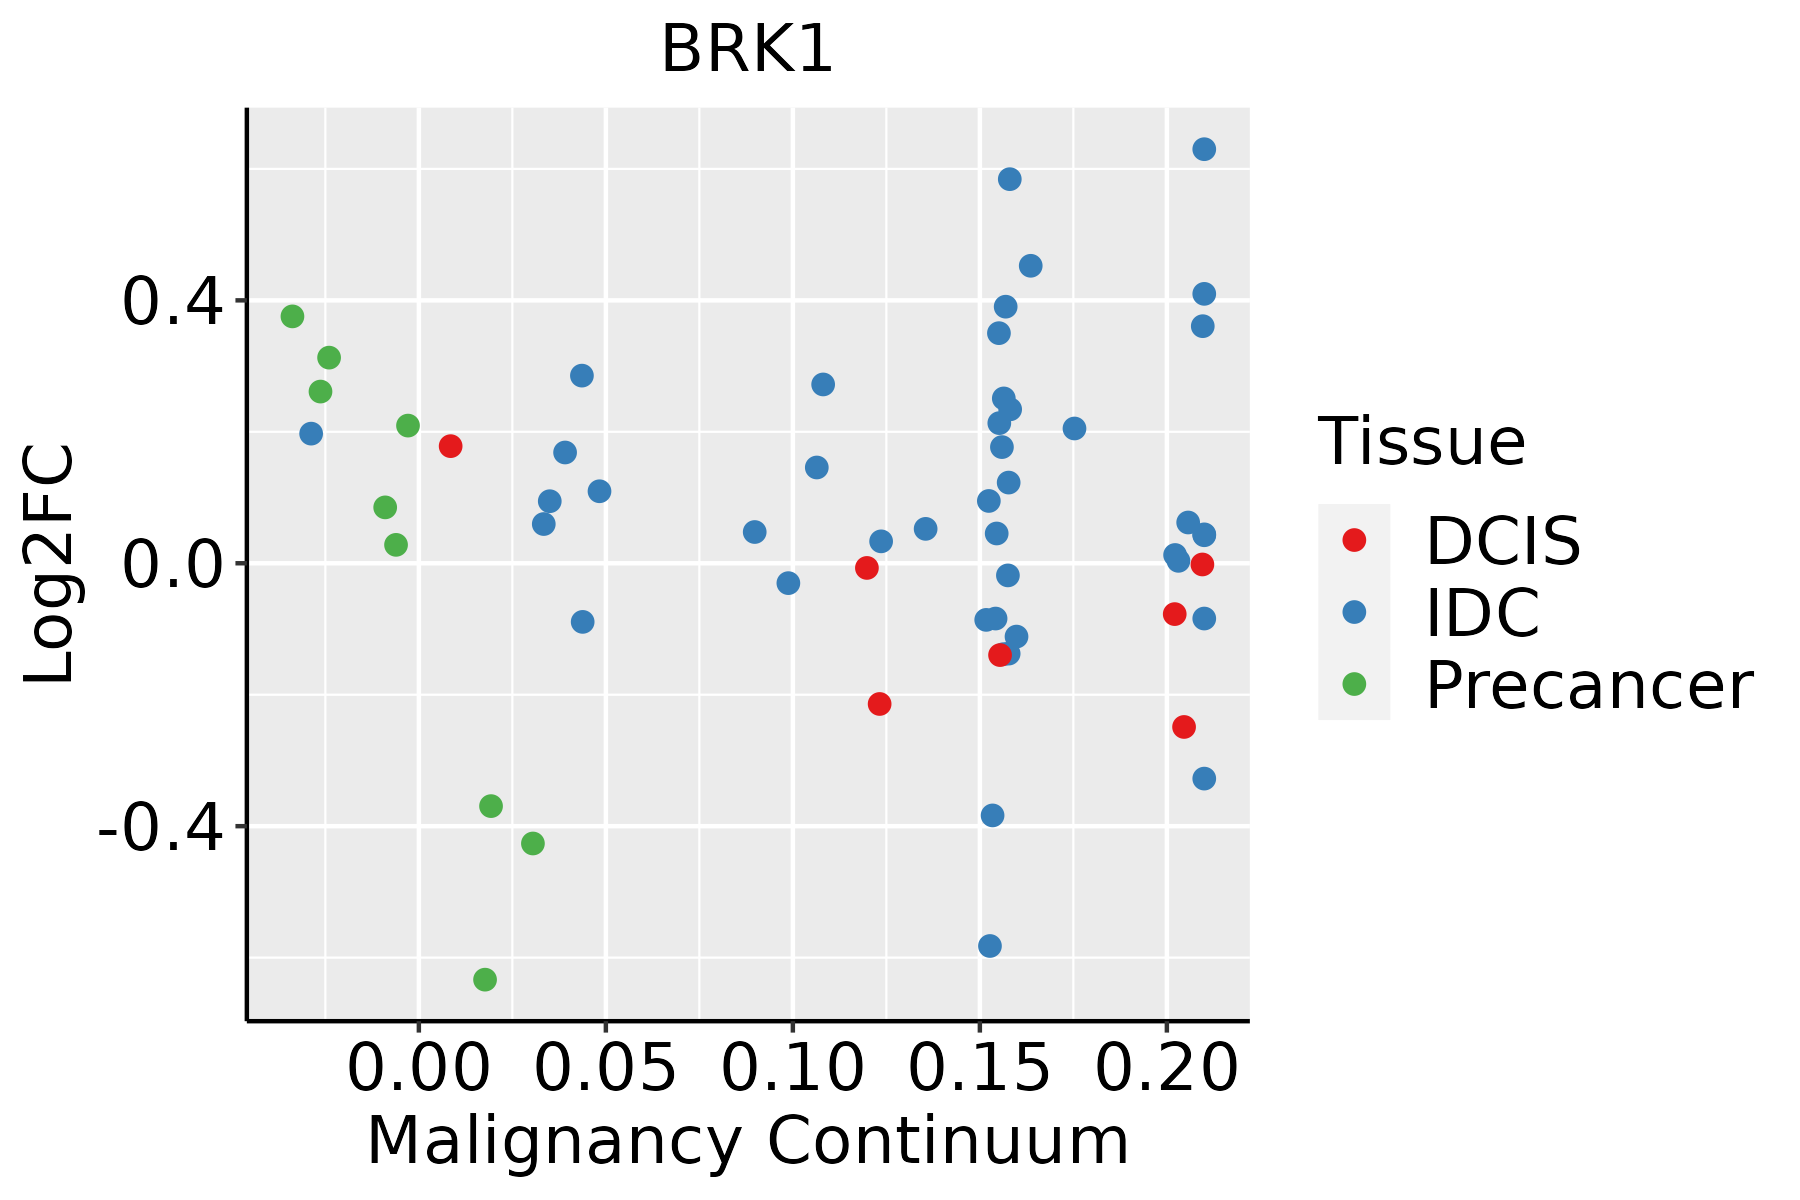 | IDC: Invasive ductal carcinoma |
| DCIS: Ductal carcinoma in situ | ||
| Precancer(BRCA1-mut): Precancerous lesion from BRCA1 mutation carriers | ||
| Cervix | 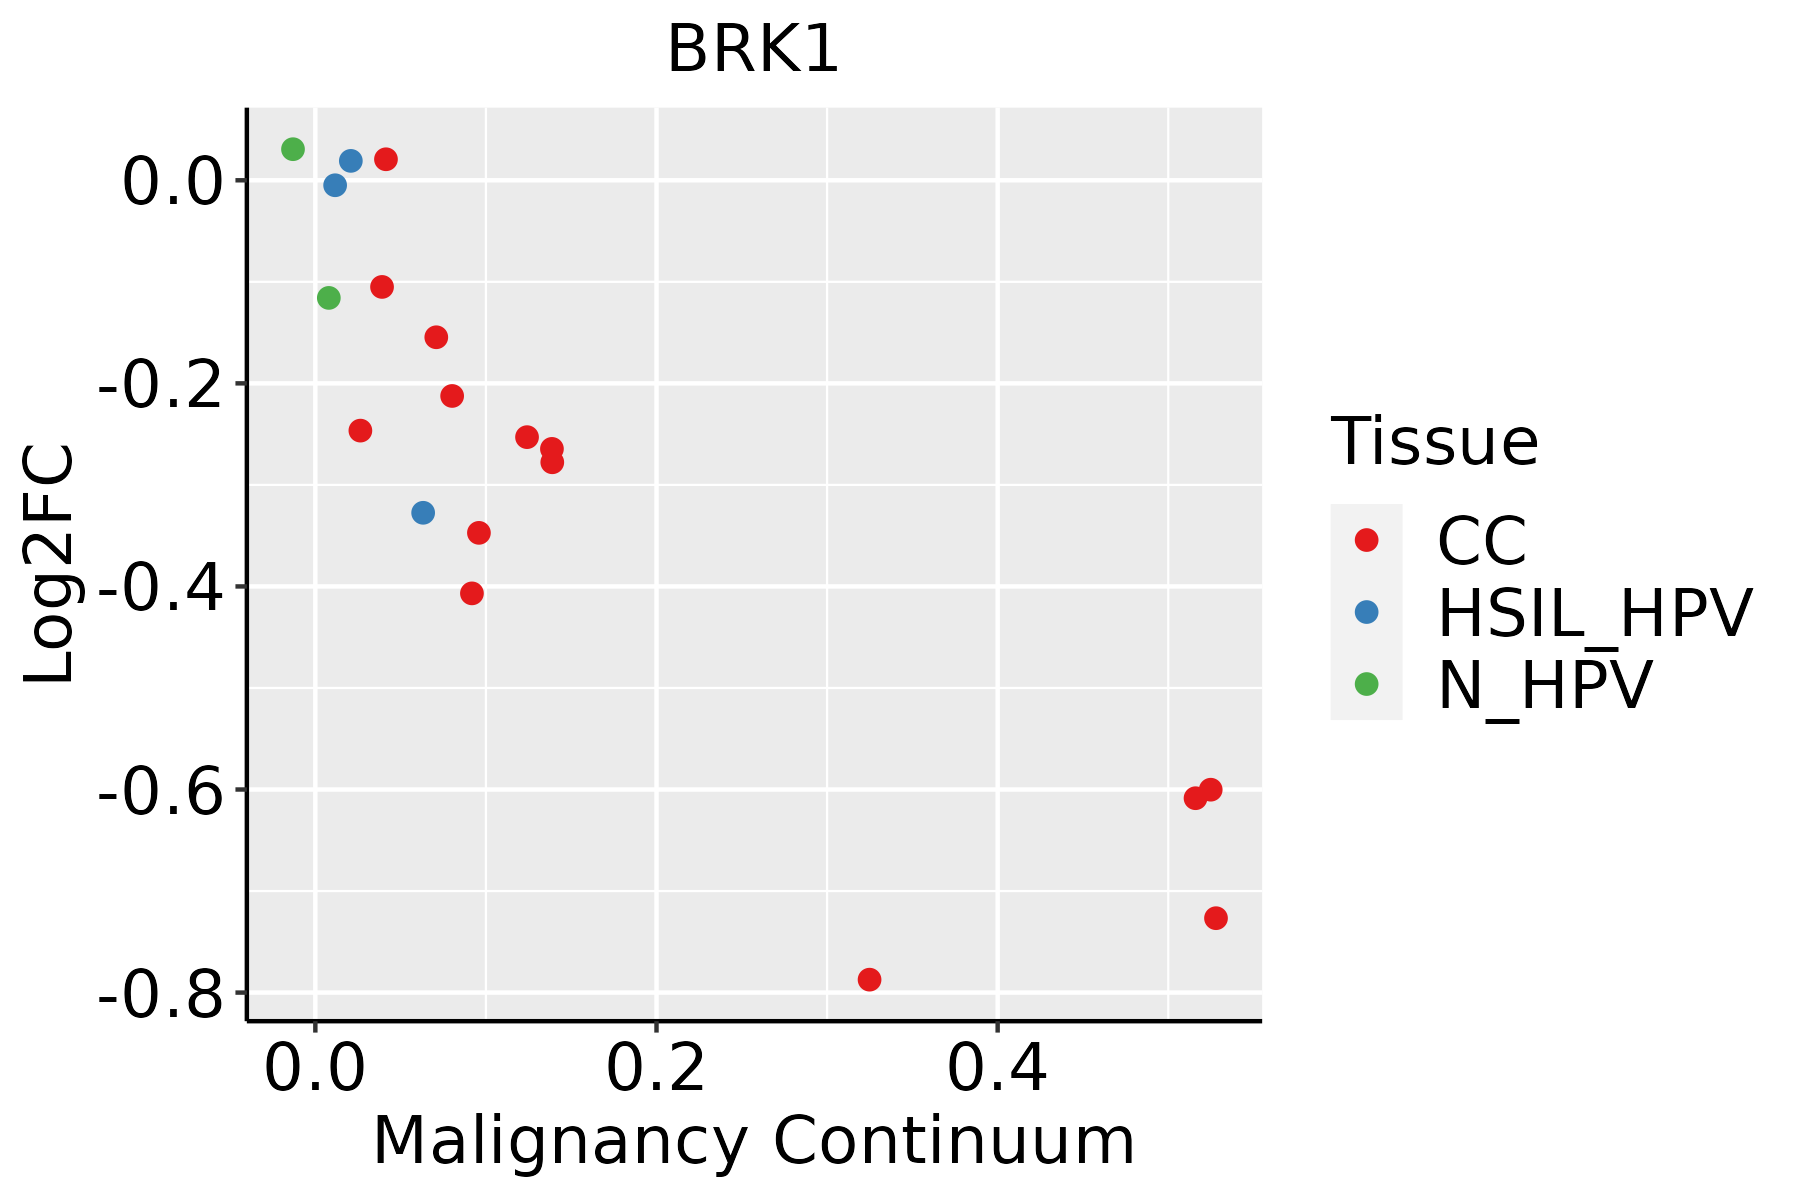 | CC: Cervix cancer |
| HSIL_HPV: HPV-infected high-grade squamous intraepithelial lesions | ||
| N_HPV: HPV-infected normal cervix | ||
| Colorectum (GSE201348) |  | FAP: Familial adenomatous polyposis |
| CRC: Colorectal cancer | ||
| Colorectum (HTA11) |  | AD: Adenomas |
| SER: Sessile serrated lesions | ||
| MSI-H: Microsatellite-high colorectal cancer | ||
| MSS: Microsatellite stable colorectal cancer | ||
| Endometrium | 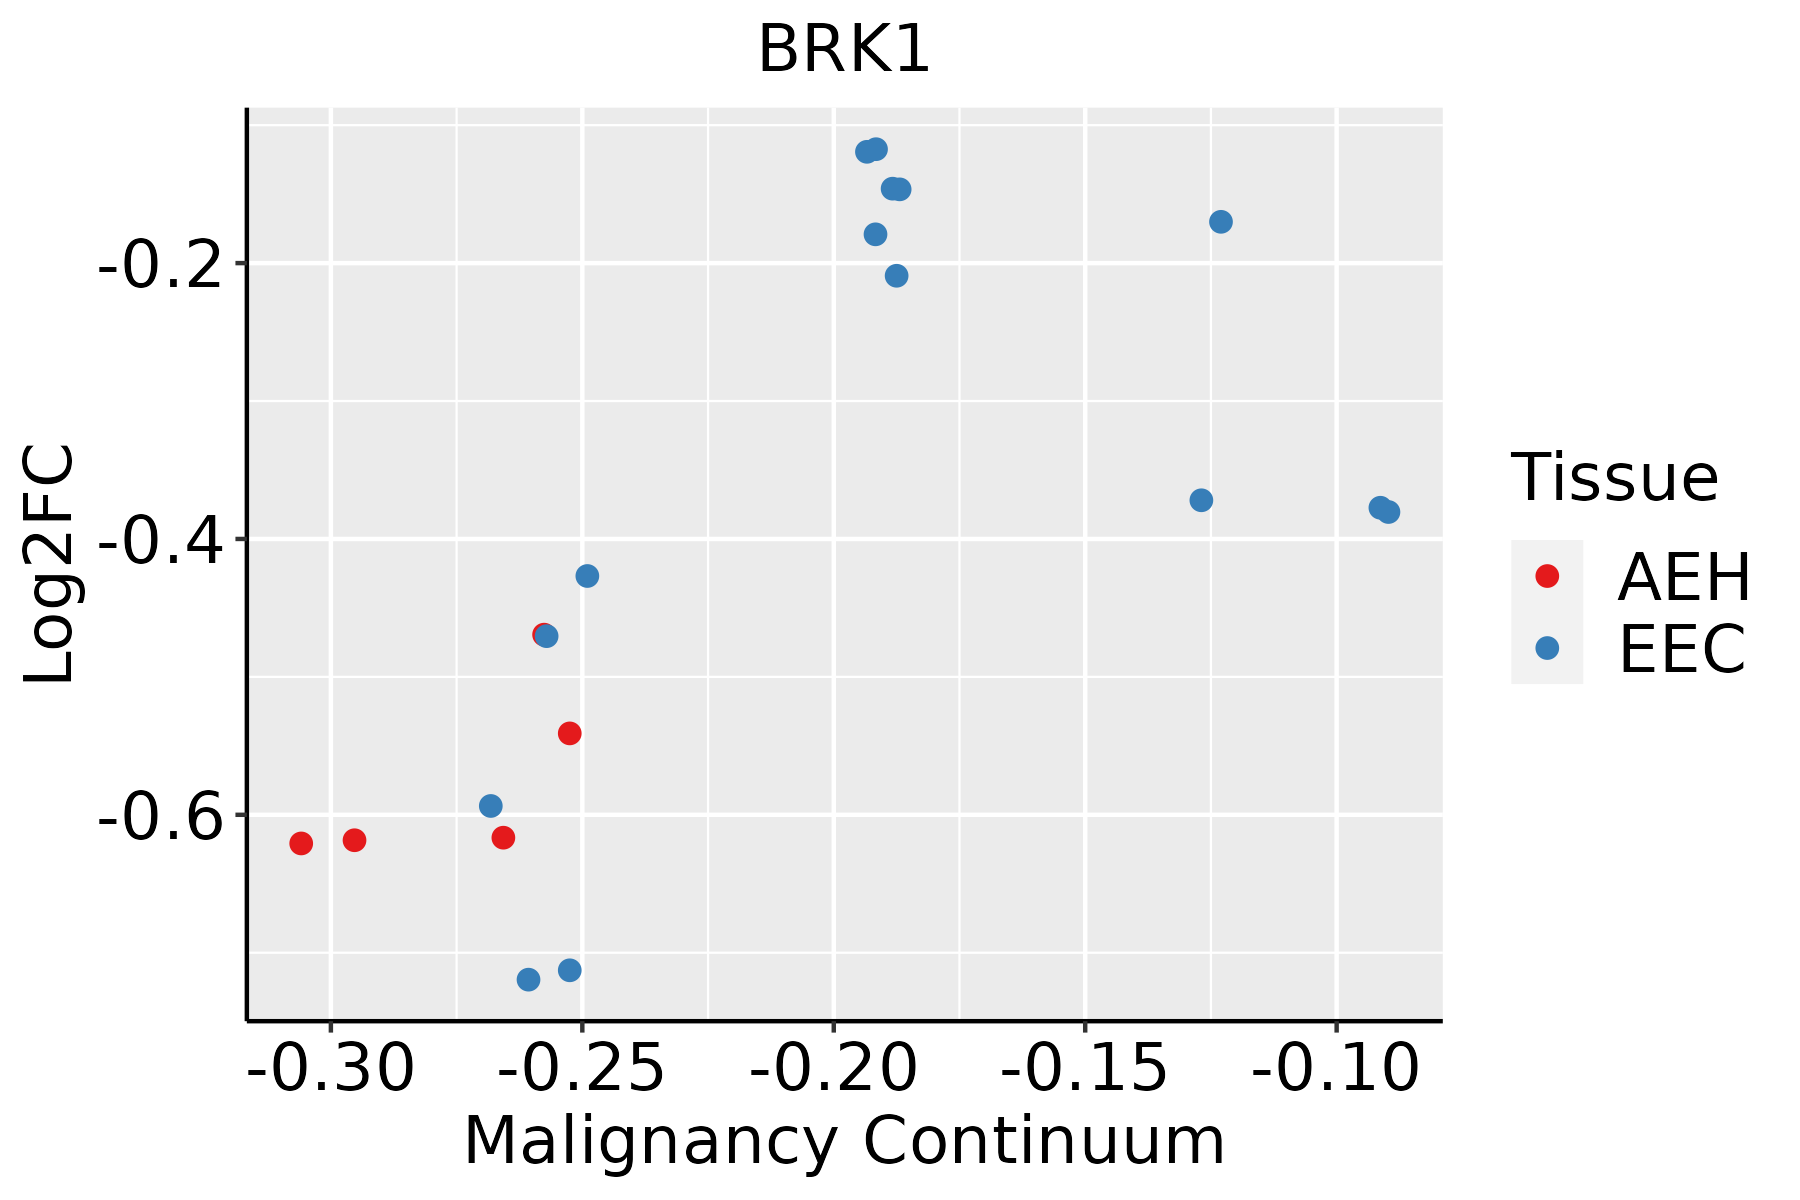 | AEH: Atypical endometrial hyperplasia |
| EEC: Endometrioid Cancer | ||
| Esophagus | 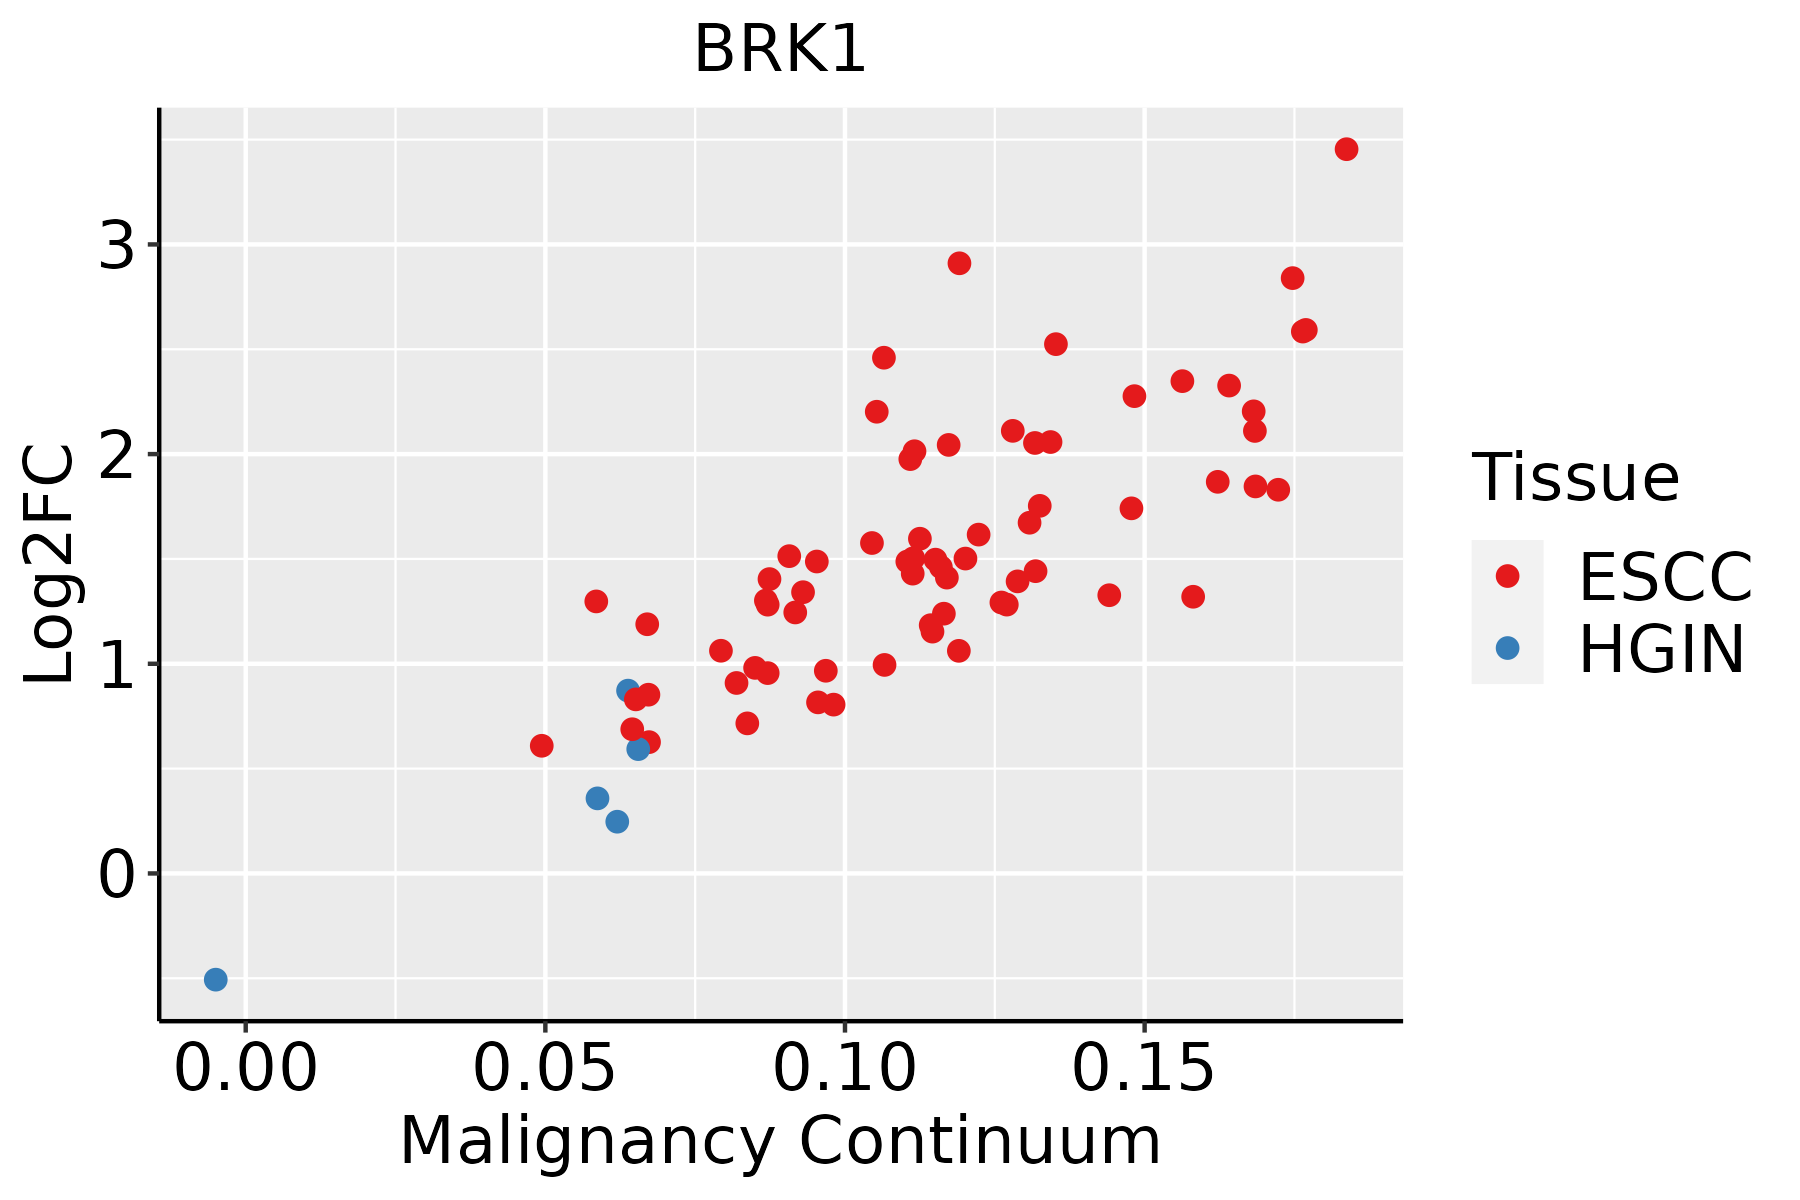 | ESCC: Esophageal squamous cell carcinoma |
| HGIN: High-grade intraepithelial neoplasias | ||
| LGIN: Low-grade intraepithelial neoplasias | ||
| GC |  | CAG: Chronic atrophic gastritis |
| CAG with IM: Chronic atrophic gastritis with intestinal metaplasia | ||
| CSG: Chronic superficial gastritis | ||
| GC: Gastric cancer | ||
| SIM: Severe intestinal metaplasia | ||
| WIM: Wild intestinal metaplasia | ||
| Liver | 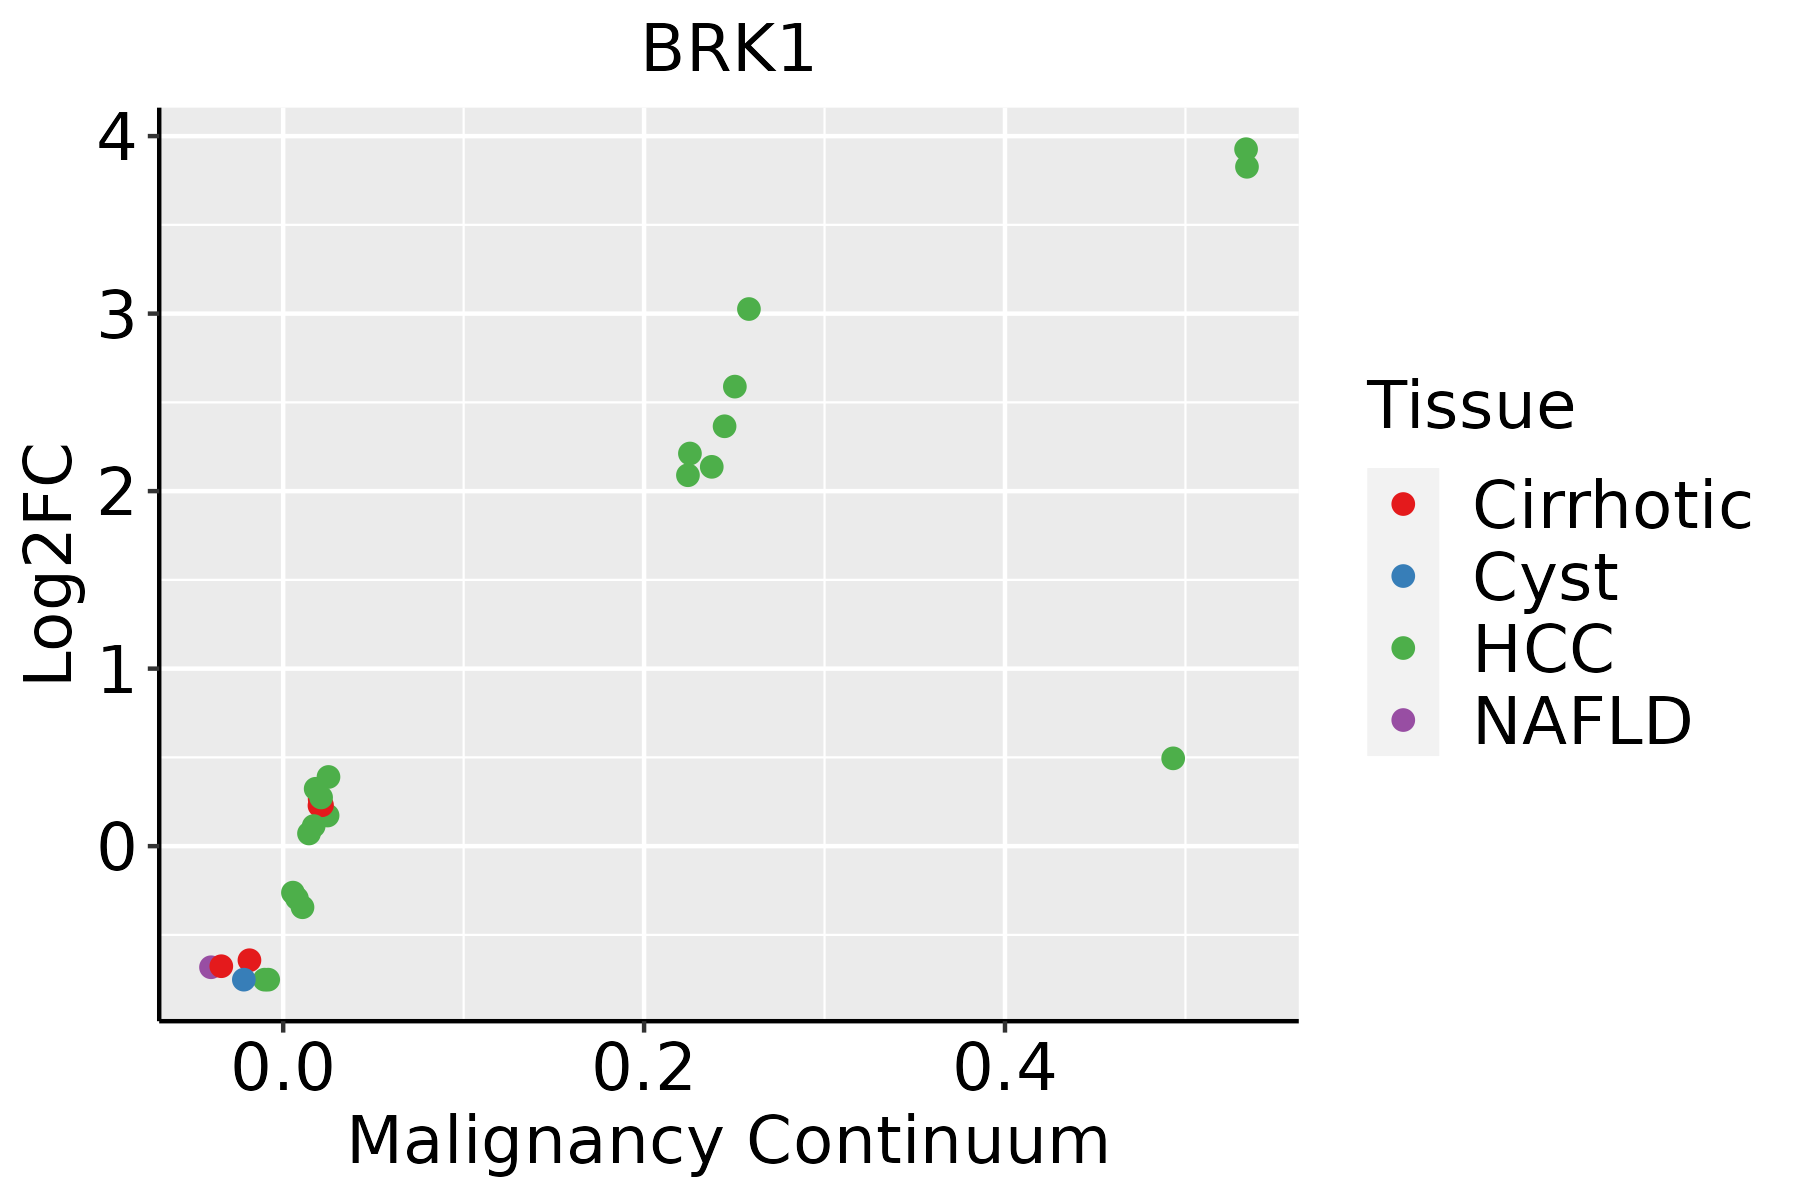 | HCC: Hepatocellular carcinoma |
| NAFLD: Non-alcoholic fatty liver disease | ||
| Oral Cavity |  | EOLP: Erosive Oral lichen planus |
| LP: leukoplakia | ||
| NEOLP: Non-erosive oral lichen planus | ||
| OSCC: Oral squamous cell carcinoma | ||
| Prostate | 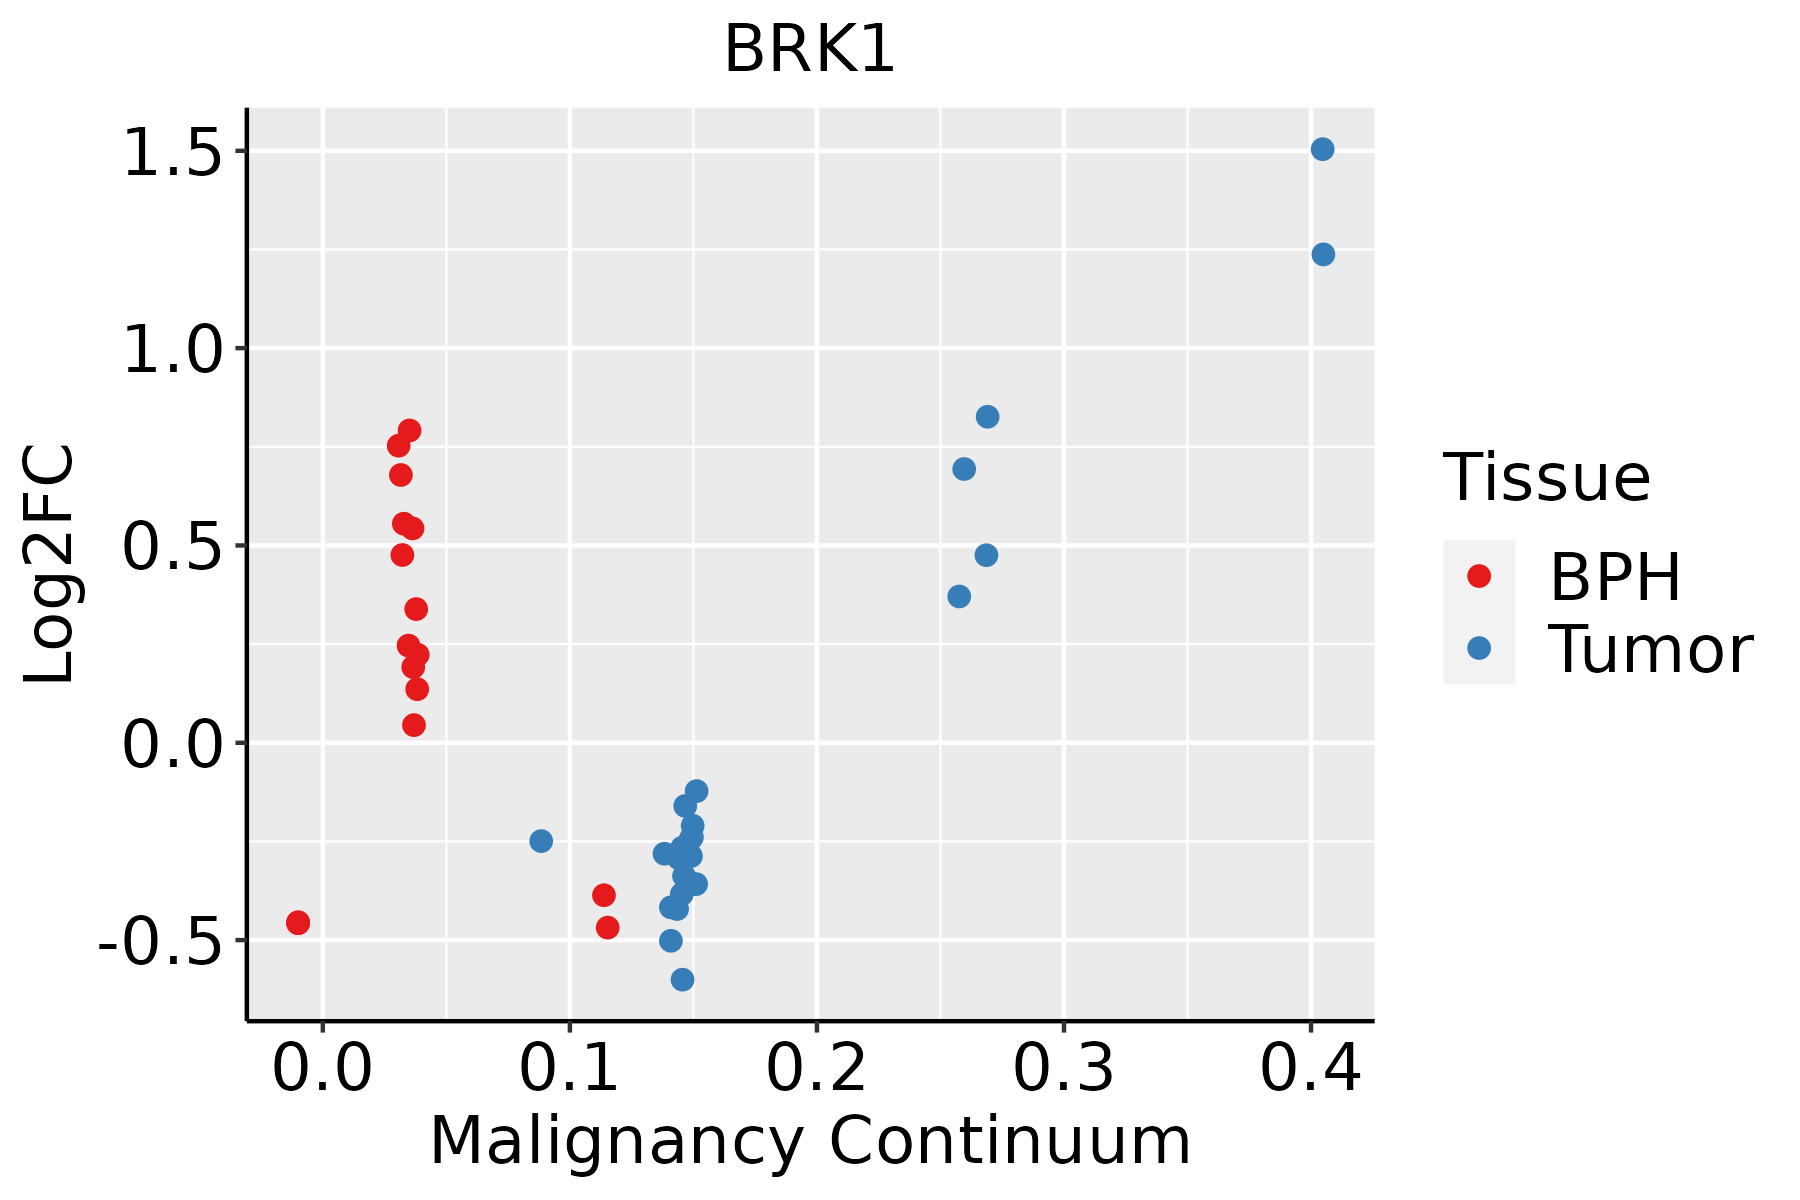 | BPH: Benign Prostatic Hyperplasia |
| Skin | 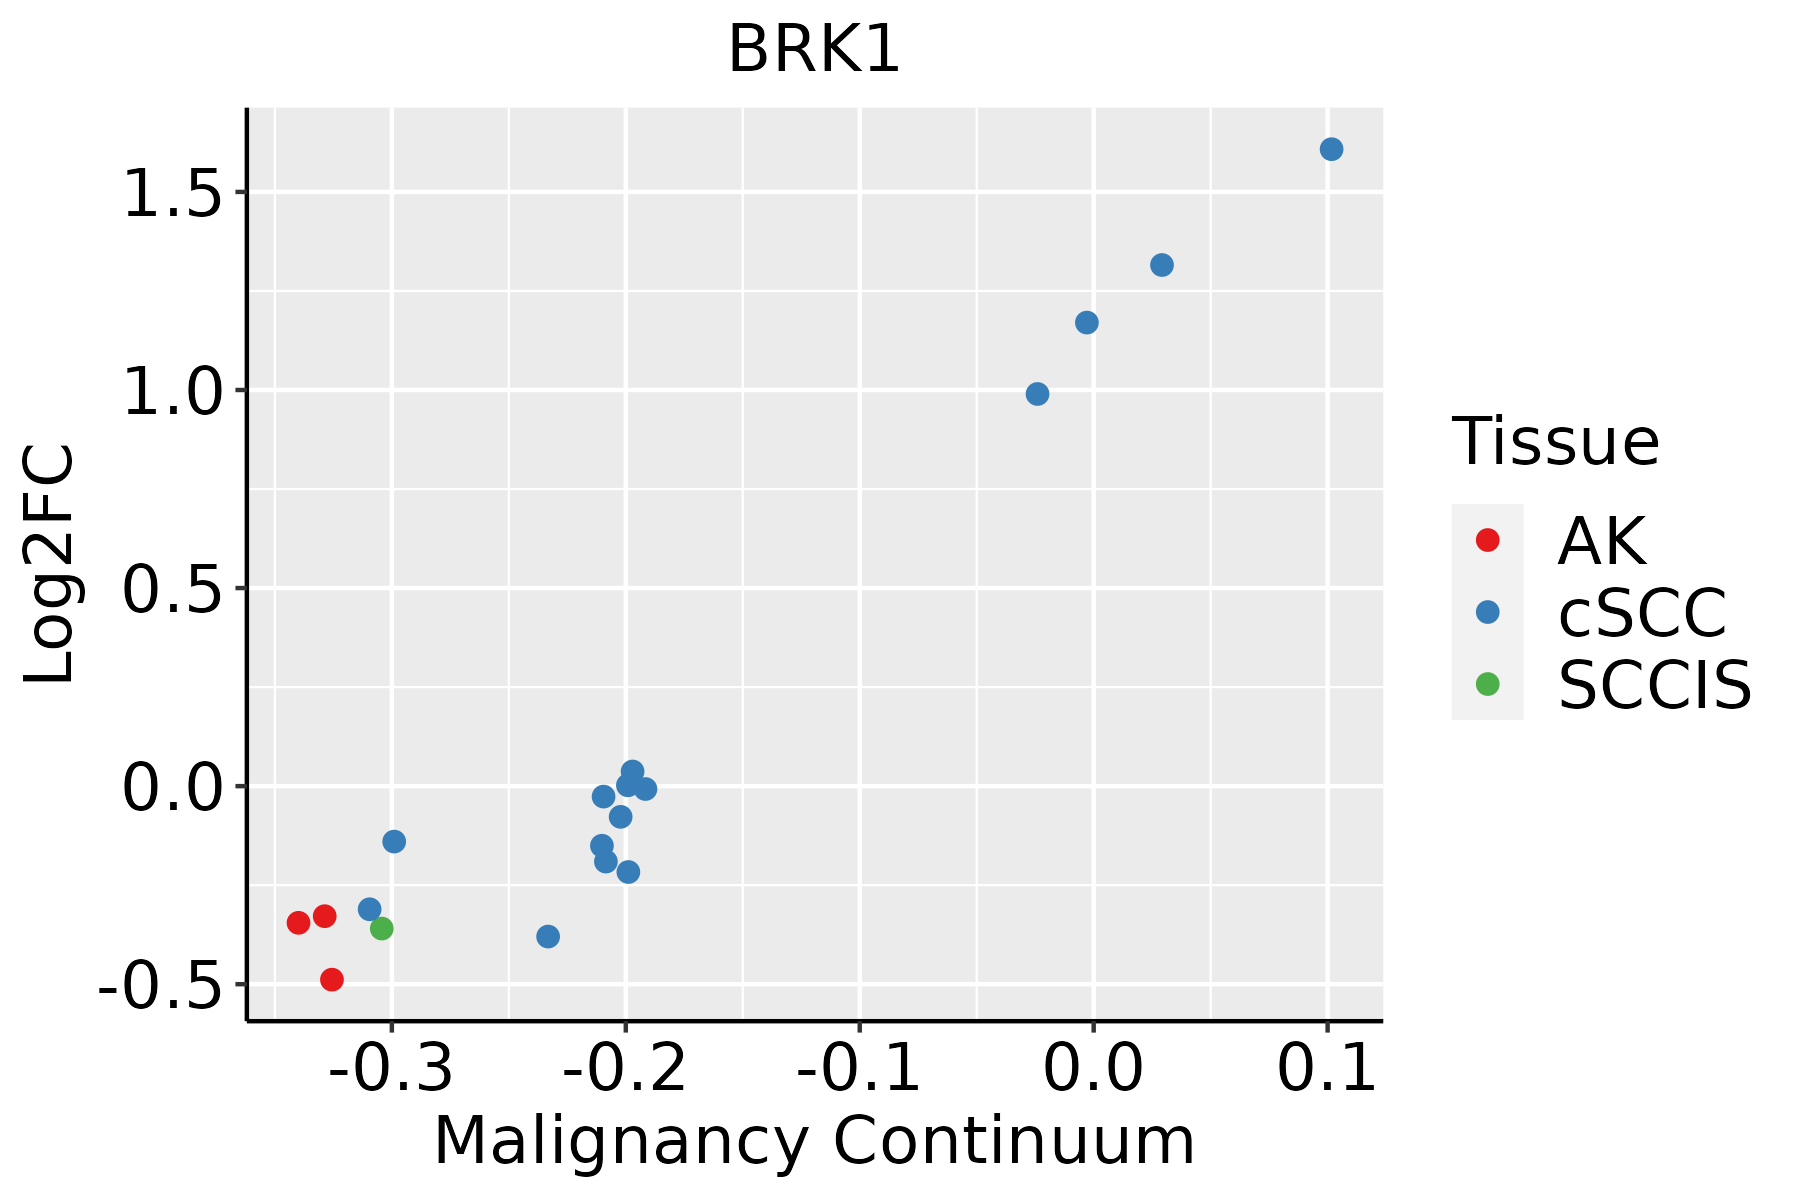 | AK: Actinic keratosis |
| cSCC: Cutaneous squamous cell carcinoma | ||
| SCCIS:squamous cell carcinoma in situ | ||
| Thyroid | 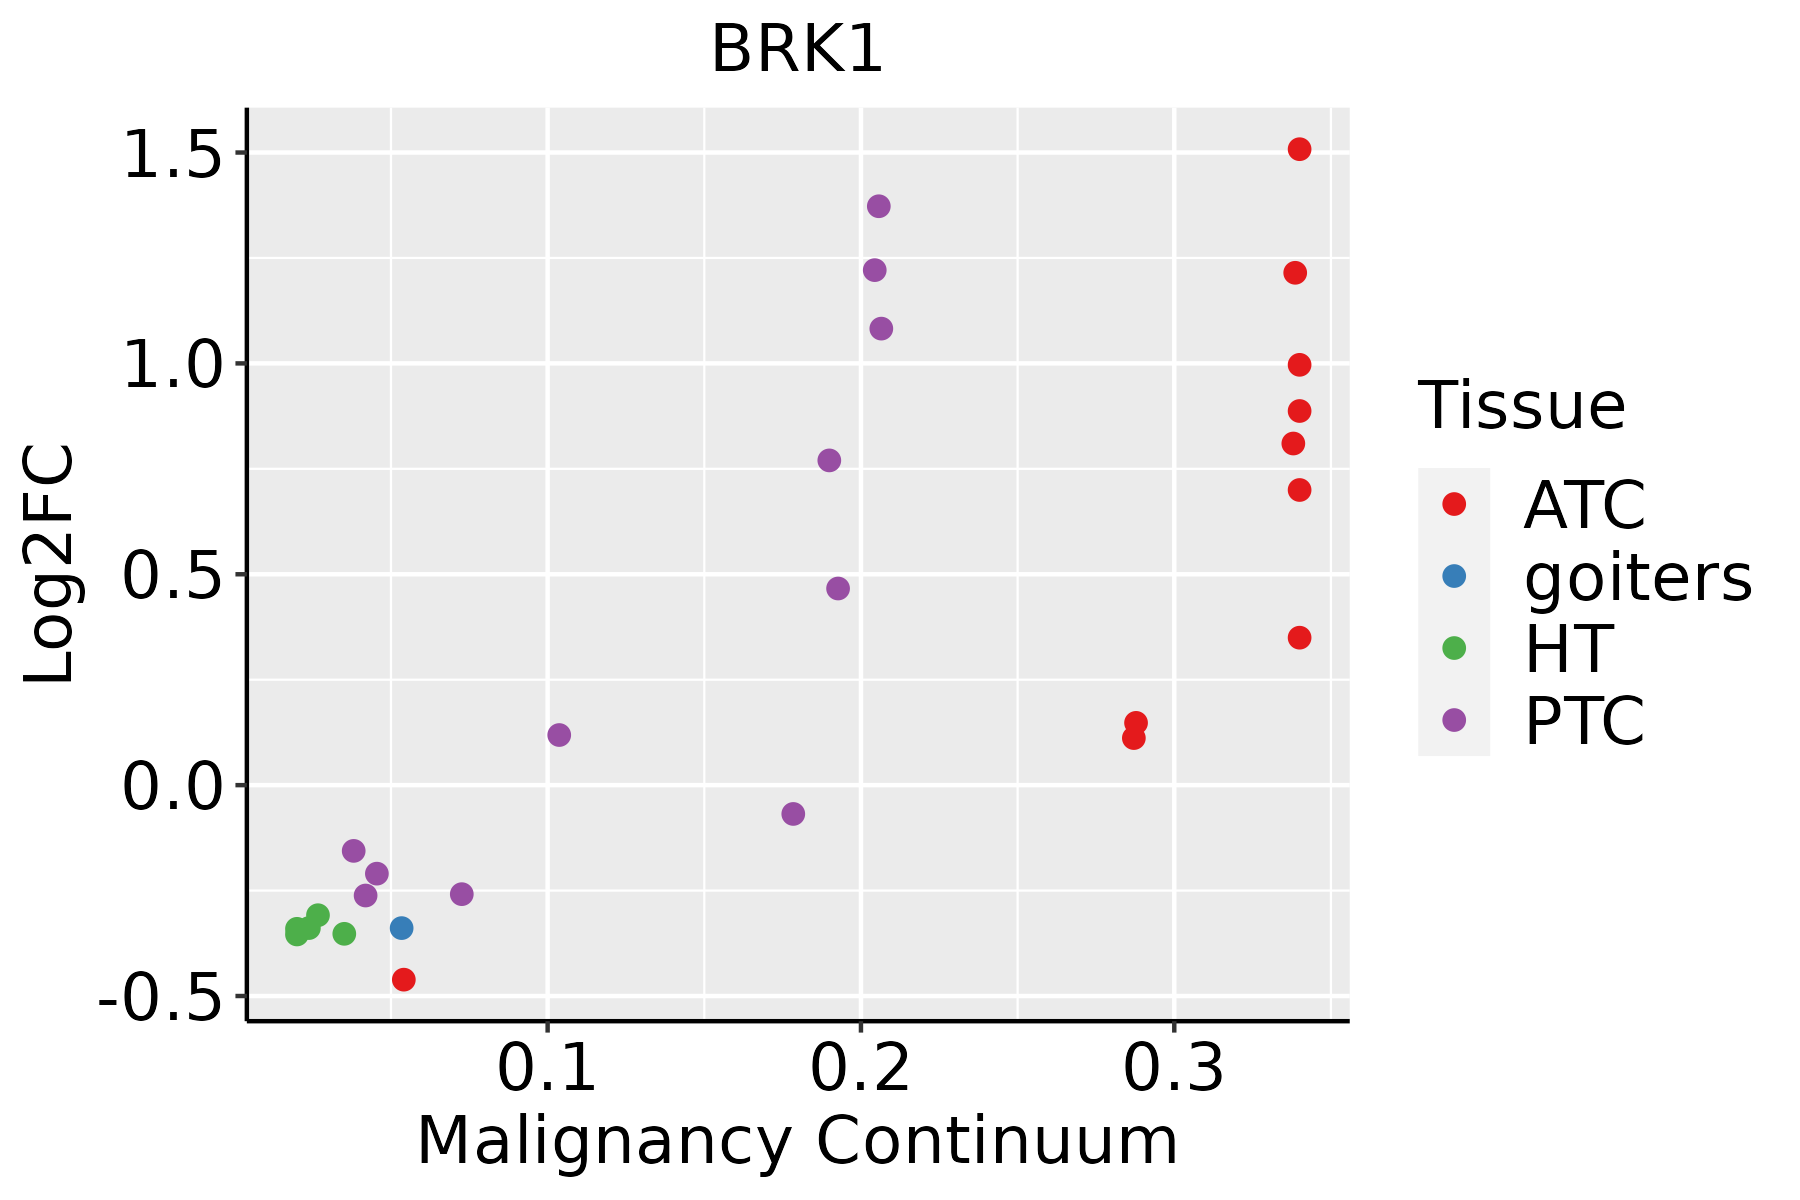 | ATC: Anaplastic thyroid cancer |
| HT: Hashimoto's thyroiditis | ||
| PTC: Papillary thyroid cancer |
| ∗log2FC in expression of this searched gene in stem-like cells from each diseased tissue sample relative to stem-like cells in normal samples in each tissue plotted against the malignancy continuum. Samples are colored based on if they are from different disease stage. |
Top |
Malignant transformation related pathway analysis |
| Find out the enriched GO biological processes and KEGG pathways involved in transition from healthy to precancer to cancer |
| Tissue | Disease Stage | Enriched GO biological Processes |
| Colorectum | AD |  |
| Colorectum | SER |  |
| Colorectum | MSS |  |
| Colorectum | MSI-H |  |
| Colorectum | FAP |  |
| ∗Top 15 enriched GO BP terms are showed in the bar plot of each disease state in each tissue. Each row represents a significant GO biological process which is colored according to the -log10(p.adjust). |
| Page: 1 2 3 4 5 6 7 8 9 |
| GO ID | Tissue | Disease Stage | Description | Gene Ratio | Bg Ratio | pvalue | p.adjust | Count |
| GO:0051125 | Colorectum | AD | regulation of actin nucleation | 15/3918 | 30/18723 | 3.85e-04 | 4.39e-03 | 15 |
| GO:0010591 | Colorectum | AD | regulation of lamellipodium assembly | 18/3918 | 42/18723 | 1.09e-03 | 1.01e-02 | 18 |
| GO:0030032 | Colorectum | AD | lamellipodium assembly | 26/3918 | 72/18723 | 2.12e-03 | 1.68e-02 | 26 |
| GO:0051127 | Colorectum | AD | positive regulation of actin nucleation | 8/3918 | 15/18723 | 5.67e-03 | 3.64e-02 | 8 |
| GO:0034315 | Colorectum | AD | regulation of Arp2/3 complex-mediated actin nucleation | 10/3918 | 21/18723 | 5.71e-03 | 3.64e-02 | 10 |
| GO:0120034 | Colorectum | AD | positive regulation of plasma membrane bounded cell projection assembly | 33/3918 | 105/18723 | 7.49e-03 | 4.55e-02 | 33 |
| GO:0120032 | Colorectum | AD | regulation of plasma membrane bounded cell projection assembly | 53/3918 | 186/18723 | 8.51e-03 | 4.97e-02 | 53 |
| GO:00070151 | Colorectum | SER | actin filament organization | 134/2897 | 442/18723 | 1.39e-15 | 5.70e-13 | 134 |
| GO:00325351 | Colorectum | SER | regulation of cellular component size | 115/2897 | 383/18723 | 3.04e-13 | 1.10e-10 | 115 |
| GO:00081541 | Colorectum | SER | actin polymerization or depolymerization | 77/2897 | 218/18723 | 3.50e-13 | 1.19e-10 | 77 |
| GO:01100531 | Colorectum | SER | regulation of actin filament organization | 91/2897 | 278/18723 | 4.33e-13 | 1.40e-10 | 91 |
| GO:00300411 | Colorectum | SER | actin filament polymerization | 70/2897 | 191/18723 | 5.39e-13 | 1.65e-10 | 70 |
| GO:00080641 | Colorectum | SER | regulation of actin polymerization or depolymerization | 69/2897 | 188/18723 | 7.29e-13 | 1.95e-10 | 69 |
| GO:19029031 | Colorectum | SER | regulation of supramolecular fiber organization | 114/2897 | 383/18723 | 7.32e-13 | 1.95e-10 | 114 |
| GO:00308321 | Colorectum | SER | regulation of actin filament length | 69/2897 | 189/18723 | 9.76e-13 | 2.39e-10 | 69 |
| GO:00308331 | Colorectum | SER | regulation of actin filament polymerization | 64/2897 | 172/18723 | 2.42e-12 | 5.70e-10 | 64 |
| GO:00329701 | Colorectum | SER | regulation of actin filament-based process | 115/2897 | 397/18723 | 4.16e-12 | 8.80e-10 | 115 |
| GO:00322711 | Colorectum | SER | regulation of protein polymerization | 78/2897 | 233/18723 | 5.71e-12 | 1.17e-09 | 78 |
| GO:00512581 | Colorectum | SER | protein polymerization | 91/2897 | 297/18723 | 2.72e-11 | 5.06e-09 | 91 |
| GO:00432541 | Colorectum | SER | regulation of protein-containing complex assembly | 119/2897 | 428/18723 | 3.34e-11 | 5.86e-09 | 119 |
| Page: 1 2 3 4 5 6 7 8 9 10 11 12 13 14 15 16 17 18 19 20 21 22 23 24 25 26 27 28 29 30 31 32 33 34 35 36 37 38 |
| Pathway ID | Tissue | Disease Stage | Description | Gene Ratio | Bg Ratio | pvalue | p.adjust | qvalue | Count |
| hsa0513218 | Breast | Precancer | Salmonella infection | 49/684 | 249/8465 | 2.92e-09 | 6.15e-08 | 4.71e-08 | 49 |
| hsa0513018 | Breast | Precancer | Pathogenic Escherichia coli infection | 38/684 | 197/8465 | 3.12e-07 | 5.81e-06 | 4.45e-06 | 38 |
| hsa0513219 | Breast | Precancer | Salmonella infection | 49/684 | 249/8465 | 2.92e-09 | 6.15e-08 | 4.71e-08 | 49 |
| hsa0513019 | Breast | Precancer | Pathogenic Escherichia coli infection | 38/684 | 197/8465 | 3.12e-07 | 5.81e-06 | 4.45e-06 | 38 |
| hsa0513224 | Breast | IDC | Salmonella infection | 55/867 | 249/8465 | 2.07e-08 | 4.49e-07 | 3.36e-07 | 55 |
| hsa0513024 | Breast | IDC | Pathogenic Escherichia coli infection | 42/867 | 197/8465 | 2.66e-06 | 3.92e-05 | 2.94e-05 | 42 |
| hsa0481014 | Breast | IDC | Regulation of actin cytoskeleton | 36/867 | 229/8465 | 5.79e-03 | 3.13e-02 | 2.34e-02 | 36 |
| hsa0513234 | Breast | IDC | Salmonella infection | 55/867 | 249/8465 | 2.07e-08 | 4.49e-07 | 3.36e-07 | 55 |
| hsa0513034 | Breast | IDC | Pathogenic Escherichia coli infection | 42/867 | 197/8465 | 2.66e-06 | 3.92e-05 | 2.94e-05 | 42 |
| hsa0481015 | Breast | IDC | Regulation of actin cytoskeleton | 36/867 | 229/8465 | 5.79e-03 | 3.13e-02 | 2.34e-02 | 36 |
| hsa0513243 | Breast | DCIS | Salmonella infection | 55/846 | 249/8465 | 8.71e-09 | 1.87e-07 | 1.38e-07 | 55 |
| hsa0513043 | Breast | DCIS | Pathogenic Escherichia coli infection | 42/846 | 197/8465 | 1.40e-06 | 2.15e-05 | 1.59e-05 | 42 |
| hsa0481023 | Breast | DCIS | Regulation of actin cytoskeleton | 35/846 | 229/8465 | 6.89e-03 | 3.37e-02 | 2.48e-02 | 35 |
| hsa0513253 | Breast | DCIS | Salmonella infection | 55/846 | 249/8465 | 8.71e-09 | 1.87e-07 | 1.38e-07 | 55 |
| hsa0513053 | Breast | DCIS | Pathogenic Escherichia coli infection | 42/846 | 197/8465 | 1.40e-06 | 2.15e-05 | 1.59e-05 | 42 |
| hsa0481033 | Breast | DCIS | Regulation of actin cytoskeleton | 35/846 | 229/8465 | 6.89e-03 | 3.37e-02 | 2.48e-02 | 35 |
| hsa0513020 | Cervix | CC | Pathogenic Escherichia coli infection | 63/1267 | 197/8465 | 9.28e-10 | 2.00e-08 | 1.19e-08 | 63 |
| hsa0513220 | Cervix | CC | Salmonella infection | 74/1267 | 249/8465 | 1.33e-09 | 2.54e-08 | 1.50e-08 | 74 |
| hsa0481016 | Cervix | CC | Regulation of actin cytoskeleton | 64/1267 | 229/8465 | 2.24e-07 | 2.59e-06 | 1.53e-06 | 64 |
| hsa05130110 | Cervix | CC | Pathogenic Escherichia coli infection | 63/1267 | 197/8465 | 9.28e-10 | 2.00e-08 | 1.19e-08 | 63 |
| Page: 1 2 3 4 5 6 7 |
Top |
Cell-cell communication analysis |
| Identification of potential cell-cell interactions between two cell types and their ligand-receptor pairs for different disease states |
| Ligand | Receptor | LRpair | Pathway | Tissue | Disease Stage |
| Page: 1 |
Top |
Single-cell gene regulatory network inference analysis |
| Find out the significant the regulons (TFs) and the target genes of each regulon across cell types for different disease states |
| TF | Cell Type | Tissue | Disease Stage | Target Gene | RSS | Regulon Activity |
| ∗The dot plots of a searched regulon are shown for all cell subpopulations in each disease state of each tissue based on the regulon specific score inferred using pySCENIC and by calculating the average expression. |
| Page: 1 |
Top |
Somatic mutation of malignant transformation related genes |
| Annotation of somatic variants for genes involved in malignant transformation |
| Hugo Symbol | Variant Class | Variant Classification | dbSNP RS | HGVSc | HGVSp | HGVSp Short | SWISSPROT | BIOTYPE | SIFT | PolyPhen | Tumor Sample Barcode | Tissue | Histology | Sex | Age | Stage | Therapy Types | Drugs | Outcome |
| BRK1 | SNV | Missense_Mutation | c.55N>T | p.Arg19Trp | p.R19W | Q8WUW1 | protein_coding | deleterious(0.04) | probably_damaging(1) | TCGA-B6-A0WX-01 | Breast | breast invasive carcinoma | Female | <65 | III/IV | Unknown | Unknown | PD | |
| BRK1 | SNV | Missense_Mutation | novel | c.128G>T | p.Cys43Phe | p.C43F | Q8WUW1 | protein_coding | deleterious(0) | probably_damaging(0.983) | TCGA-BH-A0HO-01 | Breast | breast invasive carcinoma | Female | <65 | I/II | Chemotherapy | cyclophosphamide | SD |
| BRK1 | SNV | Missense_Mutation | c.156N>T | p.Glu52Asp | p.E52D | Q8WUW1 | protein_coding | tolerated(0.26) | benign(0.003) | TCGA-AX-A0J0-01 | Endometrium | uterine corpus endometrioid carcinoma | Female | <65 | I/II | Unknown | Unknown | SD | |
| BRK1 | SNV | Missense_Mutation | rs746376520 | c.176N>A | p.Arg59Gln | p.R59Q | Q8WUW1 | protein_coding | tolerated(0.2) | benign(0.027) | TCGA-B5-A11Y-01 | Endometrium | uterine corpus endometrioid carcinoma | Female | <65 | I/II | Unknown | Unknown | SD |
| BRK1 | SNV | Missense_Mutation | novel | c.94N>G | p.Ile32Val | p.I32V | Q8WUW1 | protein_coding | tolerated(0.11) | possibly_damaging(0.678) | TCGA-CN-6016-01 | Oral cavity | head & neck squamous cell carcinoma | Male | <65 | I/II | Chemotherapy | carboplatin | SD |
| BRK1 | SNV | Missense_Mutation | novel | c.223A>G | p.Thr75Ala | p.T75A | Q8WUW1 | protein_coding | deleterious(0.01) | benign(0.088) | TCGA-D7-A6EY-01 | Stomach | stomach adenocarcinoma | Female | >=65 | III/IV | Unknown | Unknown | PD |
| Page: 1 |
Top |
Related drugs of malignant transformation related genes |
| Identification of chemicals and drugs interact with genes involved in malignant transfromation |
| (DGIdb 4.0) |
| Entrez ID | Symbol | Category | Interaction Types | Drug Claim Name | Drug Name | PMIDs |
| Page: 1 |

Copyright 2023-Present -The University of Texas Health Science Center at Houston |