
|
|||||
|
 | |
| |
| |
| |
| |
| |
|
Gene: BCAR3 |
Gene summary for BCAR3 |
| Gene information | Species | Human | Gene symbol | BCAR3 | Gene ID | 8412 |
| Gene name | BCAR3 adaptor protein, NSP family member | |
| Gene Alias | AND-34 | |
| Cytomap | 1p22.1 | |
| Gene Type | protein-coding | GO ID | GO:0000165 | UniProtAcc | O75815 |
Top |
Malignant transformation analysis |
| Identification of the aberrant gene expression in precancerous and cancerous lesions by comparing the gene expression of stem-like cells in diseased tissues with normal stem cells |
| Entrez ID | Symbol | Replicates | Species | Organ | Tissue | Adj P-value | Log2FC | Malignancy |
| 8412 | BCAR3 | CCI_1 | Human | Cervix | CC | 2.23e-08 | 8.22e-01 | 0.528 |
| 8412 | BCAR3 | CCI_3 | Human | Cervix | CC | 7.33e-12 | 6.34e-01 | 0.516 |
| 8412 | BCAR3 | sample3 | Human | Cervix | CC | 4.86e-03 | 1.76e-01 | 0.1387 |
| 8412 | BCAR3 | T3 | Human | Cervix | CC | 2.44e-04 | 1.43e-01 | 0.1389 |
| 8412 | BCAR3 | HTA11_347_2000001011 | Human | Colorectum | AD | 3.29e-09 | 4.29e-01 | -0.1954 |
| 8412 | BCAR3 | HTA11_866_2000001011 | Human | Colorectum | AD | 9.77e-07 | 2.10e-01 | -0.1001 |
| 8412 | BCAR3 | HTA11_7696_3000711011 | Human | Colorectum | AD | 1.95e-03 | 1.28e-01 | 0.0674 |
| 8412 | BCAR3 | A015-C-203 | Human | Colorectum | FAP | 4.02e-03 | -1.39e-01 | -0.1294 |
| 8412 | BCAR3 | A002-C-205 | Human | Colorectum | FAP | 2.60e-05 | -2.11e-01 | -0.1236 |
| 8412 | BCAR3 | A015-C-006 | Human | Colorectum | FAP | 2.04e-03 | -2.17e-01 | -0.0994 |
| 8412 | BCAR3 | A002-C-114 | Human | Colorectum | FAP | 4.02e-03 | -1.95e-01 | -0.1561 |
| 8412 | BCAR3 | A015-C-104 | Human | Colorectum | FAP | 1.71e-04 | -1.58e-01 | -0.1899 |
| 8412 | BCAR3 | A015-C-002 | Human | Colorectum | FAP | 1.47e-03 | -2.77e-01 | -0.0763 |
| 8412 | BCAR3 | A002-C-116 | Human | Colorectum | FAP | 6.23e-04 | -2.16e-01 | -0.0452 |
| 8412 | BCAR3 | A014-C-008 | Human | Colorectum | FAP | 3.74e-02 | -1.94e-01 | -0.191 |
| 8412 | BCAR3 | A018-E-020 | Human | Colorectum | FAP | 1.54e-04 | -2.13e-01 | -0.2034 |
| 8412 | BCAR3 | CRC-3-11773 | Human | Colorectum | CRC | 1.35e-02 | -2.17e-01 | 0.2564 |
| 8412 | BCAR3 | LZE24T | Human | Esophagus | ESCC | 2.90e-03 | 1.96e-01 | 0.0596 |
| 8412 | BCAR3 | LZE6T | Human | Esophagus | ESCC | 9.20e-03 | 6.31e-01 | 0.0845 |
| 8412 | BCAR3 | P2T-E | Human | Esophagus | ESCC | 1.50e-10 | 1.58e-01 | 0.1177 |
| Page: 1 2 3 4 |
| Tissue | Expression Dynamics | Abbreviation |
| Cervix |  | CC: Cervix cancer |
| HSIL_HPV: HPV-infected high-grade squamous intraepithelial lesions | ||
| N_HPV: HPV-infected normal cervix | ||
| Colorectum (GSE201348) |  | FAP: Familial adenomatous polyposis |
| CRC: Colorectal cancer | ||
| Colorectum (HTA11) |  | AD: Adenomas |
| SER: Sessile serrated lesions | ||
| MSI-H: Microsatellite-high colorectal cancer | ||
| MSS: Microsatellite stable colorectal cancer | ||
| Esophagus | 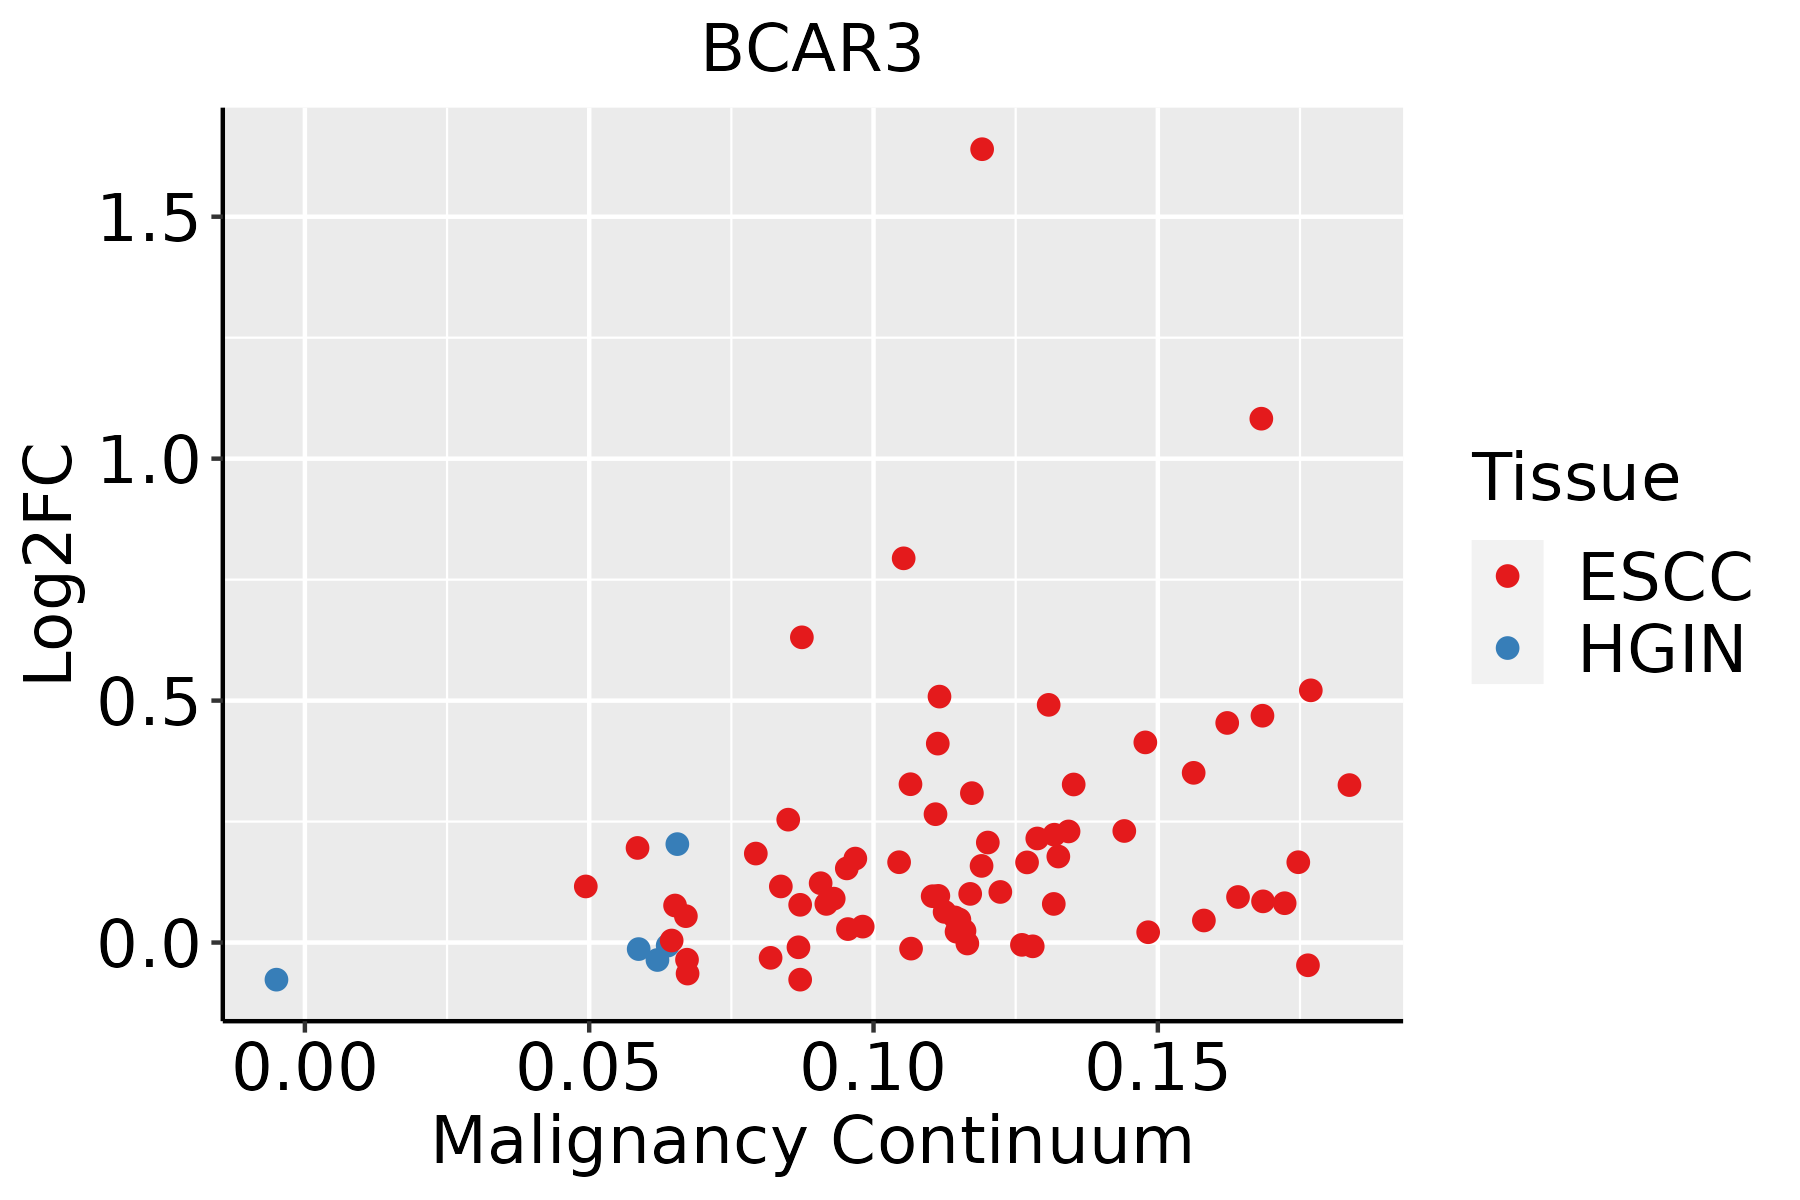 | ESCC: Esophageal squamous cell carcinoma |
| HGIN: High-grade intraepithelial neoplasias | ||
| LGIN: Low-grade intraepithelial neoplasias | ||
| Oral Cavity | 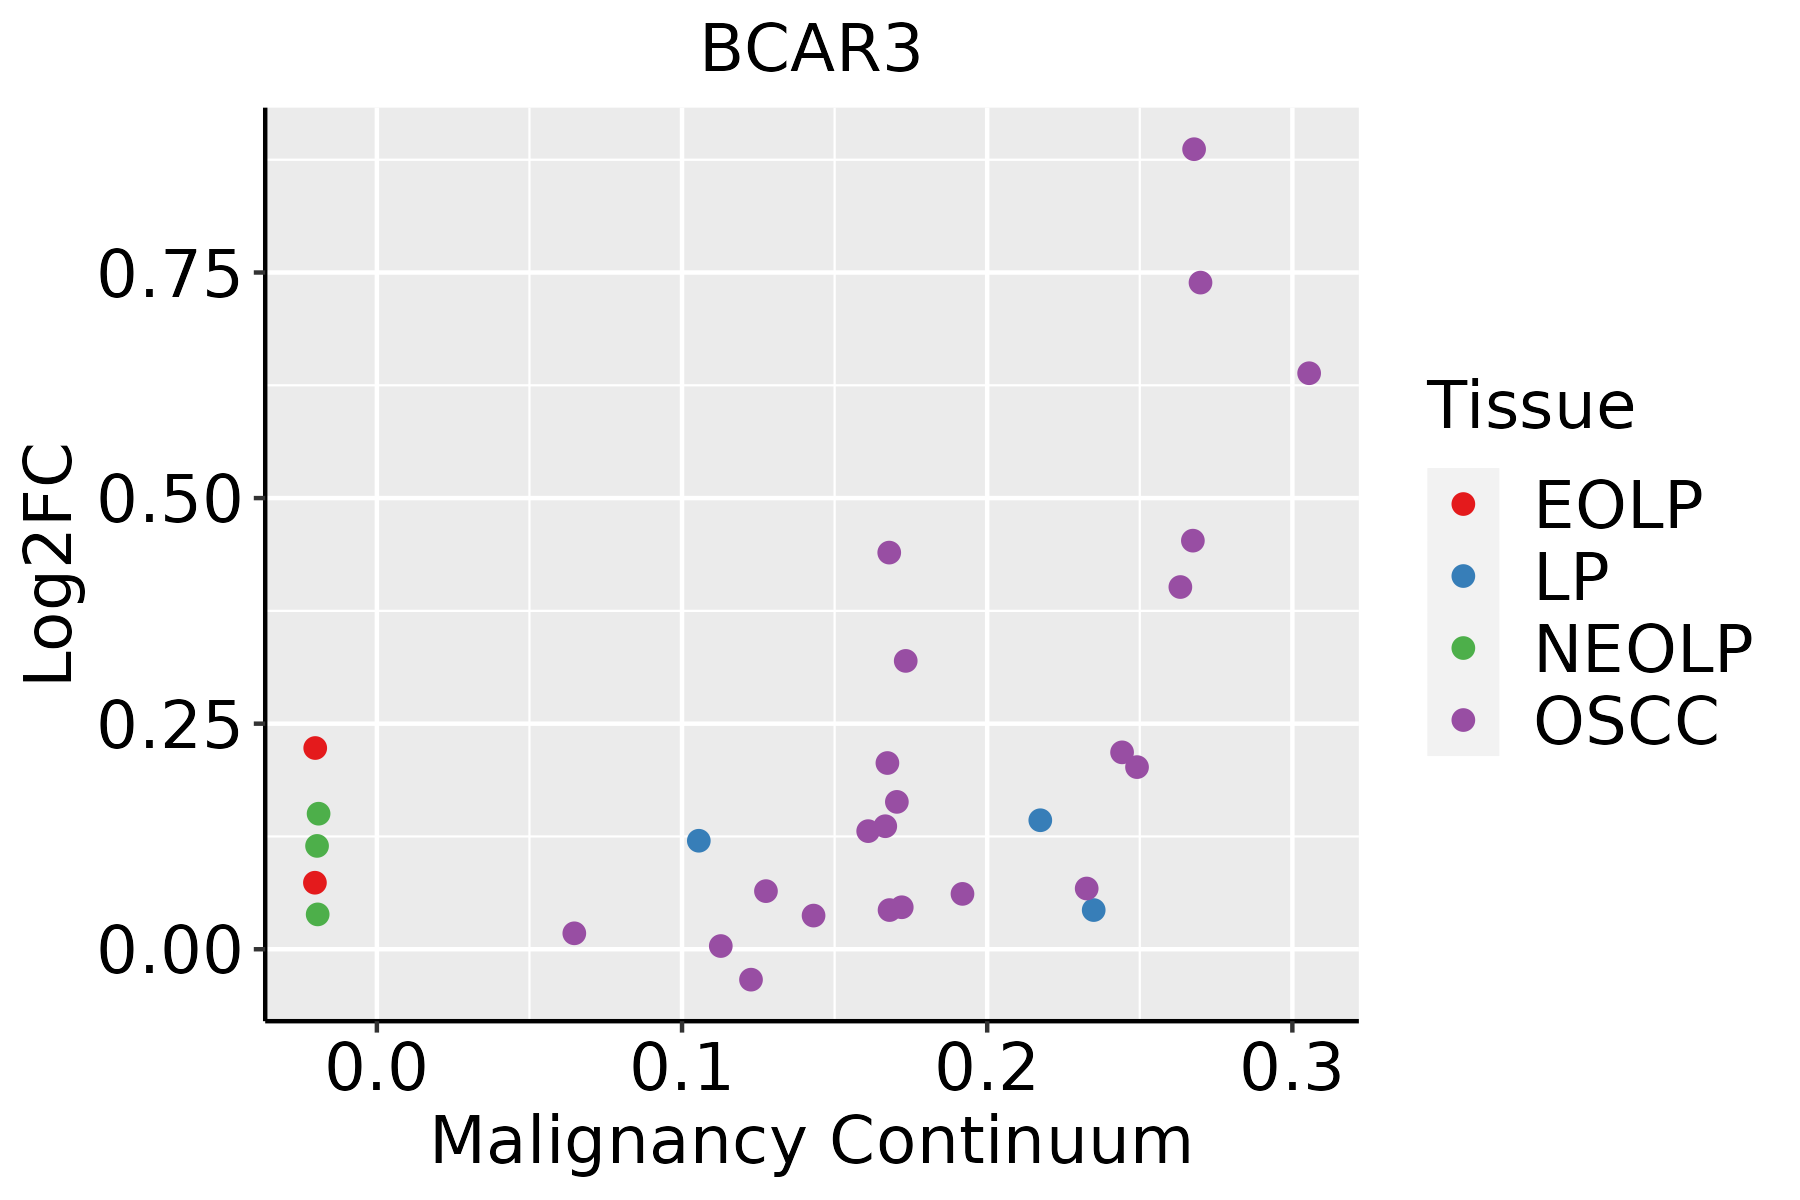 | EOLP: Erosive Oral lichen planus |
| LP: leukoplakia | ||
| NEOLP: Non-erosive oral lichen planus | ||
| OSCC: Oral squamous cell carcinoma |
| ∗log2FC in expression of this searched gene in stem-like cells from each diseased tissue sample relative to stem-like cells in normal samples in each tissue plotted against the malignancy continuum. Samples are colored based on if they are from different disease stage. |
Top |
Malignant transformation related pathway analysis |
| Find out the enriched GO biological processes and KEGG pathways involved in transition from healthy to precancer to cancer |
| Tissue | Disease Stage | Enriched GO biological Processes |
| Colorectum | AD |  |
| Colorectum | SER |  |
| Colorectum | MSS |  |
| Colorectum | MSI-H |  |
| Colorectum | FAP |  |
| ∗Top 15 enriched GO BP terms are showed in the bar plot of each disease state in each tissue. Each row represents a significant GO biological process which is colored according to the -log10(p.adjust). |
| Page: 1 2 3 4 5 6 7 8 9 |
| GO ID | Tissue | Disease Stage | Description | Gene Ratio | Bg Ratio | pvalue | p.adjust | Count |
| GO:000828615 | Oral cavity | EOLP | insulin receptor signaling pathway | 32/2218 | 116/18723 | 3.06e-06 | 6.70e-05 | 32 |
| GO:003812723 | Oral cavity | EOLP | ERBB signaling pathway | 31/2218 | 121/18723 | 2.21e-05 | 3.37e-04 | 31 |
| GO:004308714 | Oral cavity | EOLP | regulation of GTPase activity | 66/2218 | 348/18723 | 6.92e-05 | 8.55e-04 | 66 |
| GO:000717316 | Oral cavity | EOLP | epidermal growth factor receptor signaling pathway | 27/2218 | 108/18723 | 1.14e-04 | 1.27e-03 | 27 |
| GO:003313511 | Oral cavity | EOLP | regulation of peptidyl-serine phosphorylation | 33/2218 | 144/18723 | 1.33e-04 | 1.46e-03 | 33 |
| GO:190118422 | Oral cavity | EOLP | regulation of ERBB signaling pathway | 20/2218 | 79/18723 | 7.07e-04 | 5.78e-03 | 20 |
| GO:00435479 | Oral cavity | EOLP | positive regulation of GTPase activity | 47/2218 | 255/18723 | 1.34e-03 | 9.33e-03 | 47 |
| GO:00331381 | Oral cavity | EOLP | positive regulation of peptidyl-serine phosphorylation | 24/2218 | 108/18723 | 1.62e-03 | 1.08e-02 | 24 |
| GO:004205812 | Oral cavity | EOLP | regulation of epidermal growth factor receptor signaling pathway | 18/2218 | 73/18723 | 1.77e-03 | 1.16e-02 | 18 |
| GO:00016542 | Oral cavity | EOLP | eye development | 62/2218 | 371/18723 | 3.18e-03 | 1.85e-02 | 62 |
| GO:01500632 | Oral cavity | EOLP | visual system development | 62/2218 | 375/18723 | 4.07e-03 | 2.24e-02 | 62 |
| GO:00488802 | Oral cavity | EOLP | sensory system development | 62/2218 | 381/18723 | 5.82e-03 | 2.94e-02 | 62 |
| Page: 1 2 3 4 5 6 7 |
| Pathway ID | Tissue | Disease Stage | Description | Gene Ratio | Bg Ratio | pvalue | p.adjust | qvalue | Count |
| Page: 1 |
Top |
Cell-cell communication analysis |
| Identification of potential cell-cell interactions between two cell types and their ligand-receptor pairs for different disease states |
| Ligand | Receptor | LRpair | Pathway | Tissue | Disease Stage |
| Page: 1 |
Top |
Single-cell gene regulatory network inference analysis |
| Find out the significant the regulons (TFs) and the target genes of each regulon across cell types for different disease states |
| TF | Cell Type | Tissue | Disease Stage | Target Gene | RSS | Regulon Activity |
| ∗The dot plots of a searched regulon are shown for all cell subpopulations in each disease state of each tissue based on the regulon specific score inferred using pySCENIC and by calculating the average expression. |
| Page: 1 |
Top |
Somatic mutation of malignant transformation related genes |
| Annotation of somatic variants for genes involved in malignant transformation |
| Hugo Symbol | Variant Class | Variant Classification | dbSNP RS | HGVSc | HGVSp | HGVSp Short | SWISSPROT | BIOTYPE | SIFT | PolyPhen | Tumor Sample Barcode | Tissue | Histology | Sex | Age | Stage | Therapy Types | Drugs | Outcome |
| BCAR3 | SNV | Missense_Mutation | c.382G>A | p.Asp128Asn | p.D128N | O75815 | protein_coding | deleterious(0.01) | possibly_damaging(0.881) | TCGA-A2-A0CP-01 | Breast | breast invasive carcinoma | Female | <65 | I/II | Chemotherapy | cytoxan | SD | |
| BCAR3 | SNV | Missense_Mutation | c.538C>A | p.Leu180Met | p.L180M | O75815 | protein_coding | deleterious(0) | probably_damaging(0.992) | TCGA-A2-A0D2-01 | Breast | breast invasive carcinoma | Female | <65 | I/II | Chemotherapy | adriamycin | SD | |
| BCAR3 | SNV | Missense_Mutation | c.13N>C | p.Lys5Gln | p.K5Q | O75815 | protein_coding | deleterious_low_confidence(0) | possibly_damaging(0.82) | TCGA-A8-A06Z-01 | Breast | breast invasive carcinoma | Female | >=65 | I/II | Unknown | Unknown | SD | |
| BCAR3 | SNV | Missense_Mutation | c.1987G>A | p.Glu663Lys | p.E663K | O75815 | protein_coding | deleterious(0) | possibly_damaging(0.714) | TCGA-AC-A23H-01 | Breast | breast invasive carcinoma | Female | >=65 | I/II | Unknown | Unknown | PD | |
| BCAR3 | SNV | Missense_Mutation | novel | c.587N>G | p.Ala196Gly | p.A196G | O75815 | protein_coding | tolerated(0.1) | benign(0.297) | TCGA-AR-A5QQ-01 | Breast | breast invasive carcinoma | Female | >=65 | III/IV | Chemotherapy | carboplatin | PD |
| BCAR3 | SNV | Missense_Mutation | c.1428G>C | p.Leu476Phe | p.L476F | O75815 | protein_coding | deleterious(0.03) | benign(0.116) | TCGA-BH-A1F0-01 | Breast | breast invasive carcinoma | Female | >=65 | I/II | Unknown | Unknown | PD | |
| BCAR3 | SNV | Missense_Mutation | novel | c.193G>A | p.Asp65Asn | p.D65N | O75815 | protein_coding | tolerated(0.09) | benign(0.439) | TCGA-D8-A3Z5-01 | Breast | breast invasive carcinoma | Female | <65 | III/IV | Unknown | Unknown | SD |
| BCAR3 | SNV | Missense_Mutation | novel | c.1246N>T | p.Pro416Ser | p.P416S | O75815 | protein_coding | tolerated(0.16) | benign(0.012) | TCGA-LD-A74U-01 | Breast | breast invasive carcinoma | Female | >=65 | III/IV | Chemotherapy | taxotere | SD |
| BCAR3 | insertion | Frame_Shift_Ins | novel | c.1975_1976insAGTGCCCTGTTTCTCCTTGTGTG | p.Ile659LysfsTer12 | p.I659Kfs*12 | O75815 | protein_coding | TCGA-B6-A0RE-01 | Breast | breast invasive carcinoma | Female | <65 | I/II | Unknown | Unknown | SD | ||
| BCAR3 | deletion | Frame_Shift_Del | novel | c.409delG | p.Glu137SerfsTer8 | p.E137Sfs*8 | O75815 | protein_coding | TCGA-D8-A27V-01 | Breast | breast invasive carcinoma | Female | <65 | I/II | Hormone Therapy | tamoxiphen | SD |
| Page: 1 2 3 4 5 6 7 8 |
Top |
Related drugs of malignant transformation related genes |
| Identification of chemicals and drugs interact with genes involved in malignant transfromation |
| (DGIdb 4.0) |
| Entrez ID | Symbol | Category | Interaction Types | Drug Claim Name | Drug Name | PMIDs |
| 8412 | BCAR3 | KINASE | ANTIESTROGEN | 9582273 |
| Page: 1 |

Copyright 2023-Present -The University of Texas Health Science Center at Houston |