
|
|||||
|
 | |
| |
| |
| |
| |
| |
|
Gene: ATXN3 |
Gene summary for ATXN3 |
| Gene information | Species | Human | Gene symbol | ATXN3 | Gene ID | 4287 |
| Gene name | ataxin 3 | |
| Gene Alias | AT3 | |
| Cytomap | 14q32.12 | |
| Gene Type | protein-coding | GO ID | GO:0000226 | UniProtAcc | P54252 |
Top |
Malignant transformation analysis |
| Identification of the aberrant gene expression in precancerous and cancerous lesions by comparing the gene expression of stem-like cells in diseased tissues with normal stem cells |
| Entrez ID | Symbol | Replicates | Species | Organ | Tissue | Adj P-value | Log2FC | Malignancy |
| 4287 | ATXN3 | LZE2T | Human | Esophagus | ESCC | 4.79e-02 | 3.62e-01 | 0.082 |
| 4287 | ATXN3 | LZE4T | Human | Esophagus | ESCC | 7.80e-19 | 3.95e-01 | 0.0811 |
| 4287 | ATXN3 | LZE5T | Human | Esophagus | ESCC | 1.58e-06 | 3.86e-01 | 0.0514 |
| 4287 | ATXN3 | LZE7T | Human | Esophagus | ESCC | 9.71e-03 | 1.27e-01 | 0.0667 |
| 4287 | ATXN3 | LZE20T | Human | Esophagus | ESCC | 8.18e-12 | 2.48e-01 | 0.0662 |
| 4287 | ATXN3 | LZE22T | Human | Esophagus | ESCC | 3.38e-05 | 2.32e-01 | 0.068 |
| 4287 | ATXN3 | LZE24T | Human | Esophagus | ESCC | 2.17e-15 | 2.51e-01 | 0.0596 |
| 4287 | ATXN3 | LZE21T | Human | Esophagus | ESCC | 2.86e-05 | 1.50e-01 | 0.0655 |
| 4287 | ATXN3 | LZE6T | Human | Esophagus | ESCC | 1.80e-05 | 1.00e-01 | 0.0845 |
| 4287 | ATXN3 | P1T-E | Human | Esophagus | ESCC | 1.02e-06 | 2.09e-01 | 0.0875 |
| 4287 | ATXN3 | P2T-E | Human | Esophagus | ESCC | 1.50e-16 | 4.11e-01 | 0.1177 |
| 4287 | ATXN3 | P4T-E | Human | Esophagus | ESCC | 1.53e-31 | 6.47e-01 | 0.1323 |
| 4287 | ATXN3 | P5T-E | Human | Esophagus | ESCC | 1.13e-12 | 3.37e-01 | 0.1327 |
| 4287 | ATXN3 | P8T-E | Human | Esophagus | ESCC | 9.07e-34 | 5.26e-01 | 0.0889 |
| 4287 | ATXN3 | P9T-E | Human | Esophagus | ESCC | 1.99e-12 | 2.22e-01 | 0.1131 |
| 4287 | ATXN3 | P10T-E | Human | Esophagus | ESCC | 8.54e-59 | 9.65e-01 | 0.116 |
| 4287 | ATXN3 | P11T-E | Human | Esophagus | ESCC | 3.64e-19 | 5.91e-01 | 0.1426 |
| 4287 | ATXN3 | P12T-E | Human | Esophagus | ESCC | 7.92e-55 | 9.22e-01 | 0.1122 |
| 4287 | ATXN3 | P15T-E | Human | Esophagus | ESCC | 1.56e-53 | 9.50e-01 | 0.1149 |
| 4287 | ATXN3 | P16T-E | Human | Esophagus | ESCC | 5.38e-25 | 4.54e-01 | 0.1153 |
| Page: 1 2 3 4 5 6 |
| Tissue | Expression Dynamics | Abbreviation |
| Esophagus |  | ESCC: Esophageal squamous cell carcinoma |
| HGIN: High-grade intraepithelial neoplasias | ||
| LGIN: Low-grade intraepithelial neoplasias | ||
| Liver |  | HCC: Hepatocellular carcinoma |
| NAFLD: Non-alcoholic fatty liver disease | ||
| Oral Cavity |  | EOLP: Erosive Oral lichen planus |
| LP: leukoplakia | ||
| NEOLP: Non-erosive oral lichen planus | ||
| OSCC: Oral squamous cell carcinoma | ||
| Skin | 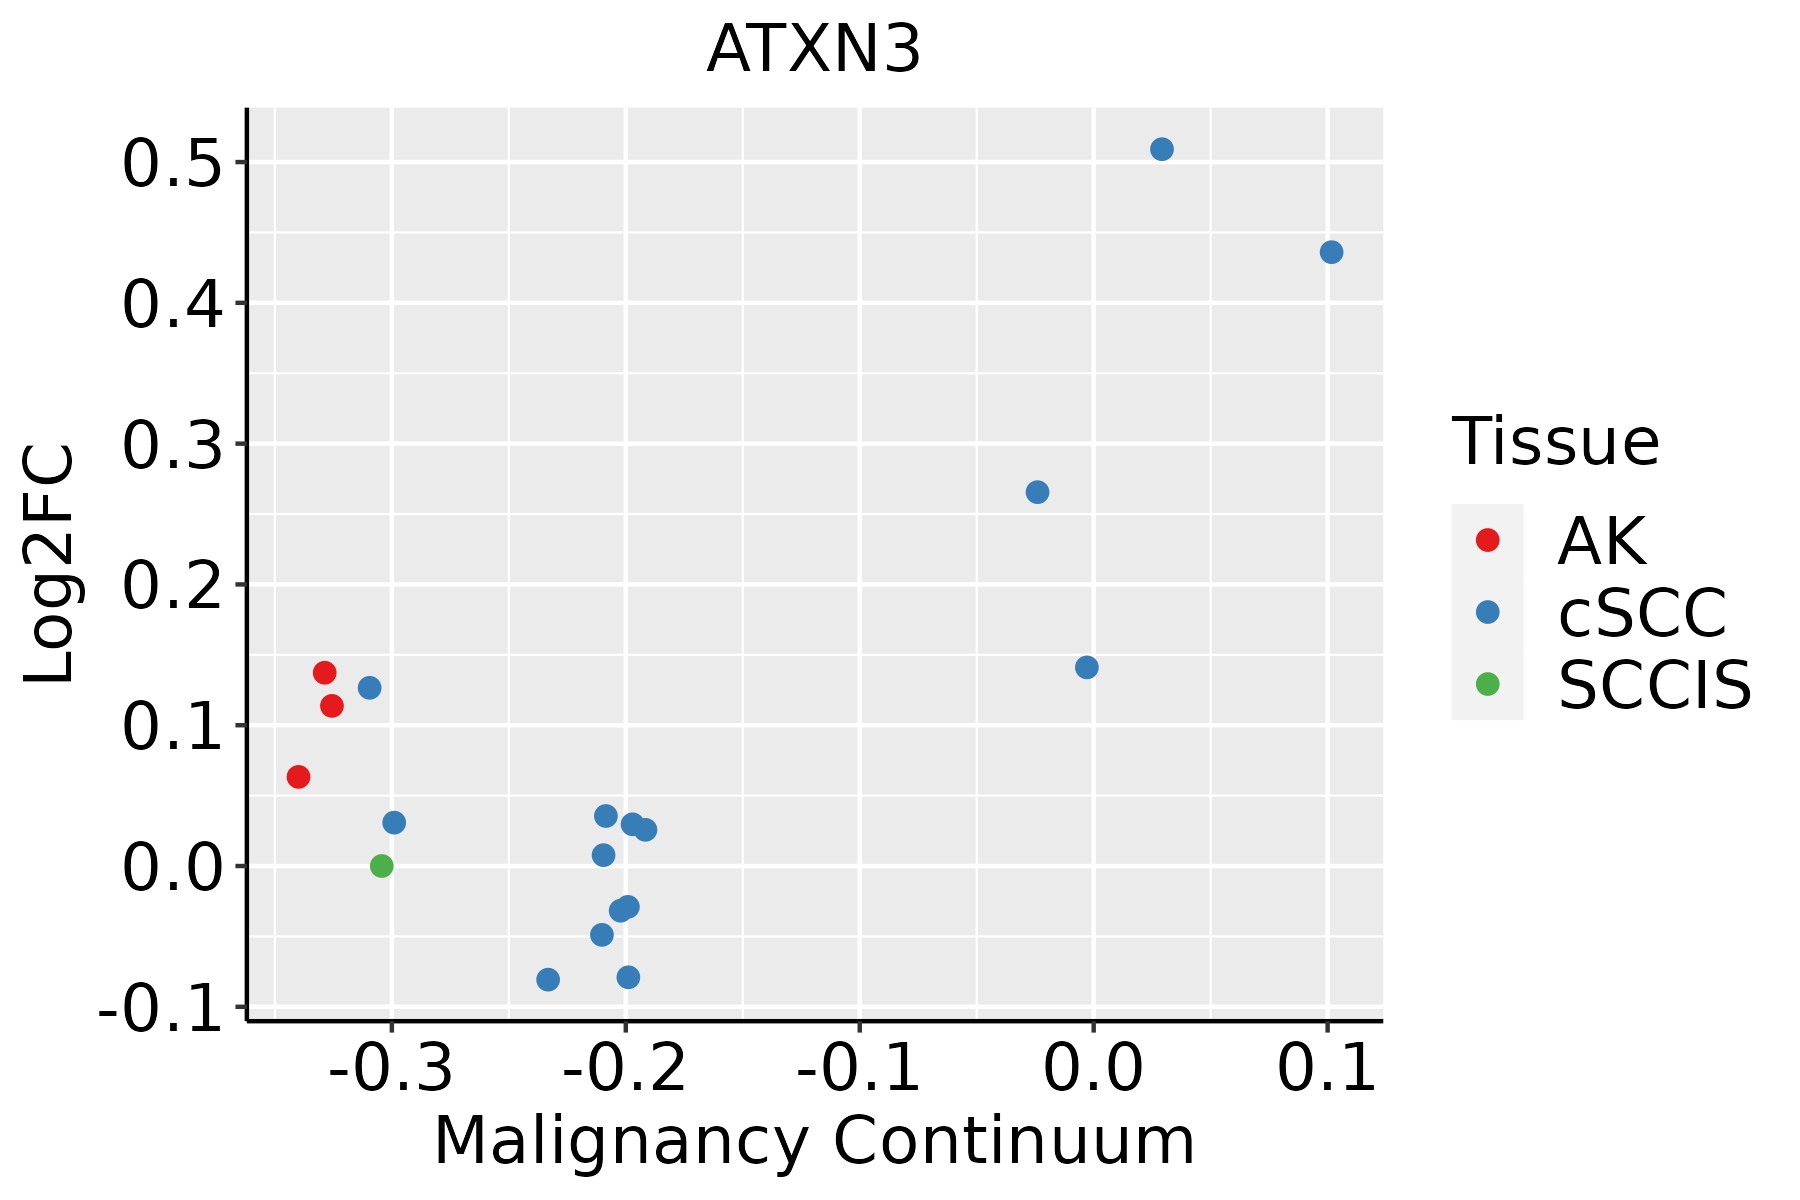 | AK: Actinic keratosis |
| cSCC: Cutaneous squamous cell carcinoma | ||
| SCCIS:squamous cell carcinoma in situ | ||
| Thyroid |  | ATC: Anaplastic thyroid cancer |
| HT: Hashimoto's thyroiditis | ||
| PTC: Papillary thyroid cancer |
| ∗log2FC in expression of this searched gene in stem-like cells from each diseased tissue sample relative to stem-like cells in normal samples in each tissue plotted against the malignancy continuum. Samples are colored based on if they are from different disease stage. |
Top |
Malignant transformation related pathway analysis |
| Find out the enriched GO biological processes and KEGG pathways involved in transition from healthy to precancer to cancer |
| Tissue | Disease Stage | Enriched GO biological Processes |
| Colorectum | AD |  |
| Colorectum | SER |  |
| Colorectum | MSS |  |
| Colorectum | MSI-H |  |
| Colorectum | FAP |  |
| ∗Top 15 enriched GO BP terms are showed in the bar plot of each disease state in each tissue. Each row represents a significant GO biological process which is colored according to the -log10(p.adjust). |
| Page: 1 2 3 4 5 6 7 8 9 |
| GO ID | Tissue | Disease Stage | Description | Gene Ratio | Bg Ratio | pvalue | p.adjust | Count |
| GO:003133120 | Oral cavity | OSCC | positive regulation of cellular catabolic process | 273/7305 | 427/18723 | 6.39e-26 | 2.02e-23 | 273 |
| GO:004217620 | Oral cavity | OSCC | regulation of protein catabolic process | 254/7305 | 391/18723 | 1.07e-25 | 3.22e-23 | 254 |
| GO:003497620 | Oral cavity | OSCC | response to endoplasmic reticulum stress | 178/7305 | 256/18723 | 2.59e-23 | 6.06e-21 | 178 |
| GO:004586220 | Oral cavity | OSCC | positive regulation of proteolysis | 236/7305 | 372/18723 | 6.53e-22 | 1.38e-19 | 236 |
| GO:190336220 | Oral cavity | OSCC | regulation of cellular protein catabolic process | 174/7305 | 255/18723 | 2.04e-21 | 3.70e-19 | 174 |
| GO:190305020 | Oral cavity | OSCC | regulation of proteolysis involved in cellular protein catabolic process | 152/7305 | 221/18723 | 2.16e-19 | 3.15e-17 | 152 |
| GO:003596620 | Oral cavity | OSCC | response to topologically incorrect protein | 117/7305 | 159/18723 | 6.93e-19 | 8.60e-17 | 117 |
| GO:006113620 | Oral cavity | OSCC | regulation of proteasomal protein catabolic process | 132/7305 | 187/18723 | 1.57e-18 | 1.81e-16 | 132 |
| GO:004573220 | Oral cavity | OSCC | positive regulation of protein catabolic process | 150/7305 | 231/18723 | 1.06e-15 | 7.64e-14 | 150 |
| GO:190336420 | Oral cavity | OSCC | positive regulation of cellular protein catabolic process | 106/7305 | 155/18723 | 1.07e-13 | 5.53e-12 | 106 |
| GO:190180018 | Oral cavity | OSCC | positive regulation of proteasomal protein catabolic process | 82/7305 | 114/18723 | 9.33e-13 | 4.22e-11 | 82 |
| GO:003596720 | Oral cavity | OSCC | cellular response to topologically incorrect protein | 83/7305 | 116/18723 | 1.09e-12 | 4.84e-11 | 83 |
| GO:190305217 | Oral cavity | OSCC | positive regulation of proteolysis involved in cellular protein catabolic process | 92/7305 | 133/18723 | 1.60e-12 | 6.90e-11 | 92 |
| GO:00365035 | Oral cavity | OSCC | ERAD pathway | 76/7305 | 107/18723 | 1.76e-11 | 6.11e-10 | 76 |
| GO:190589720 | Oral cavity | OSCC | regulation of response to endoplasmic reticulum stress | 60/7305 | 82/18723 | 3.38e-10 | 9.11e-09 | 60 |
| GO:003460519 | Oral cavity | OSCC | cellular response to heat | 51/7305 | 69/18723 | 4.00e-09 | 8.95e-08 | 51 |
| GO:000940817 | Oral cavity | OSCC | response to heat | 73/7305 | 110/18723 | 5.56e-09 | 1.21e-07 | 73 |
| GO:003158917 | Oral cavity | OSCC | cell-substrate adhesion | 193/7305 | 363/18723 | 2.48e-08 | 4.82e-07 | 193 |
| GO:001081019 | Oral cavity | OSCC | regulation of cell-substrate adhesion | 126/7305 | 221/18723 | 4.02e-08 | 7.55e-07 | 126 |
| GO:19058984 | Oral cavity | OSCC | positive regulation of response to endoplasmic reticulum stress | 28/7305 | 35/18723 | 8.71e-07 | 1.19e-05 | 28 |
| Page: 1 2 3 4 5 6 7 8 9 10 11 12 13 |
| Pathway ID | Tissue | Disease Stage | Description | Gene Ratio | Bg Ratio | pvalue | p.adjust | qvalue | Count |
| hsa05022210 | Esophagus | ESCC | Pathways of neurodegeneration - multiple diseases | 318/4205 | 476/8465 | 6.10e-15 | 2.04e-13 | 1.05e-13 | 318 |
| hsa0501728 | Esophagus | ESCC | Spinocerebellar ataxia | 94/4205 | 143/8465 | 6.77e-05 | 2.90e-04 | 1.48e-04 | 94 |
| hsa0502238 | Esophagus | ESCC | Pathways of neurodegeneration - multiple diseases | 318/4205 | 476/8465 | 6.10e-15 | 2.04e-13 | 1.05e-13 | 318 |
| hsa0501736 | Esophagus | ESCC | Spinocerebellar ataxia | 94/4205 | 143/8465 | 6.77e-05 | 2.90e-04 | 1.48e-04 | 94 |
| hsa0414114 | Liver | Cirrhotic | Protein processing in endoplasmic reticulum | 114/2530 | 174/8465 | 1.16e-22 | 9.67e-21 | 5.96e-21 | 114 |
| hsa0502214 | Liver | Cirrhotic | Pathways of neurodegeneration - multiple diseases | 217/2530 | 476/8465 | 7.30e-14 | 2.03e-12 | 1.25e-12 | 217 |
| hsa0501710 | Liver | Cirrhotic | Spinocerebellar ataxia | 66/2530 | 143/8465 | 2.58e-05 | 2.15e-04 | 1.32e-04 | 66 |
| hsa0414115 | Liver | Cirrhotic | Protein processing in endoplasmic reticulum | 114/2530 | 174/8465 | 1.16e-22 | 9.67e-21 | 5.96e-21 | 114 |
| hsa0502215 | Liver | Cirrhotic | Pathways of neurodegeneration - multiple diseases | 217/2530 | 476/8465 | 7.30e-14 | 2.03e-12 | 1.25e-12 | 217 |
| hsa0501711 | Liver | Cirrhotic | Spinocerebellar ataxia | 66/2530 | 143/8465 | 2.58e-05 | 2.15e-04 | 1.32e-04 | 66 |
| hsa0414122 | Liver | HCC | Protein processing in endoplasmic reticulum | 146/4020 | 174/8465 | 7.34e-24 | 2.46e-21 | 1.37e-21 | 146 |
| hsa0502222 | Liver | HCC | Pathways of neurodegeneration - multiple diseases | 298/4020 | 476/8465 | 6.59e-12 | 1.30e-10 | 7.22e-11 | 298 |
| hsa0501721 | Liver | HCC | Spinocerebellar ataxia | 92/4020 | 143/8465 | 3.20e-05 | 1.88e-04 | 1.04e-04 | 92 |
| hsa0414132 | Liver | HCC | Protein processing in endoplasmic reticulum | 146/4020 | 174/8465 | 7.34e-24 | 2.46e-21 | 1.37e-21 | 146 |
| hsa0502232 | Liver | HCC | Pathways of neurodegeneration - multiple diseases | 298/4020 | 476/8465 | 6.59e-12 | 1.30e-10 | 7.22e-11 | 298 |
| hsa0501731 | Liver | HCC | Spinocerebellar ataxia | 92/4020 | 143/8465 | 3.20e-05 | 1.88e-04 | 1.04e-04 | 92 |
| hsa0414130 | Oral cavity | OSCC | Protein processing in endoplasmic reticulum | 143/3704 | 174/8465 | 6.82e-26 | 2.28e-23 | 1.16e-23 | 143 |
| hsa0502228 | Oral cavity | OSCC | Pathways of neurodegeneration - multiple diseases | 292/3704 | 476/8465 | 1.60e-15 | 4.47e-14 | 2.28e-14 | 292 |
| hsa0501725 | Oral cavity | OSCC | Spinocerebellar ataxia | 86/3704 | 143/8465 | 5.21e-05 | 2.08e-04 | 1.06e-04 | 86 |
| hsa04141113 | Oral cavity | OSCC | Protein processing in endoplasmic reticulum | 143/3704 | 174/8465 | 6.82e-26 | 2.28e-23 | 1.16e-23 | 143 |
| Page: 1 2 |
Top |
Cell-cell communication analysis |
| Identification of potential cell-cell interactions between two cell types and their ligand-receptor pairs for different disease states |
| Ligand | Receptor | LRpair | Pathway | Tissue | Disease Stage |
| Page: 1 |
Top |
Single-cell gene regulatory network inference analysis |
| Find out the significant the regulons (TFs) and the target genes of each regulon across cell types for different disease states |
| TF | Cell Type | Tissue | Disease Stage | Target Gene | RSS | Regulon Activity |
| ∗The dot plots of a searched regulon are shown for all cell subpopulations in each disease state of each tissue based on the regulon specific score inferred using pySCENIC and by calculating the average expression. |
| Page: 1 |
Top |
Somatic mutation of malignant transformation related genes |
| Annotation of somatic variants for genes involved in malignant transformation |
| Hugo Symbol | Variant Class | Variant Classification | dbSNP RS | HGVSc | HGVSp | HGVSp Short | SWISSPROT | BIOTYPE | SIFT | PolyPhen | Tumor Sample Barcode | Tissue | Histology | Sex | Age | Stage | Therapy Types | Drugs | Outcome |
| ATXN3 | SNV | Missense_Mutation | c.227C>T | p.Ser76Phe | p.S76F | P54252 | protein_coding | deleterious(0.01) | probably_damaging(0.998) | TCGA-A2-A1FX-01 | Breast | breast invasive carcinoma | Female | <65 | III/IV | Chemotherapy | taxotere | SD | |
| ATXN3 | SNV | Missense_Mutation | c.674N>C | p.Asp225Ala | p.D225A | P54252 | protein_coding | deleterious(0.01) | possibly_damaging(0.575) | TCGA-AO-A128-01 | Breast | breast invasive carcinoma | Female | <65 | I/II | Chemotherapy | doxorubicin | SD | |
| ATXN3 | SNV | Missense_Mutation | c.138N>C | p.Met46Ile | p.M46I | P54252 | protein_coding | tolerated(0.33) | benign(0.001) | TCGA-D8-A27V-01 | Breast | breast invasive carcinoma | Female | <65 | I/II | Hormone Therapy | tamoxiphen | SD | |
| ATXN3 | SNV | Missense_Mutation | c.151N>C | p.Gly51Arg | p.G51R | P54252 | protein_coding | deleterious(0.03) | probably_damaging(0.997) | TCGA-E2-A1L9-01 | Breast | breast invasive carcinoma | Female | <65 | I/II | Chemotherapy | cytoxan | SD | |
| ATXN3 | SNV | Missense_Mutation | c.151N>A | p.Gly51Arg | p.G51R | P54252 | protein_coding | deleterious(0.03) | probably_damaging(0.997) | TCGA-E2-A2P6-01 | Breast | breast invasive carcinoma | Female | >=65 | I/II | Hormone Therapy | anastrozole | SD | |
| ATXN3 | SNV | Missense_Mutation | c.138G>A | p.Met46Ile | p.M46I | P54252 | protein_coding | tolerated(0.33) | benign(0.001) | TCGA-GM-A2D9-01 | Breast | breast invasive carcinoma | Female | >=65 | I/II | Hormone Therapy | arimidex | SD | |
| ATXN3 | SNV | Missense_Mutation | c.472N>A | p.Glu158Lys | p.E158K | P54252 | protein_coding | deleterious(0) | possibly_damaging(0.454) | TCGA-C5-A3HE-01 | Cervix | cervical & endocervical cancer | Female | <65 | I/II | Unknown | Unknown | PD | |
| ATXN3 | SNV | Missense_Mutation | novel | c.148N>A | p.Glu50Lys | p.E50K | P54252 | protein_coding | deleterious(0) | probably_damaging(0.967) | TCGA-VS-A959-01 | Cervix | cervical & endocervical cancer | Female | >=65 | I/II | Unknown | Unknown | SD |
| ATXN3 | SNV | Missense_Mutation | rs531719156 | c.176N>A | p.Arg59His | p.R59H | P54252 | protein_coding | tolerated(0.08) | benign(0.014) | TCGA-AA-A010-01 | Colorectum | colon adenocarcinoma | Female | <65 | I/II | Chemotherapy | folinic | CR |
| ATXN3 | SNV | Missense_Mutation | c.307A>G | p.Arg103Gly | p.R103G | P54252 | protein_coding | tolerated(0.41) | benign(0) | TCGA-AZ-6601-01 | Colorectum | colon adenocarcinoma | Male | >=65 | I/II | Unknown | Unknown | PD |
| Page: 1 2 3 4 |
Top |
Related drugs of malignant transformation related genes |
| Identification of chemicals and drugs interact with genes involved in malignant transfromation |
| (DGIdb 4.0) |
| Entrez ID | Symbol | Category | Interaction Types | Drug Claim Name | Drug Name | PMIDs |
| Page: 1 |

Copyright 2023-Present -The University of Texas Health Science Center at Houston |