
|
|||||
|
 | |
| |
| |
| |
| |
| |
|
Gene: ATG3 |
Gene summary for ATG3 |
| Gene information | Species | Human | Gene symbol | ATG3 | Gene ID | 64422 |
| Gene name | autophagy related 3 | |
| Gene Alias | APG3 | |
| Cytomap | 3q13.2 | |
| Gene Type | protein-coding | GO ID | GO:0000045 | UniProtAcc | Q9NT62 |
Top |
Malignant transformation analysis |
| Identification of the aberrant gene expression in precancerous and cancerous lesions by comparing the gene expression of stem-like cells in diseased tissues with normal stem cells |
| Entrez ID | Symbol | Replicates | Species | Organ | Tissue | Adj P-value | Log2FC | Malignancy |
| 64422 | ATG3 | LZE2T | Human | Esophagus | ESCC | 7.09e-03 | 1.01e+00 | 0.082 |
| 64422 | ATG3 | LZE4T | Human | Esophagus | ESCC | 4.07e-17 | 6.28e-01 | 0.0811 |
| 64422 | ATG3 | LZE7T | Human | Esophagus | ESCC | 6.90e-07 | 4.84e-01 | 0.0667 |
| 64422 | ATG3 | LZE8T | Human | Esophagus | ESCC | 6.95e-03 | 1.81e-01 | 0.067 |
| 64422 | ATG3 | LZE20T | Human | Esophagus | ESCC | 4.52e-07 | 4.03e-01 | 0.0662 |
| 64422 | ATG3 | LZE24D1 | Human | Esophagus | HGIN | 5.98e-03 | 5.51e-01 | 0.054 |
| 64422 | ATG3 | LZE24T | Human | Esophagus | ESCC | 2.08e-29 | 1.20e+00 | 0.0596 |
| 64422 | ATG3 | LZE22D3 | Human | Esophagus | HGIN | 3.85e-03 | 4.37e-01 | 0.0653 |
| 64422 | ATG3 | LZE6T | Human | Esophagus | ESCC | 2.01e-02 | 8.14e-02 | 0.0845 |
| 64422 | ATG3 | P1T-E | Human | Esophagus | ESCC | 1.16e-08 | 6.83e-01 | 0.0875 |
| 64422 | ATG3 | P2T-E | Human | Esophagus | ESCC | 1.35e-33 | 5.17e-01 | 0.1177 |
| 64422 | ATG3 | P4T-E | Human | Esophagus | ESCC | 7.37e-21 | 7.08e-01 | 0.1323 |
| 64422 | ATG3 | P5T-E | Human | Esophagus | ESCC | 1.59e-36 | 8.43e-01 | 0.1327 |
| 64422 | ATG3 | P8T-E | Human | Esophagus | ESCC | 8.01e-53 | 9.44e-01 | 0.0889 |
| 64422 | ATG3 | P9T-E | Human | Esophagus | ESCC | 2.42e-23 | 8.11e-01 | 0.1131 |
| 64422 | ATG3 | P10T-E | Human | Esophagus | ESCC | 1.22e-55 | 9.85e-01 | 0.116 |
| 64422 | ATG3 | P11T-E | Human | Esophagus | ESCC | 5.03e-17 | 7.85e-01 | 0.1426 |
| 64422 | ATG3 | P12T-E | Human | Esophagus | ESCC | 2.27e-24 | 3.88e-01 | 0.1122 |
| 64422 | ATG3 | P15T-E | Human | Esophagus | ESCC | 5.04e-38 | 1.01e+00 | 0.1149 |
| 64422 | ATG3 | P16T-E | Human | Esophagus | ESCC | 1.04e-43 | 9.33e-01 | 0.1153 |
| Page: 1 2 3 4 5 6 7 |
| Tissue | Expression Dynamics | Abbreviation |
| Esophagus | 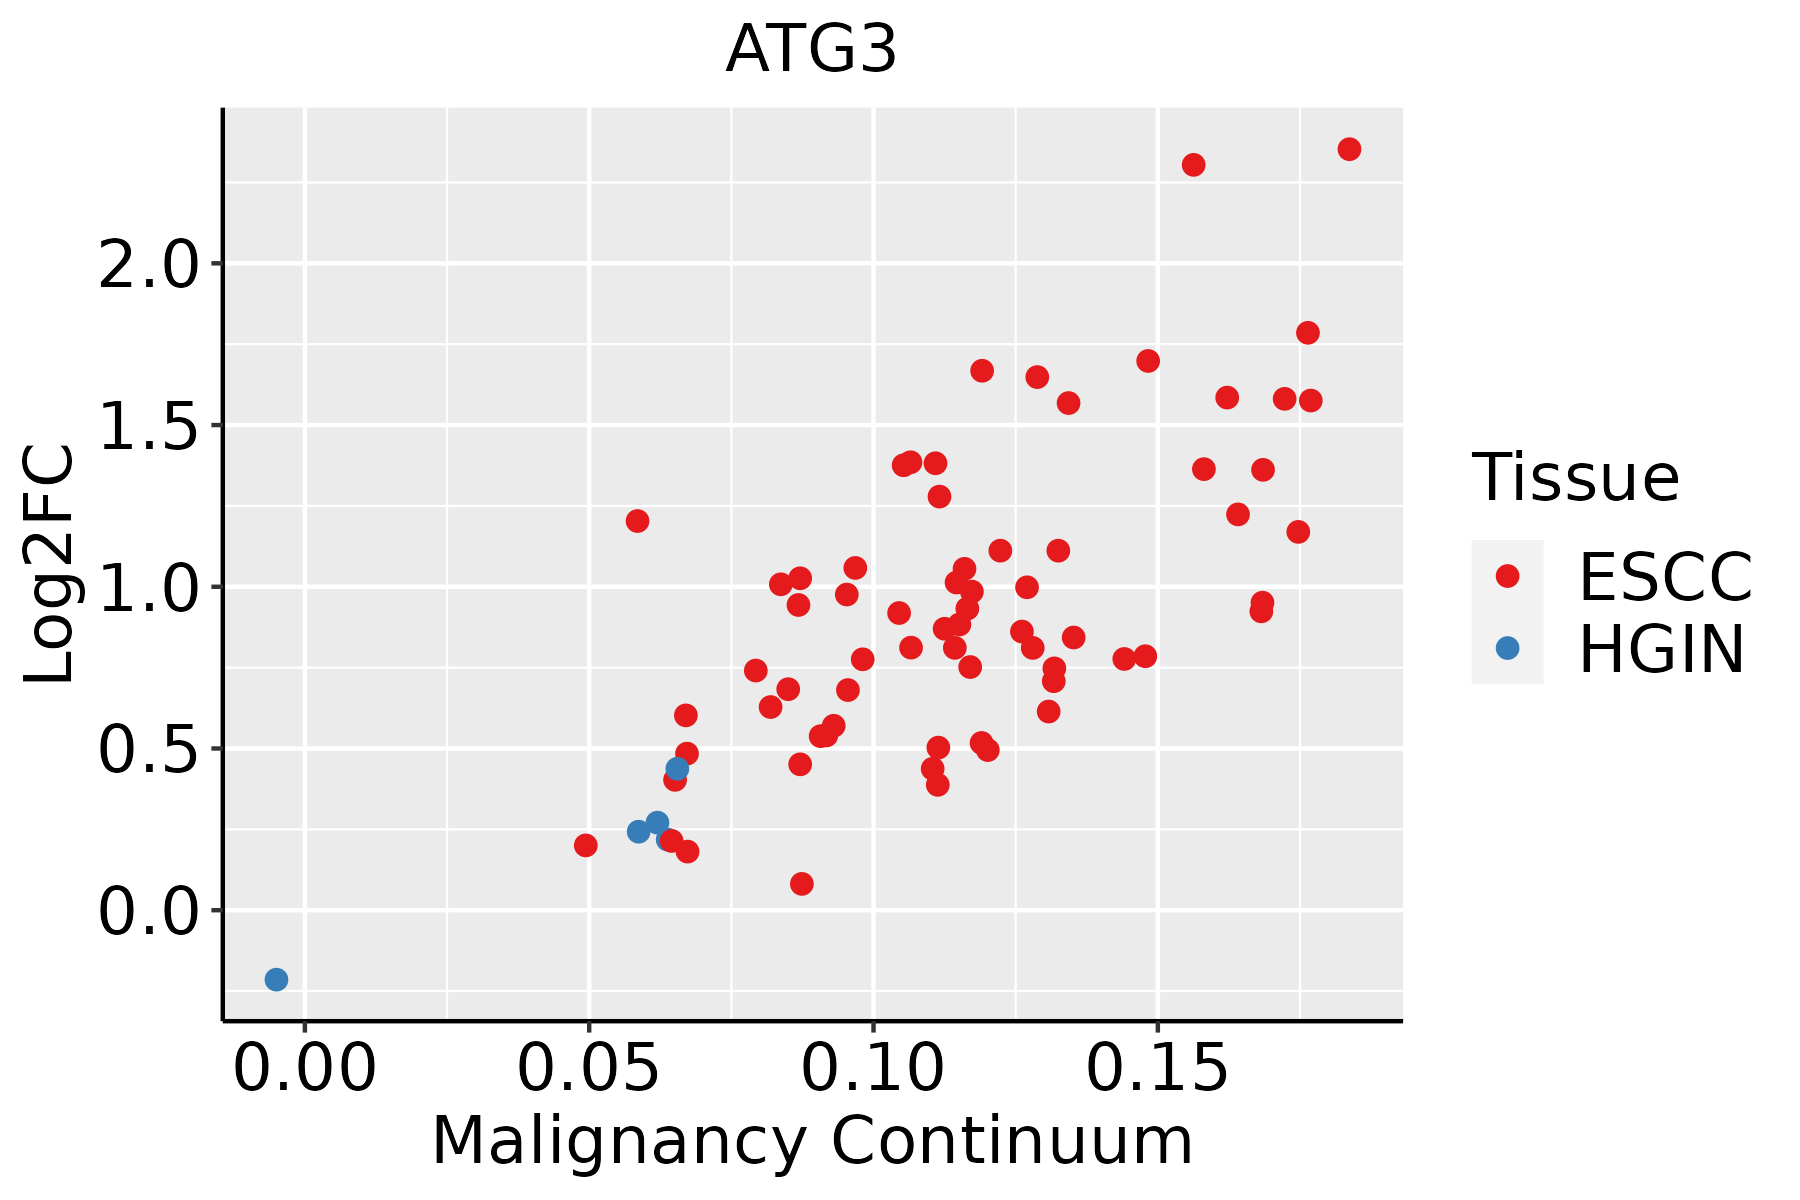 | ESCC: Esophageal squamous cell carcinoma |
| HGIN: High-grade intraepithelial neoplasias | ||
| LGIN: Low-grade intraepithelial neoplasias | ||
| Liver |  | HCC: Hepatocellular carcinoma |
| NAFLD: Non-alcoholic fatty liver disease | ||
| Oral Cavity | 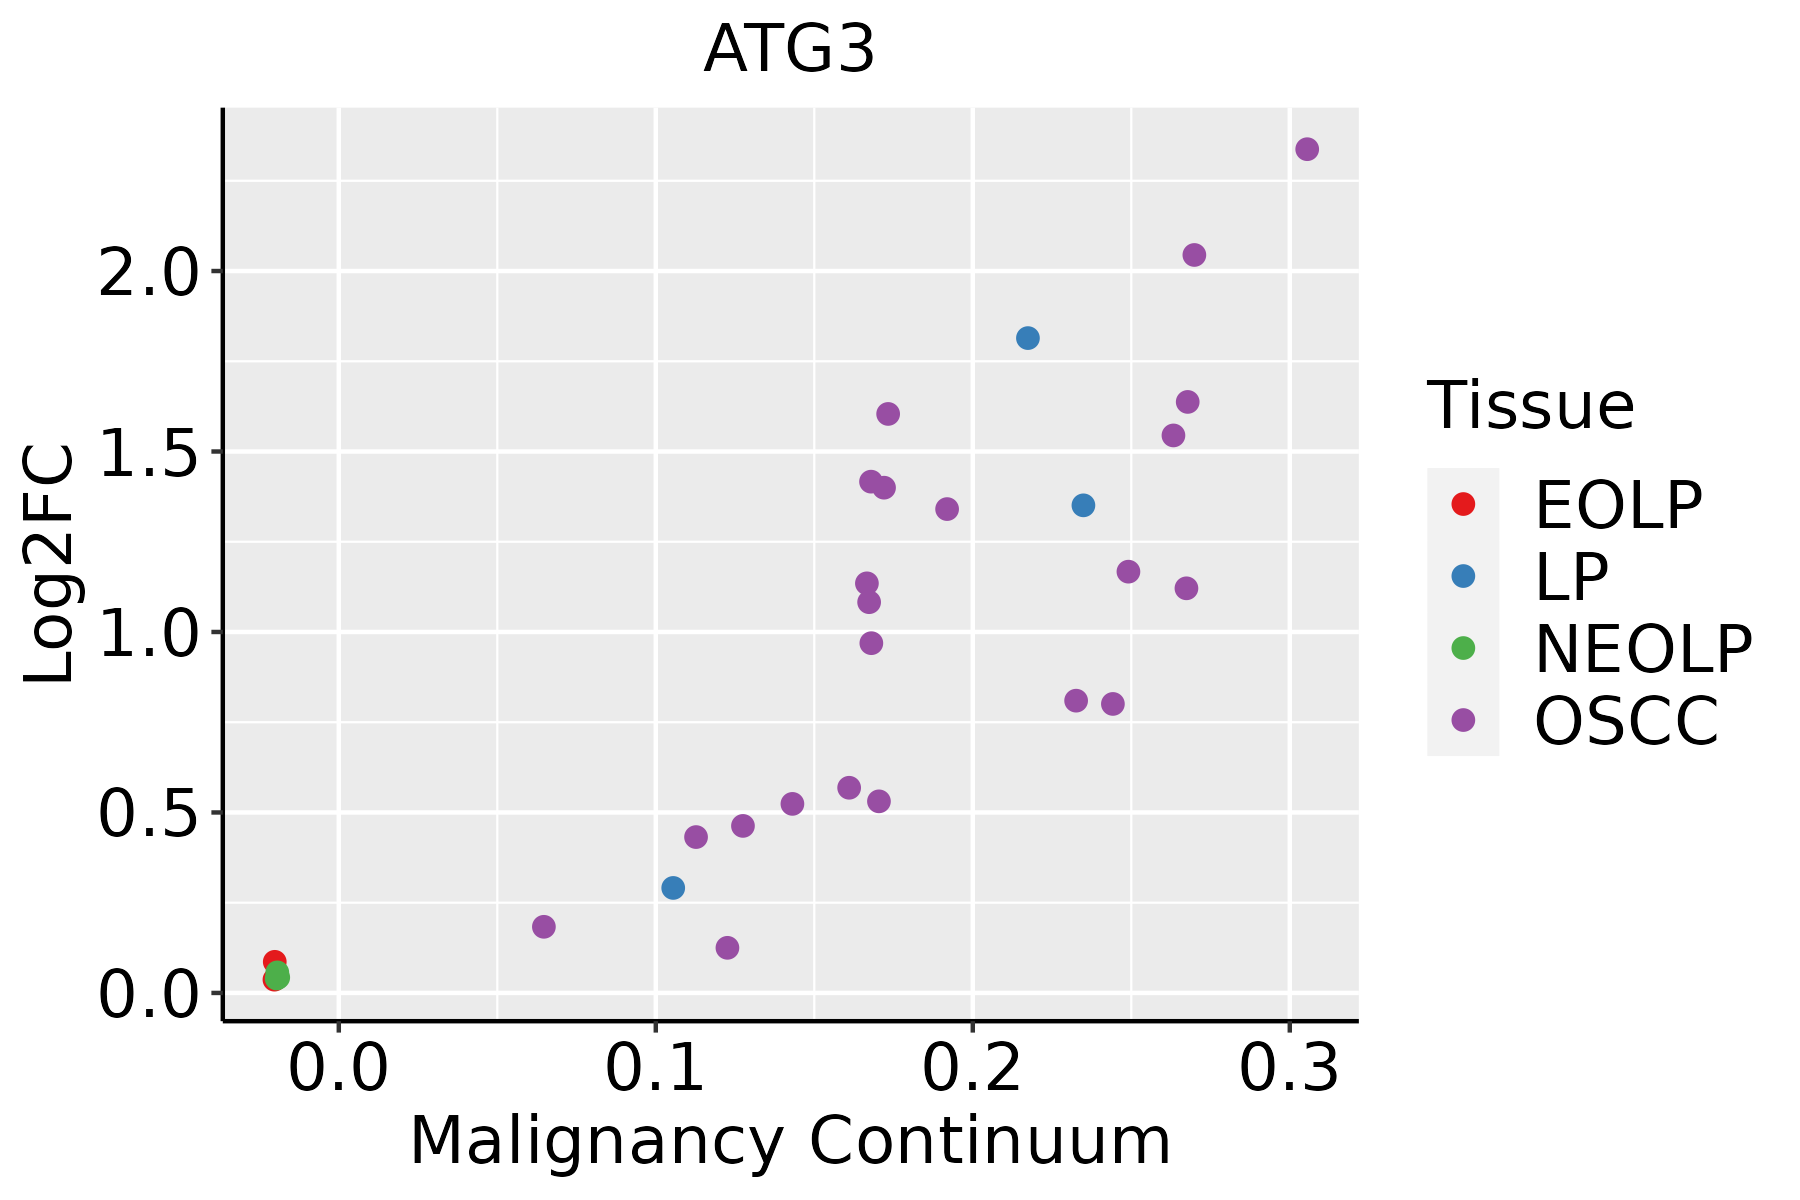 | EOLP: Erosive Oral lichen planus |
| LP: leukoplakia | ||
| NEOLP: Non-erosive oral lichen planus | ||
| OSCC: Oral squamous cell carcinoma | ||
| Skin | 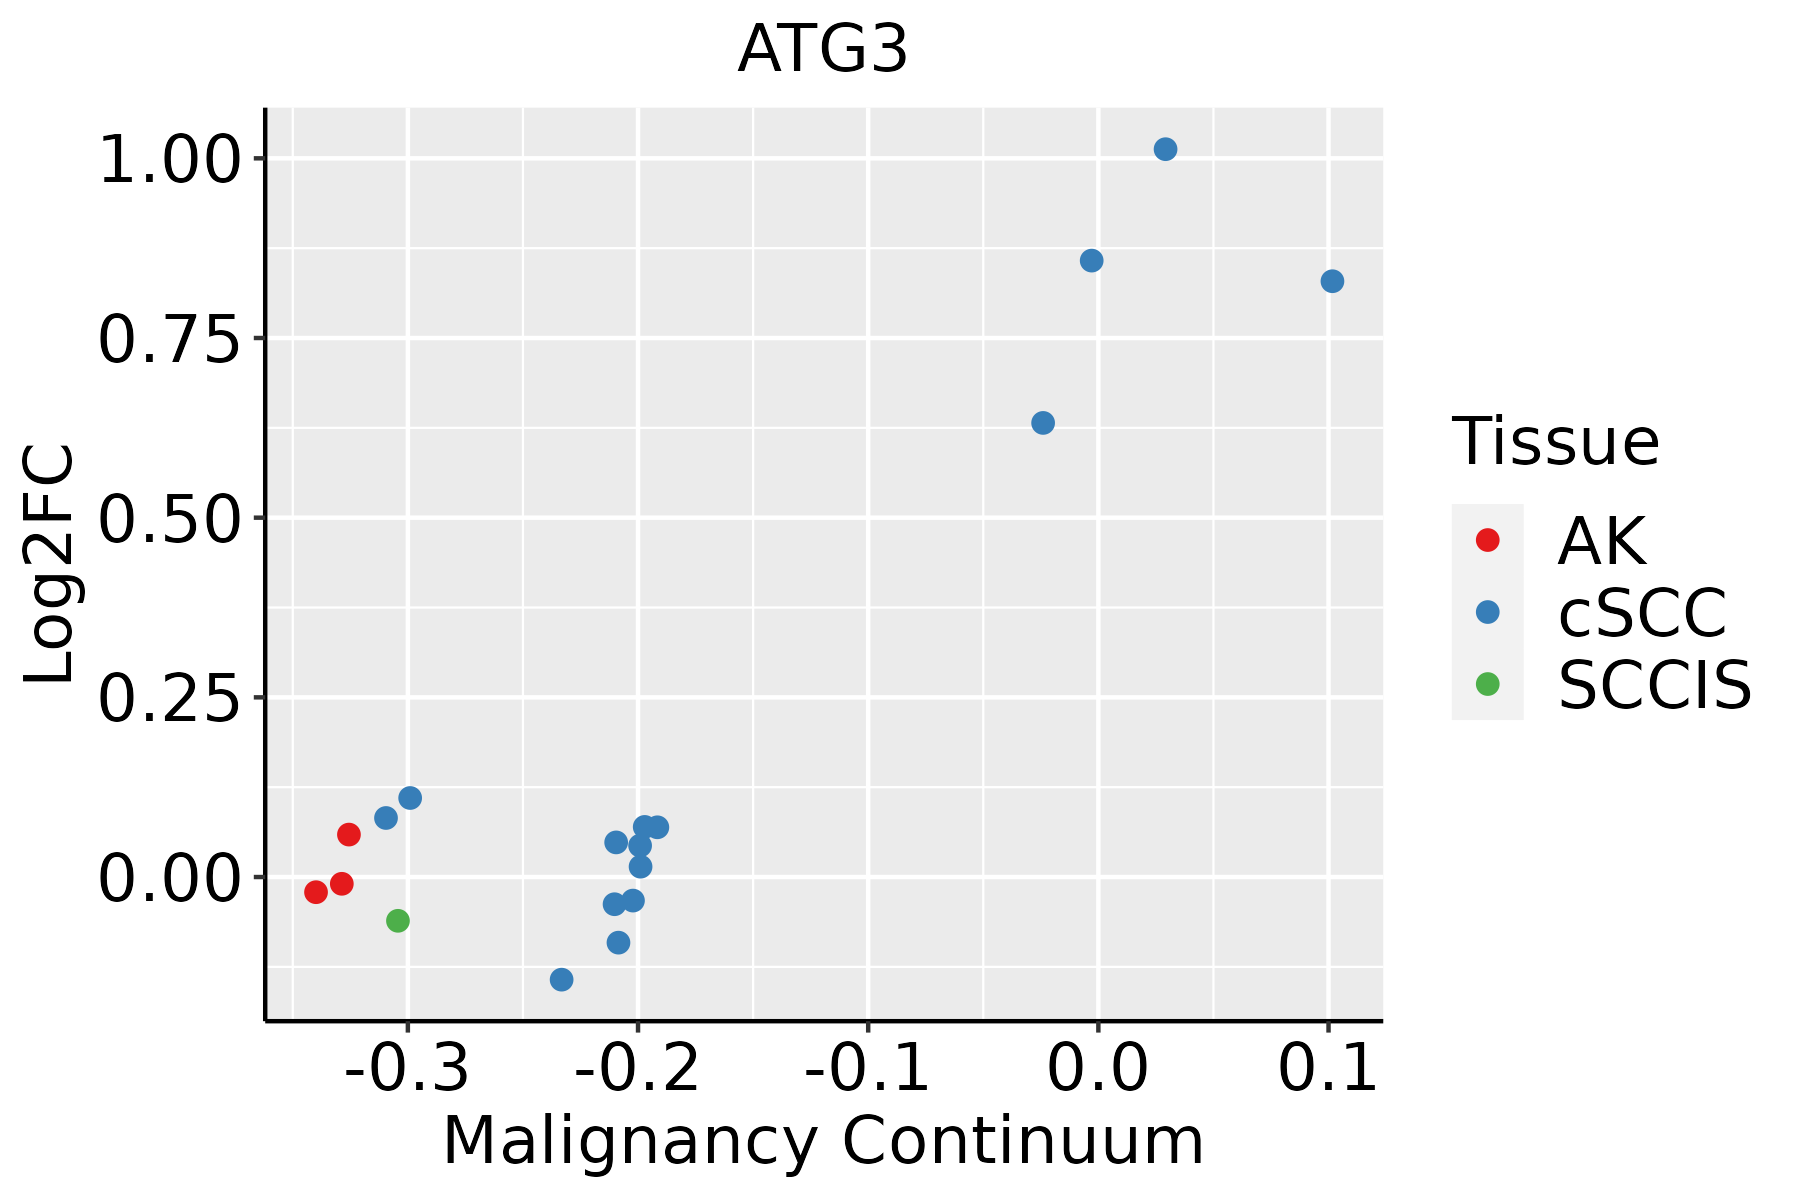 | AK: Actinic keratosis |
| cSCC: Cutaneous squamous cell carcinoma | ||
| SCCIS:squamous cell carcinoma in situ | ||
| Thyroid | 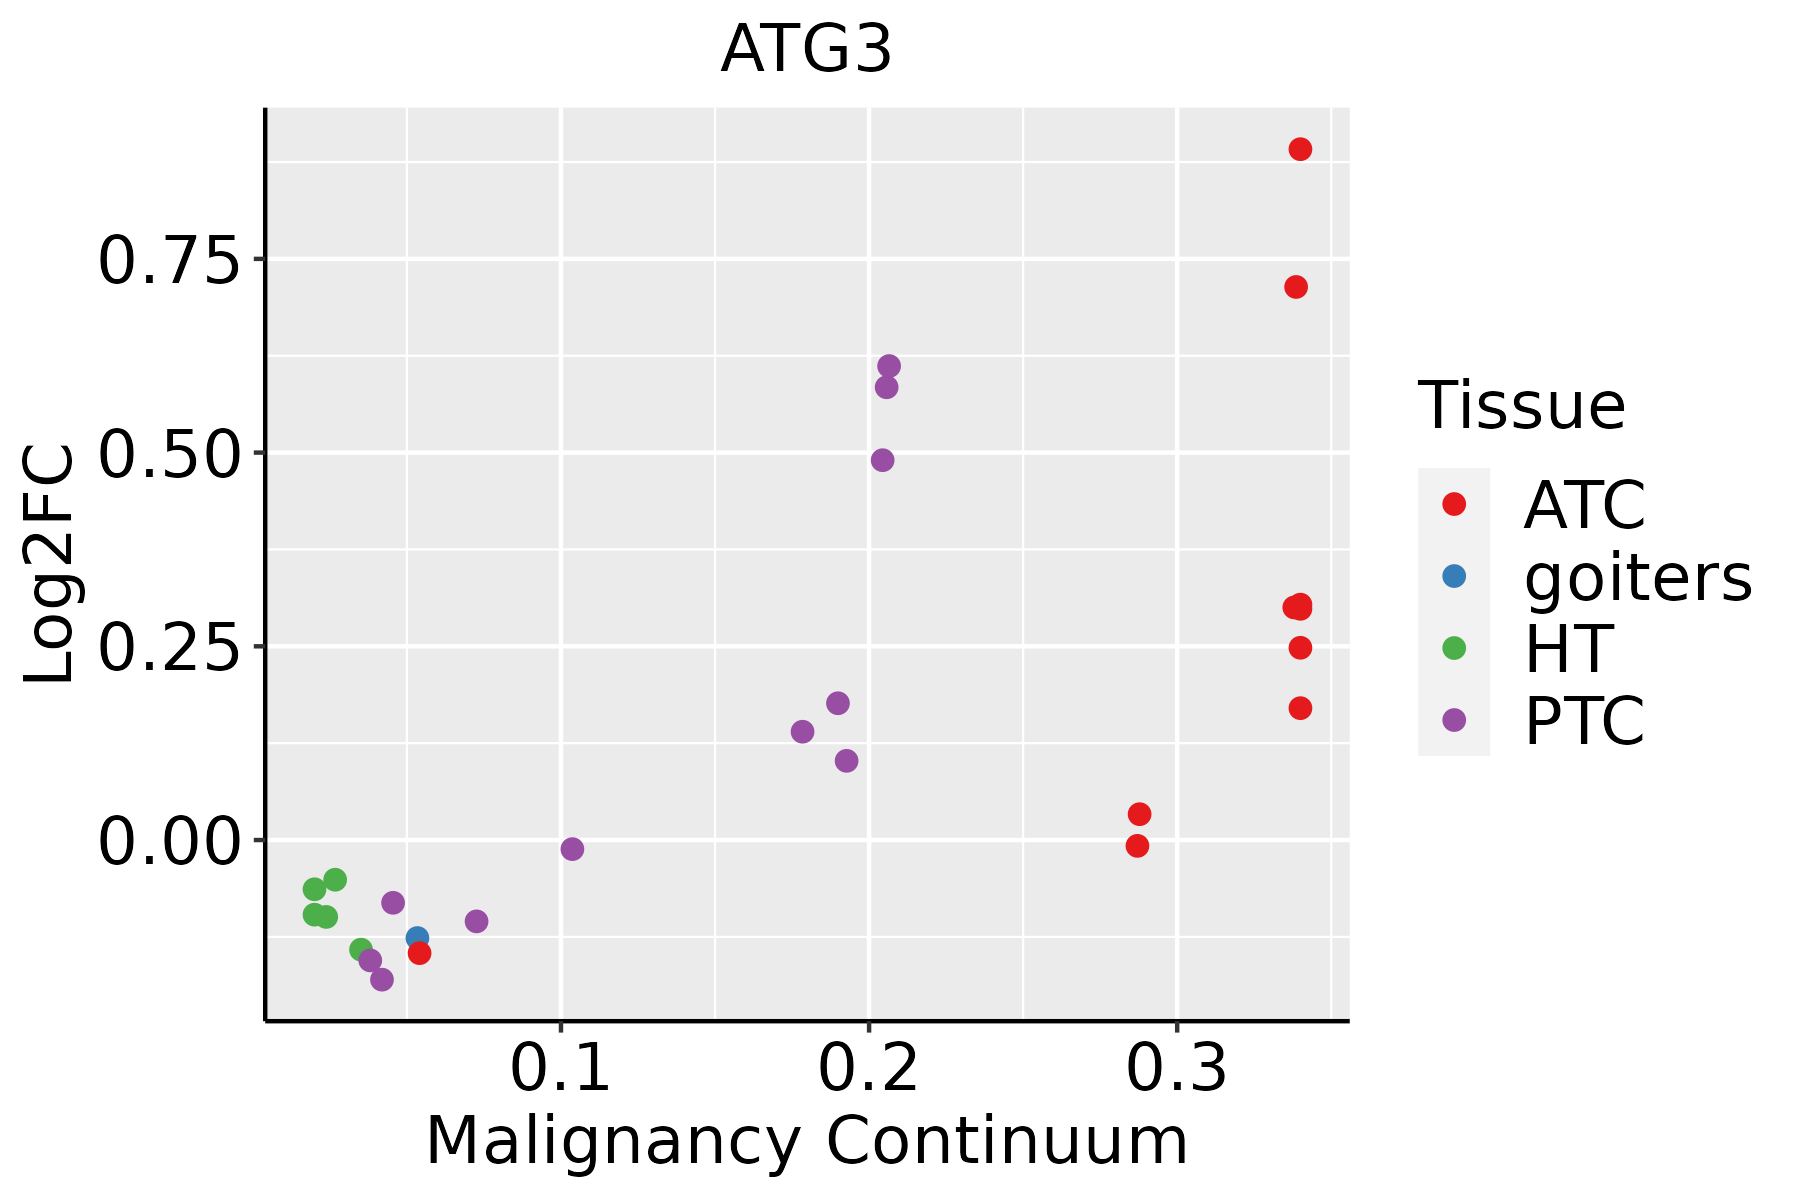 | ATC: Anaplastic thyroid cancer |
| HT: Hashimoto's thyroiditis | ||
| PTC: Papillary thyroid cancer |
| ∗log2FC in expression of this searched gene in stem-like cells from each diseased tissue sample relative to stem-like cells in normal samples in each tissue plotted against the malignancy continuum. Samples are colored based on if they are from different disease stage. |
Top |
Malignant transformation related pathway analysis |
| Find out the enriched GO biological processes and KEGG pathways involved in transition from healthy to precancer to cancer |
| Tissue | Disease Stage | Enriched GO biological Processes |
| Colorectum | AD |  |
| Colorectum | SER |  |
| Colorectum | MSS |  |
| Colorectum | MSI-H |  |
| Colorectum | FAP |  |
| ∗Top 15 enriched GO BP terms are showed in the bar plot of each disease state in each tissue. Each row represents a significant GO biological process which is colored according to the -log10(p.adjust). |
| Page: 1 2 3 4 5 6 7 8 9 |
| GO ID | Tissue | Disease Stage | Description | Gene Ratio | Bg Ratio | pvalue | p.adjust | Count |
| GO:190503713 | Thyroid | PTC | autophagosome organization | 55/5968 | 103/18723 | 4.75e-06 | 5.79e-05 | 55 |
| GO:190211516 | Thyroid | PTC | regulation of organelle assembly | 88/5968 | 186/18723 | 7.41e-06 | 8.65e-05 | 88 |
| GO:00066126 | Thyroid | PTC | protein targeting to membrane | 64/5968 | 131/18723 | 3.67e-05 | 3.41e-04 | 64 |
| GO:00510518 | Thyroid | PTC | negative regulation of transport | 176/5968 | 470/18723 | 5.44e-03 | 2.49e-02 | 176 |
| GO:00448043 | Thyroid | PTC | autophagy of nucleus | 10/5968 | 16/18723 | 1.13e-02 | 4.49e-02 | 10 |
| GO:0050765 | Thyroid | PTC | negative regulation of phagocytosis | 13/5968 | 23/18723 | 1.25e-02 | 4.88e-02 | 13 |
| GO:002241124 | Thyroid | ATC | cellular component disassembly | 248/6293 | 443/18723 | 1.34e-22 | 3.69e-20 | 248 |
| GO:000660533 | Thyroid | ATC | protein targeting | 180/6293 | 314/18723 | 3.54e-18 | 4.39e-16 | 180 |
| GO:001623623 | Thyroid | ATC | macroautophagy | 169/6293 | 291/18723 | 6.56e-18 | 7.69e-16 | 169 |
| GO:009015031 | Thyroid | ATC | establishment of protein localization to membrane | 150/6293 | 260/18723 | 1.05e-15 | 7.96e-14 | 150 |
| GO:190300819 | Thyroid | ATC | organelle disassembly | 73/6293 | 114/18723 | 2.81e-11 | 9.54e-10 | 73 |
| GO:000042223 | Thyroid | ATC | autophagy of mitochondrion | 55/6293 | 81/18723 | 2.88e-10 | 8.17e-09 | 55 |
| GO:006172623 | Thyroid | ATC | mitochondrion disassembly | 55/6293 | 81/18723 | 2.88e-10 | 8.17e-09 | 55 |
| GO:000703322 | Thyroid | ATC | vacuole organization | 100/6293 | 180/18723 | 1.07e-09 | 2.71e-08 | 100 |
| GO:012003223 | Thyroid | ATC | regulation of plasma membrane bounded cell projection assembly | 95/6293 | 186/18723 | 6.13e-07 | 8.49e-06 | 95 |
| GO:0060491111 | Thyroid | ATC | regulation of cell projection assembly | 95/6293 | 188/18723 | 1.14e-06 | 1.47e-05 | 95 |
| GO:000004522 | Thyroid | ATC | autophagosome assembly | 56/6293 | 99/18723 | 2.22e-06 | 2.63e-05 | 56 |
| GO:0008637112 | Thyroid | ATC | apoptotic mitochondrial changes | 59/6293 | 107/18723 | 3.69e-06 | 4.10e-05 | 59 |
| GO:190503721 | Thyroid | ATC | autophagosome organization | 57/6293 | 103/18723 | 4.61e-06 | 5.03e-05 | 57 |
| GO:190211522 | Thyroid | ATC | regulation of organelle assembly | 90/6293 | 186/18723 | 2.00e-05 | 1.81e-04 | 90 |
| Page: 1 2 3 4 5 6 7 8 |
| Pathway ID | Tissue | Disease Stage | Description | Gene Ratio | Bg Ratio | pvalue | p.adjust | qvalue | Count |
| hsa0516730 | Esophagus | HGIN | Kaposi sarcoma-associated herpesvirus infection | 51/1383 | 194/8465 | 2.46e-04 | 2.69e-03 | 2.14e-03 | 51 |
| hsa05167114 | Esophagus | HGIN | Kaposi sarcoma-associated herpesvirus infection | 51/1383 | 194/8465 | 2.46e-04 | 2.69e-03 | 2.14e-03 | 51 |
| hsa05167211 | Esophagus | ESCC | Kaposi sarcoma-associated herpesvirus infection | 136/4205 | 194/8465 | 4.28e-09 | 4.22e-08 | 2.16e-08 | 136 |
| hsa0414010 | Esophagus | ESCC | Autophagy - animal | 101/4205 | 141/8465 | 7.60e-08 | 6.21e-07 | 3.18e-07 | 101 |
| hsa041362 | Esophagus | ESCC | Autophagy - other | 23/4205 | 32/8465 | 8.99e-03 | 2.14e-02 | 1.09e-02 | 23 |
| hsa0516738 | Esophagus | ESCC | Kaposi sarcoma-associated herpesvirus infection | 136/4205 | 194/8465 | 4.28e-09 | 4.22e-08 | 2.16e-08 | 136 |
| hsa0414015 | Esophagus | ESCC | Autophagy - animal | 101/4205 | 141/8465 | 7.60e-08 | 6.21e-07 | 3.18e-07 | 101 |
| hsa0413611 | Esophagus | ESCC | Autophagy - other | 23/4205 | 32/8465 | 8.99e-03 | 2.14e-02 | 1.09e-02 | 23 |
| hsa041406 | Liver | Cirrhotic | Autophagy - animal | 65/2530 | 141/8465 | 3.10e-05 | 2.47e-04 | 1.52e-04 | 65 |
| hsa0516714 | Liver | Cirrhotic | Kaposi sarcoma-associated herpesvirus infection | 73/2530 | 194/8465 | 1.17e-02 | 3.81e-02 | 2.35e-02 | 73 |
| hsa0414011 | Liver | Cirrhotic | Autophagy - animal | 65/2530 | 141/8465 | 3.10e-05 | 2.47e-04 | 1.52e-04 | 65 |
| hsa0516715 | Liver | Cirrhotic | Kaposi sarcoma-associated herpesvirus infection | 73/2530 | 194/8465 | 1.17e-02 | 3.81e-02 | 2.35e-02 | 73 |
| hsa0414021 | Liver | HCC | Autophagy - animal | 99/4020 | 141/8465 | 3.08e-08 | 4.70e-07 | 2.61e-07 | 99 |
| hsa0516721 | Liver | HCC | Kaposi sarcoma-associated herpesvirus infection | 111/4020 | 194/8465 | 3.78e-03 | 1.16e-02 | 6.45e-03 | 111 |
| hsa0414031 | Liver | HCC | Autophagy - animal | 99/4020 | 141/8465 | 3.08e-08 | 4.70e-07 | 2.61e-07 | 99 |
| hsa0516731 | Liver | HCC | Kaposi sarcoma-associated herpesvirus infection | 111/4020 | 194/8465 | 3.78e-03 | 1.16e-02 | 6.45e-03 | 111 |
| hsa0516729 | Oral cavity | OSCC | Kaposi sarcoma-associated herpesvirus infection | 125/3704 | 194/8465 | 3.67e-09 | 3.84e-08 | 1.96e-08 | 125 |
| hsa041409 | Oral cavity | OSCC | Autophagy - animal | 94/3704 | 141/8465 | 2.73e-08 | 2.38e-07 | 1.21e-07 | 94 |
| hsa05167113 | Oral cavity | OSCC | Kaposi sarcoma-associated herpesvirus infection | 125/3704 | 194/8465 | 3.67e-09 | 3.84e-08 | 1.96e-08 | 125 |
| hsa0414014 | Oral cavity | OSCC | Autophagy - animal | 94/3704 | 141/8465 | 2.73e-08 | 2.38e-07 | 1.21e-07 | 94 |
| Page: 1 2 |
Top |
Cell-cell communication analysis |
| Identification of potential cell-cell interactions between two cell types and their ligand-receptor pairs for different disease states |
| Ligand | Receptor | LRpair | Pathway | Tissue | Disease Stage |
| Page: 1 |
Top |
Single-cell gene regulatory network inference analysis |
| Find out the significant the regulons (TFs) and the target genes of each regulon across cell types for different disease states |
| TF | Cell Type | Tissue | Disease Stage | Target Gene | RSS | Regulon Activity |
| ∗The dot plots of a searched regulon are shown for all cell subpopulations in each disease state of each tissue based on the regulon specific score inferred using pySCENIC and by calculating the average expression. |
| Page: 1 |
Top |
Somatic mutation of malignant transformation related genes |
| Annotation of somatic variants for genes involved in malignant transformation |
| Hugo Symbol | Variant Class | Variant Classification | dbSNP RS | HGVSc | HGVSp | HGVSp Short | SWISSPROT | BIOTYPE | SIFT | PolyPhen | Tumor Sample Barcode | Tissue | Histology | Sex | Age | Stage | Therapy Types | Drugs | Outcome |
| ATG3 | SNV | Missense_Mutation | c.601N>A | p.Asp201Asn | p.D201N | Q9NT62 | protein_coding | deleterious(0.04) | probably_damaging(1) | TCGA-AC-A23H-01 | Breast | breast invasive carcinoma | Female | >=65 | I/II | Unknown | Unknown | PD | |
| ATG3 | SNV | Missense_Mutation | c.559N>C | p.Asp187His | p.D187H | Q9NT62 | protein_coding | deleterious(0.02) | possibly_damaging(0.726) | TCGA-AN-A0FL-01 | Breast | breast invasive carcinoma | Female | <65 | I/II | Unknown | Unknown | SD | |
| ATG3 | SNV | Missense_Mutation | novel | c.433N>A | p.Glu145Lys | p.E145K | Q9NT62 | protein_coding | tolerated(0.11) | benign(0.029) | TCGA-EA-A97N-01 | Cervix | cervical & endocervical cancer | Female | <65 | I/II | Unknown | Unknown | SD |
| ATG3 | SNV | Missense_Mutation | c.419C>T | p.Ser140Leu | p.S140L | Q9NT62 | protein_coding | tolerated(0.21) | benign(0.003) | TCGA-Q1-A73O-01 | Cervix | cervical & endocervical cancer | Female | <65 | I/II | Chemotherapy | cisplatin | CR | |
| ATG3 | SNV | Missense_Mutation | novel | c.674N>G | p.Gln225Arg | p.Q225R | Q9NT62 | protein_coding | tolerated(0.43) | benign(0.033) | TCGA-AA-3811-01 | Colorectum | colon adenocarcinoma | Female | >=65 | III/IV | Unknown | Unknown | PD |
| ATG3 | SNV | Missense_Mutation | c.250C>T | p.Arg84Trp | p.R84W | Q9NT62 | protein_coding | tolerated(0.05) | benign(0.421) | TCGA-CK-4951-01 | Colorectum | colon adenocarcinoma | Female | >=65 | I/II | Unknown | Unknown | PD | |
| ATG3 | SNV | Missense_Mutation | c.641N>T | p.Arg214Leu | p.R214L | Q9NT62 | protein_coding | deleterious(0) | probably_damaging(0.979) | TCGA-CM-5341-01 | Colorectum | colon adenocarcinoma | Female | >=65 | III/IV | Chemotherapy | fluorouracil | SD | |
| ATG3 | SNV | Missense_Mutation | novel | c.535N>T | p.Val179Leu | p.V179L | Q9NT62 | protein_coding | tolerated(0.16) | benign(0.003) | TCGA-A5-A0G2-01 | Endometrium | uterine corpus endometrioid carcinoma | Female | <65 | III/IV | Unknown | Unknown | SD |
| ATG3 | SNV | Missense_Mutation | novel | c.363N>C | p.Glu121Asp | p.E121D | Q9NT62 | protein_coding | tolerated(0.36) | benign(0.042) | TCGA-A5-A0G2-01 | Endometrium | uterine corpus endometrioid carcinoma | Female | <65 | III/IV | Unknown | Unknown | SD |
| ATG3 | SNV | Missense_Mutation | novel | c.166N>T | p.Ala56Ser | p.A56S | Q9NT62 | protein_coding | tolerated(0.37) | benign(0.07) | TCGA-A5-A1OF-01 | Endometrium | uterine corpus endometrioid carcinoma | Female | <65 | I/II | Unknown | Unknown | SD |
| Page: 1 2 3 4 |
Top |
Related drugs of malignant transformation related genes |
| Identification of chemicals and drugs interact with genes involved in malignant transfromation |
| (DGIdb 4.0) |
| Entrez ID | Symbol | Category | Interaction Types | Drug Claim Name | Drug Name | PMIDs |
| Page: 1 |

Copyright 2023-Present -The University of Texas Health Science Center at Houston |