
|
|||||
|
 | |
| |
| |
| |
| |
| |
|
Gene: ARG2 |
Gene summary for ARG2 |
| Gene information | Species | Human | Gene symbol | ARG2 | Gene ID | 384 |
| Gene name | arginase 2 | |
| Gene Alias | ARG2 | |
| Cytomap | 14q24.1 | |
| Gene Type | protein-coding | GO ID | GO:0000050 | UniProtAcc | A0A024R6A0 |
Top |
Malignant transformation analysis |
| Identification of the aberrant gene expression in precancerous and cancerous lesions by comparing the gene expression of stem-like cells in diseased tissues with normal stem cells |
| Entrez ID | Symbol | Replicates | Species | Organ | Tissue | Adj P-value | Log2FC | Malignancy |
| 384 | ARG2 | LZE4T | Human | Esophagus | ESCC | 8.89e-07 | 2.96e-01 | 0.0811 |
| 384 | ARG2 | LZE7T | Human | Esophagus | ESCC | 2.88e-06 | 6.06e-01 | 0.0667 |
| 384 | ARG2 | LZE8T | Human | Esophagus | ESCC | 1.73e-11 | 5.16e-01 | 0.067 |
| 384 | ARG2 | LZE22T | Human | Esophagus | ESCC | 7.21e-04 | 5.33e-01 | 0.068 |
| 384 | ARG2 | LZE24T | Human | Esophagus | ESCC | 1.23e-10 | 5.65e-01 | 0.0596 |
| 384 | ARG2 | LZE21T | Human | Esophagus | ESCC | 4.68e-03 | 4.66e-01 | 0.0655 |
| 384 | ARG2 | P1T-E | Human | Esophagus | ESCC | 5.62e-05 | 3.60e-01 | 0.0875 |
| 384 | ARG2 | P2T-E | Human | Esophagus | ESCC | 6.60e-18 | 3.36e-01 | 0.1177 |
| 384 | ARG2 | P4T-E | Human | Esophagus | ESCC | 2.78e-32 | 1.02e+00 | 0.1323 |
| 384 | ARG2 | P5T-E | Human | Esophagus | ESCC | 4.95e-15 | 3.07e-02 | 0.1327 |
| 384 | ARG2 | P8T-E | Human | Esophagus | ESCC | 1.97e-18 | 4.05e-01 | 0.0889 |
| 384 | ARG2 | P9T-E | Human | Esophagus | ESCC | 9.40e-09 | 2.72e-01 | 0.1131 |
| 384 | ARG2 | P10T-E | Human | Esophagus | ESCC | 1.52e-15 | 8.44e-02 | 0.116 |
| 384 | ARG2 | P11T-E | Human | Esophagus | ESCC | 5.22e-05 | 4.20e-01 | 0.1426 |
| 384 | ARG2 | P12T-E | Human | Esophagus | ESCC | 2.31e-29 | 7.20e-01 | 0.1122 |
| 384 | ARG2 | P15T-E | Human | Esophagus | ESCC | 1.32e-24 | 1.00e+00 | 0.1149 |
| 384 | ARG2 | P16T-E | Human | Esophagus | ESCC | 1.20e-09 | 3.12e-01 | 0.1153 |
| 384 | ARG2 | P19T-E | Human | Esophagus | ESCC | 5.86e-04 | 7.38e-01 | 0.1662 |
| 384 | ARG2 | P21T-E | Human | Esophagus | ESCC | 2.41e-13 | 2.50e-01 | 0.1617 |
| 384 | ARG2 | P22T-E | Human | Esophagus | ESCC | 2.89e-08 | 5.06e-02 | 0.1236 |
| Page: 1 2 3 4 5 |
| Tissue | Expression Dynamics | Abbreviation |
| Esophagus |  | ESCC: Esophageal squamous cell carcinoma |
| HGIN: High-grade intraepithelial neoplasias | ||
| LGIN: Low-grade intraepithelial neoplasias | ||
| Lung | 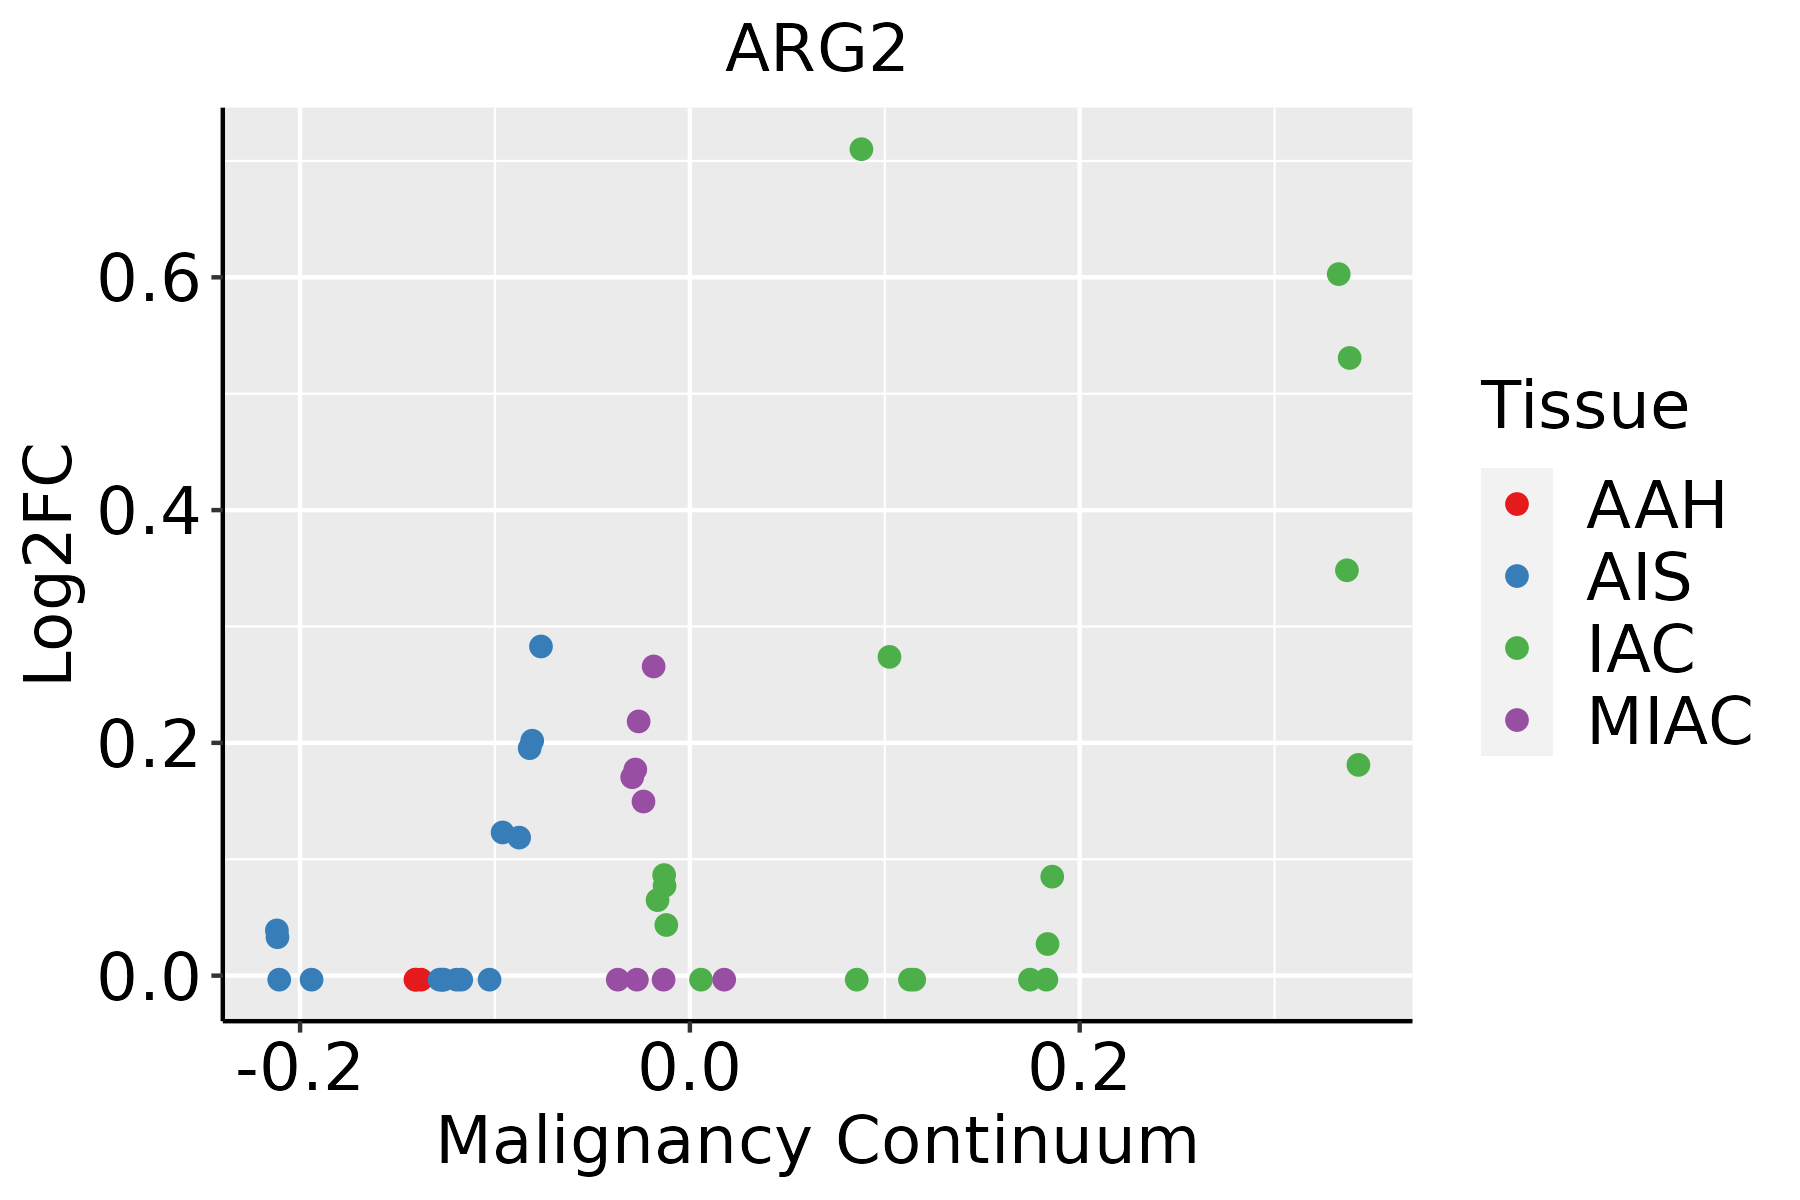 | AAH: Atypical adenomatous hyperplasia |
| AIS: Adenocarcinoma in situ | ||
| IAC: Invasive lung adenocarcinoma | ||
| MIA: Minimally invasive adenocarcinoma | ||
| Oral Cavity | 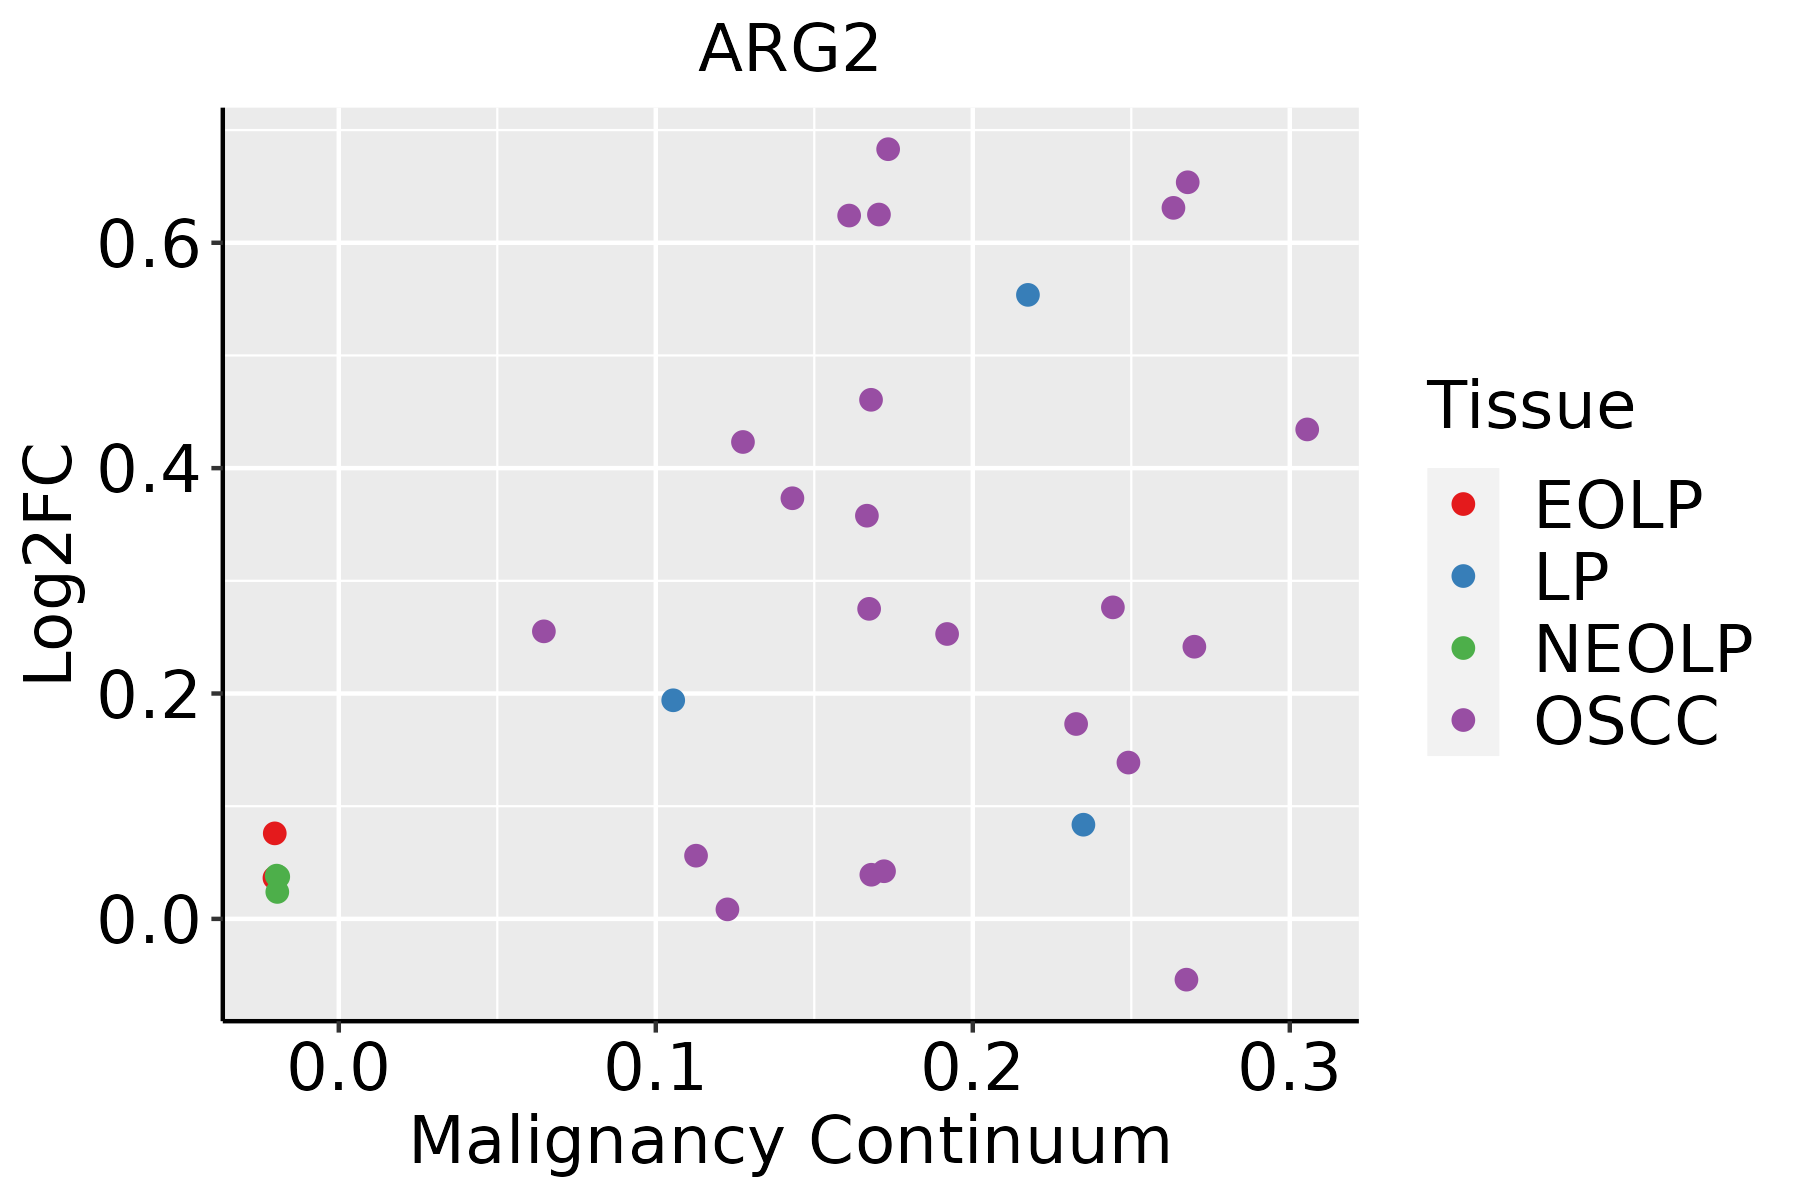 | EOLP: Erosive Oral lichen planus |
| LP: leukoplakia | ||
| NEOLP: Non-erosive oral lichen planus | ||
| OSCC: Oral squamous cell carcinoma | ||
| Prostate |  | BPH: Benign Prostatic Hyperplasia |
| Thyroid | 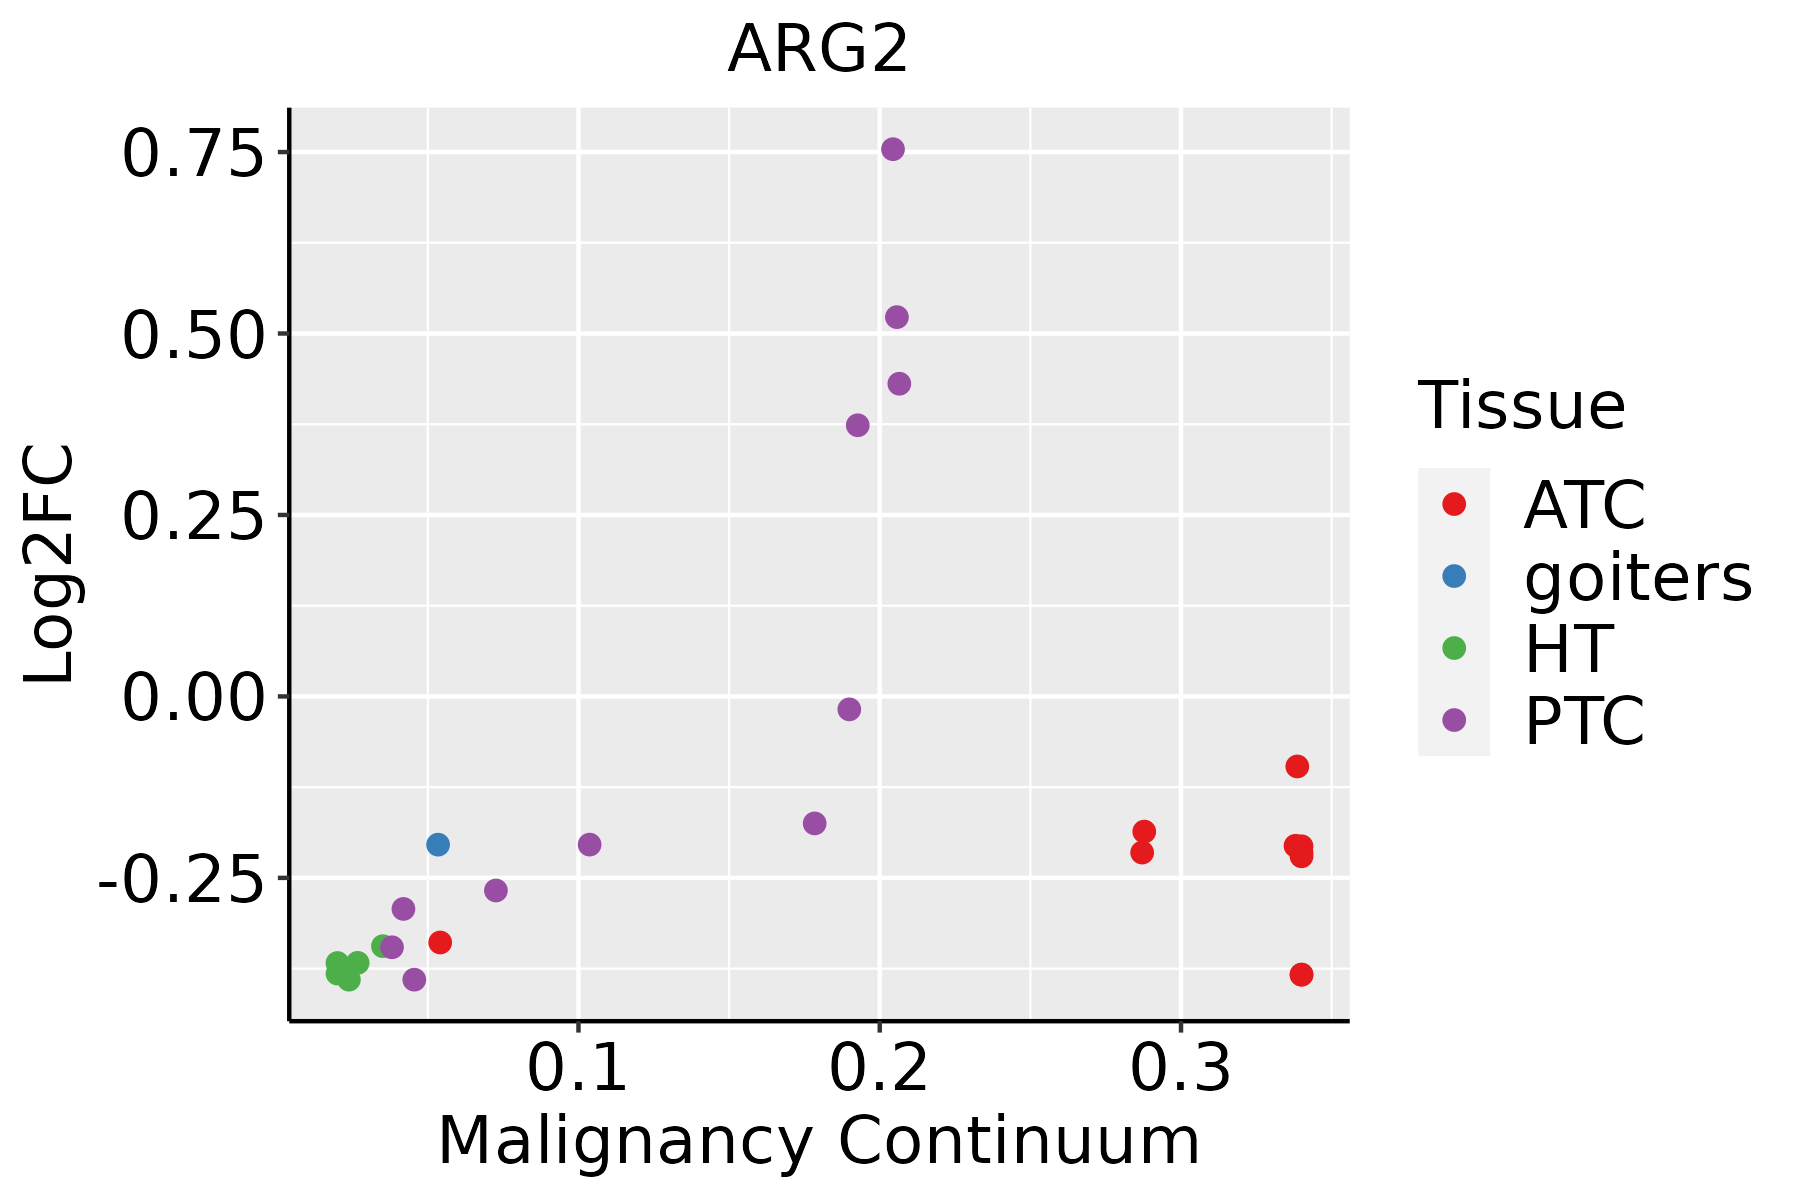 | ATC: Anaplastic thyroid cancer |
| HT: Hashimoto's thyroiditis | ||
| PTC: Papillary thyroid cancer |
| ∗log2FC in expression of this searched gene in stem-like cells from each diseased tissue sample relative to stem-like cells in normal samples in each tissue plotted against the malignancy continuum. Samples are colored based on if they are from different disease stage. |
Top |
Malignant transformation related pathway analysis |
| Find out the enriched GO biological processes and KEGG pathways involved in transition from healthy to precancer to cancer |
| Tissue | Disease Stage | Enriched GO biological Processes |
| Colorectum | AD |  |
| Colorectum | SER |  |
| Colorectum | MSS |  |
| Colorectum | MSI-H |  |
| Colorectum | FAP |  |
| ∗Top 15 enriched GO BP terms are showed in the bar plot of each disease state in each tissue. Each row represents a significant GO biological process which is colored according to the -log10(p.adjust). |
| Page: 1 2 3 4 5 6 7 8 9 |
| GO ID | Tissue | Disease Stage | Description | Gene Ratio | Bg Ratio | pvalue | p.adjust | Count |
| GO:004209815 | Prostate | Tumor | T cell proliferation | 49/3246 | 199/18723 | 5.61e-03 | 2.63e-02 | 49 |
| GO:000182312 | Prostate | Tumor | mesonephros development | 27/3246 | 96/18723 | 5.77e-03 | 2.68e-02 | 27 |
| GO:007216312 | Prostate | Tumor | mesonephric epithelium development | 26/3246 | 92/18723 | 6.22e-03 | 2.87e-02 | 26 |
| GO:007216412 | Prostate | Tumor | mesonephric tubule development | 26/3246 | 92/18723 | 6.22e-03 | 2.87e-02 | 26 |
| GO:00028316 | Prostate | Tumor | regulation of response to biotic stimulus | 74/3246 | 327/18723 | 8.03e-03 | 3.54e-02 | 74 |
| GO:004212914 | Prostate | Tumor | regulation of T cell proliferation | 42/3246 | 171/18723 | 1.02e-02 | 4.28e-02 | 42 |
| GO:007066314 | Prostate | Tumor | regulation of leukocyte proliferation | 57/3246 | 245/18723 | 1.04e-02 | 4.36e-02 | 57 |
| GO:00326408 | Prostate | Tumor | tumor necrosis factor production | 44/3246 | 181/18723 | 1.05e-02 | 4.38e-02 | 44 |
| GO:00326808 | Prostate | Tumor | regulation of tumor necrosis factor production | 44/3246 | 181/18723 | 1.05e-02 | 4.38e-02 | 44 |
| GO:00717068 | Prostate | Tumor | tumor necrosis factor superfamily cytokine production | 45/3246 | 186/18723 | 1.06e-02 | 4.42e-02 | 45 |
| GO:19035558 | Prostate | Tumor | regulation of tumor necrosis factor superfamily cytokine production | 45/3246 | 186/18723 | 1.06e-02 | 4.42e-02 | 45 |
| GO:005086319 | Thyroid | HT | regulation of T cell activation | 51/1272 | 329/18723 | 2.58e-08 | 1.97e-06 | 51 |
| GO:002240726 | Thyroid | HT | regulation of cell-cell adhesion | 63/1272 | 448/18723 | 2.83e-08 | 2.07e-06 | 63 |
| GO:000715920 | Thyroid | HT | leukocyte cell-cell adhesion | 54/1272 | 371/18723 | 8.84e-08 | 5.23e-06 | 54 |
| GO:007259320 | Thyroid | HT | reactive oxygen species metabolic process | 39/1272 | 239/18723 | 2.90e-07 | 1.38e-05 | 39 |
| GO:190303720 | Thyroid | HT | regulation of leukocyte cell-cell adhesion | 49/1272 | 336/18723 | 3.27e-07 | 1.52e-05 | 49 |
| GO:004211020 | Thyroid | HT | T cell activation | 63/1272 | 487/18723 | 5.95e-07 | 2.51e-05 | 63 |
| GO:004212917 | Thyroid | HT | regulation of T cell proliferation | 29/1272 | 171/18723 | 4.30e-06 | 1.39e-04 | 29 |
| GO:004209819 | Thyroid | HT | T cell proliferation | 32/1272 | 199/18723 | 4.53e-06 | 1.45e-04 | 32 |
| GO:007066110 | Thyroid | HT | leukocyte proliferation | 44/1272 | 318/18723 | 5.29e-06 | 1.64e-04 | 44 |
| Page: 1 2 3 4 5 6 7 8 9 10 11 |
| Pathway ID | Tissue | Disease Stage | Description | Gene Ratio | Bg Ratio | pvalue | p.adjust | qvalue | Count |
| hsa0123023 | Esophagus | ESCC | Biosynthesis of amino acids | 49/4205 | 75/8465 | 4.35e-03 | 1.12e-02 | 5.74e-03 | 49 |
| hsa0123033 | Esophagus | ESCC | Biosynthesis of amino acids | 49/4205 | 75/8465 | 4.35e-03 | 1.12e-02 | 5.74e-03 | 49 |
| hsa051468 | Oral cavity | OSCC | Amoebiasis | 59/3704 | 102/8465 | 2.78e-03 | 7.17e-03 | 3.65e-03 | 59 |
| hsa012305 | Oral cavity | OSCC | Biosynthesis of amino acids | 45/3704 | 75/8465 | 3.27e-03 | 8.23e-03 | 4.19e-03 | 45 |
| hsa0033010 | Oral cavity | OSCC | Arginine and proline metabolism | 30/3704 | 50/8465 | 1.50e-02 | 3.26e-02 | 1.66e-02 | 30 |
| hsa0514615 | Oral cavity | OSCC | Amoebiasis | 59/3704 | 102/8465 | 2.78e-03 | 7.17e-03 | 3.65e-03 | 59 |
| hsa0123012 | Oral cavity | OSCC | Biosynthesis of amino acids | 45/3704 | 75/8465 | 3.27e-03 | 8.23e-03 | 4.19e-03 | 45 |
| hsa0033013 | Oral cavity | OSCC | Arginine and proline metabolism | 30/3704 | 50/8465 | 1.50e-02 | 3.26e-02 | 1.66e-02 | 30 |
| hsa051467 | Prostate | BPH | Amoebiasis | 33/1718 | 102/8465 | 2.70e-03 | 1.05e-02 | 6.49e-03 | 33 |
| hsa003309 | Prostate | BPH | Arginine and proline metabolism | 18/1718 | 50/8465 | 7.17e-03 | 2.32e-02 | 1.43e-02 | 18 |
| hsa0514614 | Prostate | BPH | Amoebiasis | 33/1718 | 102/8465 | 2.70e-03 | 1.05e-02 | 6.49e-03 | 33 |
| hsa0033012 | Prostate | BPH | Arginine and proline metabolism | 18/1718 | 50/8465 | 7.17e-03 | 2.32e-02 | 1.43e-02 | 18 |
| Page: 1 |
Top |
Cell-cell communication analysis |
| Identification of potential cell-cell interactions between two cell types and their ligand-receptor pairs for different disease states |
| Ligand | Receptor | LRpair | Pathway | Tissue | Disease Stage |
| Page: 1 |
Top |
Single-cell gene regulatory network inference analysis |
| Find out the significant the regulons (TFs) and the target genes of each regulon across cell types for different disease states |
| TF | Cell Type | Tissue | Disease Stage | Target Gene | RSS | Regulon Activity |
| ∗The dot plots of a searched regulon are shown for all cell subpopulations in each disease state of each tissue based on the regulon specific score inferred using pySCENIC and by calculating the average expression. |
| Page: 1 |
Top |
Somatic mutation of malignant transformation related genes |
| Annotation of somatic variants for genes involved in malignant transformation |
| Hugo Symbol | Variant Class | Variant Classification | dbSNP RS | HGVSc | HGVSp | HGVSp Short | SWISSPROT | BIOTYPE | SIFT | PolyPhen | Tumor Sample Barcode | Tissue | Histology | Sex | Age | Stage | Therapy Types | Drugs | Outcome |
| ARG2 | SNV | Missense_Mutation | c.890N>C | p.Val297Ala | p.V297A | P78540 | protein_coding | deleterious(0) | probably_damaging(0.999) | TCGA-A8-A06T-01 | Breast | breast invasive carcinoma | Female | >=65 | III/IV | Hormone Therapy | anastrozole | SD | |
| ARG2 | SNV | Missense_Mutation | novel | c.14N>C | p.Gly5Ala | p.G5A | P78540 | protein_coding | tolerated(0.14) | benign(0) | TCGA-E2-A15K-06 | Breast | breast invasive carcinoma | Female | <65 | I/II | Chemotherapy | adriamycin | SD |
| ARG2 | SNV | Missense_Mutation | novel | c.715N>G | p.Ile239Val | p.I239V | P78540 | protein_coding | tolerated(0.51) | benign(0.013) | TCGA-AA-3950-01 | Colorectum | colon adenocarcinoma | Female | >=65 | I/II | Unknown | Unknown | SD |
| ARG2 | SNV | Missense_Mutation | c.208N>T | p.Asp70Tyr | p.D70Y | P78540 | protein_coding | deleterious(0) | probably_damaging(0.998) | TCGA-AA-A00N-01 | Colorectum | colon adenocarcinoma | Male | >=65 | I/II | Unknown | Unknown | PD | |
| ARG2 | SNV | Missense_Mutation | c.661N>T | p.Asp221Tyr | p.D221Y | P78540 | protein_coding | deleterious(0) | probably_damaging(0.966) | TCGA-AA-A010-01 | Colorectum | colon adenocarcinoma | Female | <65 | I/II | Chemotherapy | folinic | CR | |
| ARG2 | SNV | Missense_Mutation | novel | c.71N>C | p.His24Pro | p.H24P | P78540 | protein_coding | deleterious(0.03) | benign(0.014) | TCGA-AA-A01R-01 | Colorectum | colon adenocarcinoma | Male | <65 | III/IV | Chemotherapy | 5-fluorouracil | PD |
| ARG2 | SNV | Missense_Mutation | rs568264895 | c.698G>A | p.Arg233Gln | p.R233Q | P78540 | protein_coding | tolerated(0.41) | benign(0) | TCGA-CA-6717-01 | Colorectum | colon adenocarcinoma | Male | <65 | I/II | Chemotherapy | oxaliplatin | CR |
| ARG2 | SNV | Missense_Mutation | c.251N>T | p.Asn84Ile | p.N84I | P78540 | protein_coding | deleterious(0.03) | benign(0.119) | TCGA-G4-6586-01 | Colorectum | colon adenocarcinoma | Female | >=65 | I/II | Unknown | Unknown | SD | |
| ARG2 | SNV | Missense_Mutation | novel | c.989G>A | p.Gly330Glu | p.G330E | P78540 | protein_coding | tolerated(0.23) | benign(0.045) | TCGA-A5-A0G1-01 | Endometrium | uterine corpus endometrioid carcinoma | Female | >=65 | I/II | Unknown | Unknown | SD |
| ARG2 | SNV | Missense_Mutation | rs570385517 | c.268C>T | p.Arg90Cys | p.R90C | P78540 | protein_coding | deleterious(0) | probably_damaging(0.996) | TCGA-A5-A0G2-01 | Endometrium | uterine corpus endometrioid carcinoma | Female | <65 | III/IV | Unknown | Unknown | SD |
| Page: 1 2 3 4 |
Top |
Related drugs of malignant transformation related genes |
| Identification of chemicals and drugs interact with genes involved in malignant transfromation |
| (DGIdb 4.0) |
| Entrez ID | Symbol | Category | Interaction Types | Drug Claim Name | Drug Name | PMIDs |
| 384 | ARG2 | ENZYME | Difluoromethylornithine | |||
| 384 | ARG2 | ENZYME | inhibitor | 178101800 | ||
| 384 | ARG2 | ENZYME | inhibitor | 315661102 |
| Page: 1 |

Copyright 2023-Present -The University of Texas Health Science Center at Houston |