
|
|||||
|
 | |
| |
| |
| |
| |
| |
|
Gene: ABCC2 |
Gene summary for ABCC2 |
| Gene information | Species | Human | Gene symbol | ABCC2 | Gene ID | 1244 |
| Gene name | ATP binding cassette subfamily C member 2 | |
| Gene Alias | ABC30 | |
| Cytomap | 10q24.2 | |
| Gene Type | protein-coding | GO ID | GO:0000003 | UniProtAcc | Q92887 |
Top |
Malignant transformation analysis |
| Identification of the aberrant gene expression in precancerous and cancerous lesions by comparing the gene expression of stem-like cells in diseased tissues with normal stem cells |
| Entrez ID | Symbol | Replicates | Species | Organ | Tissue | Adj P-value | Log2FC | Malignancy |
| 1244 | ABCC2 | NAFLD1 | Human | Liver | NAFLD | 2.40e-12 | 1.09e+00 | -0.04 |
| 1244 | ABCC2 | S43 | Human | Liver | Cirrhotic | 7.08e-07 | -2.57e-01 | -0.0187 |
| 1244 | ABCC2 | HCC1_Meng | Human | Liver | HCC | 1.66e-100 | -2.07e-03 | 0.0246 |
| 1244 | ABCC2 | HCC2_Meng | Human | Liver | HCC | 1.01e-10 | -3.11e-01 | 0.0107 |
| 1244 | ABCC2 | cirrhotic1 | Human | Liver | Cirrhotic | 2.73e-09 | -3.05e-01 | 0.0202 |
| 1244 | ABCC2 | cirrhotic2 | Human | Liver | Cirrhotic | 4.58e-11 | -3.13e-01 | 0.0201 |
| 1244 | ABCC2 | cirrhotic3 | Human | Liver | Cirrhotic | 1.46e-04 | -3.13e-01 | 0.0215 |
| 1244 | ABCC2 | HCC1 | Human | Liver | HCC | 1.35e-17 | 4.56e+00 | 0.5336 |
| 1244 | ABCC2 | HCC2 | Human | Liver | HCC | 4.19e-37 | 5.72e+00 | 0.5341 |
| 1244 | ABCC2 | HCC5 | Human | Liver | HCC | 1.62e-05 | 3.32e+00 | 0.4932 |
| 1244 | ABCC2 | Pt13.a | Human | Liver | HCC | 3.24e-04 | -2.26e-01 | 0.021 |
| 1244 | ABCC2 | Pt13.b | Human | Liver | HCC | 3.44e-05 | -2.15e-01 | 0.0251 |
| 1244 | ABCC2 | Pt14.d | Human | Liver | HCC | 1.45e-03 | -2.25e-01 | 0.0143 |
| 1244 | ABCC2 | S014 | Human | Liver | HCC | 3.37e-21 | 1.07e+00 | 0.2254 |
| 1244 | ABCC2 | S015 | Human | Liver | HCC | 1.11e-25 | 1.57e+00 | 0.2375 |
| 1244 | ABCC2 | S016 | Human | Liver | HCC | 3.77e-29 | 1.17e+00 | 0.2243 |
| 1244 | ABCC2 | S027 | Human | Liver | HCC | 6.64e-06 | 1.16e+00 | 0.2446 |
| 1244 | ABCC2 | S028 | Human | Liver | HCC | 1.41e-22 | 1.23e+00 | 0.2503 |
| 1244 | ABCC2 | S029 | Human | Liver | HCC | 1.17e-25 | 1.63e+00 | 0.2581 |
| Page: 1 |
| Tissue | Expression Dynamics | Abbreviation |
| Liver | 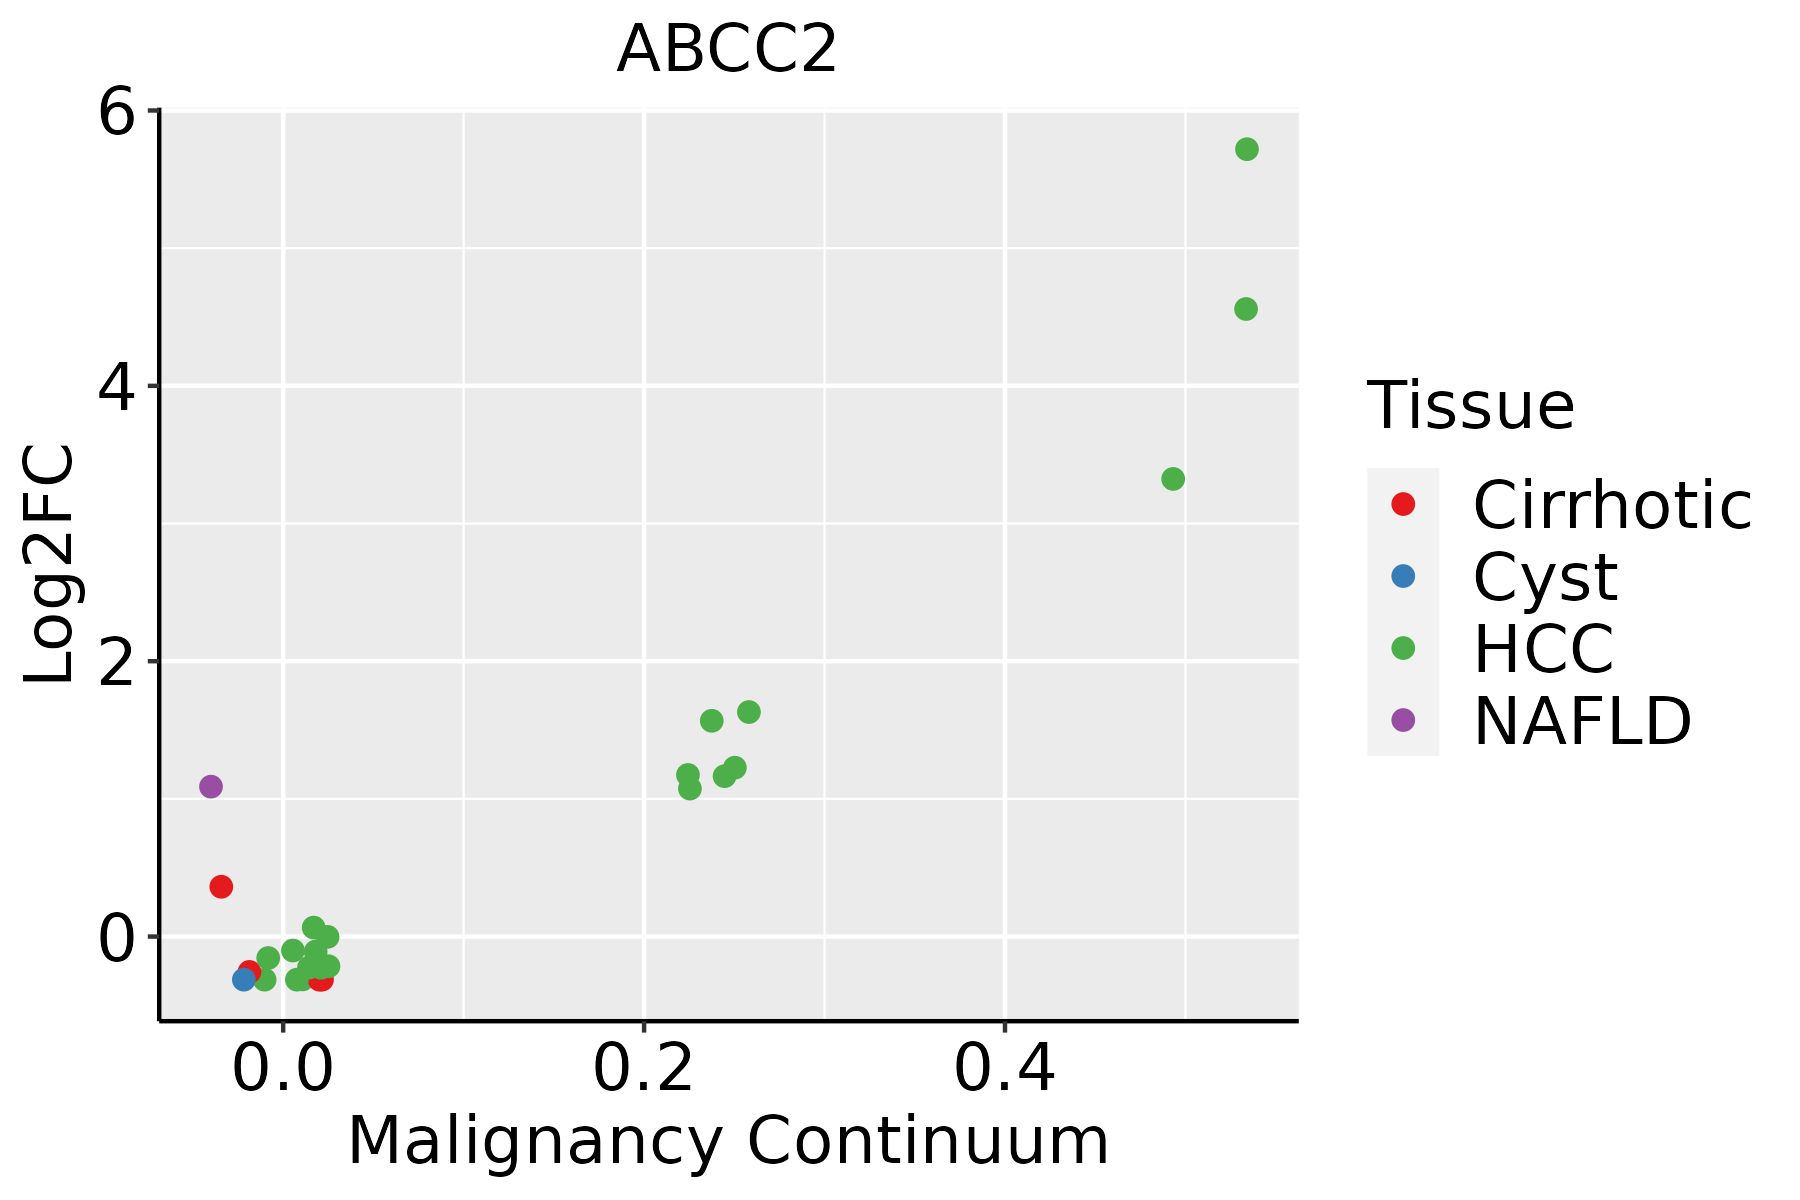 | HCC: Hepatocellular carcinoma |
| NAFLD: Non-alcoholic fatty liver disease |
| ∗log2FC in expression of this searched gene in stem-like cells from each diseased tissue sample relative to stem-like cells in normal samples in each tissue plotted against the malignancy continuum. Samples are colored based on if they are from different disease stage. |
Top |
Malignant transformation related pathway analysis |
| Find out the enriched GO biological processes and KEGG pathways involved in transition from healthy to precancer to cancer |
| Tissue | Disease Stage | Enriched GO biological Processes |
| Colorectum | AD |  |
| Colorectum | SER |  |
| Colorectum | MSS |  |
| Colorectum | MSI-H |  |
| Colorectum | FAP |  |
| ∗Top 15 enriched GO BP terms are showed in the bar plot of each disease state in each tissue. Each row represents a significant GO biological process which is colored according to the -log10(p.adjust). |
| Page: 1 2 3 4 5 6 7 8 9 |
| GO ID | Tissue | Disease Stage | Description | Gene Ratio | Bg Ratio | pvalue | p.adjust | Count |
| GO:00000411 | Liver | HCC | transition metal ion transport | 59/7958 | 105/18723 | 3.18e-03 | 1.47e-02 | 59 |
| GO:015010411 | Liver | HCC | transport across blood-brain barrier | 50/7958 | 87/18723 | 3.42e-03 | 1.55e-02 | 50 |
| GO:00436271 | Liver | HCC | response to estrogen | 44/7958 | 75/18723 | 3.44e-03 | 1.55e-02 | 44 |
| GO:00714662 | Liver | HCC | cellular response to xenobiotic stimulus | 93/7958 | 177/18723 | 4.35e-03 | 1.89e-02 | 93 |
| GO:001023211 | Liver | HCC | vascular transport | 50/7958 | 88/18723 | 4.69e-03 | 2.02e-02 | 50 |
| GO:00712196 | Liver | HCC | cellular response to molecule of bacterial origin | 113/7958 | 221/18723 | 5.73e-03 | 2.38e-02 | 113 |
| GO:00075651 | Liver | HCC | female pregnancy | 99/7958 | 193/18723 | 8.24e-03 | 3.23e-02 | 99 |
| GO:00713471 | Liver | HCC | cellular response to interleukin-1 | 61/7958 | 113/18723 | 8.98e-03 | 3.46e-02 | 61 |
| GO:007135611 | Liver | HCC | cellular response to tumor necrosis factor | 115/7958 | 229/18723 | 1.08e-02 | 3.99e-02 | 115 |
| Page: 1 2 3 4 5 6 7 |
| Pathway ID | Tissue | Disease Stage | Description | Gene Ratio | Bg Ratio | pvalue | p.adjust | qvalue | Count |
| hsa02010 | Liver | NAFLD | ABC transporters | 16/1043 | 45/8465 | 4.97e-05 | 1.16e-03 | 9.37e-04 | 16 |
| hsa049762 | Liver | NAFLD | Bile secretion | 20/1043 | 89/8465 | 5.08e-03 | 4.43e-02 | 3.57e-02 | 20 |
| hsa020101 | Liver | NAFLD | ABC transporters | 16/1043 | 45/8465 | 4.97e-05 | 1.16e-03 | 9.37e-04 | 16 |
| hsa0497611 | Liver | NAFLD | Bile secretion | 20/1043 | 89/8465 | 5.08e-03 | 4.43e-02 | 3.57e-02 | 20 |
| hsa015244 | Liver | Cirrhotic | Platinum drug resistance | 34/2530 | 73/8465 | 1.86e-03 | 8.37e-03 | 5.16e-03 | 34 |
| hsa0152411 | Liver | Cirrhotic | Platinum drug resistance | 34/2530 | 73/8465 | 1.86e-03 | 8.37e-03 | 5.16e-03 | 34 |
| hsa015242 | Liver | HCC | Platinum drug resistance | 52/4020 | 73/8465 | 3.14e-05 | 1.88e-04 | 1.04e-04 | 52 |
| hsa020102 | Liver | HCC | ABC transporters | 29/4020 | 45/8465 | 1.62e-02 | 3.88e-02 | 2.16e-02 | 29 |
| hsa015243 | Liver | HCC | Platinum drug resistance | 52/4020 | 73/8465 | 3.14e-05 | 1.88e-04 | 1.04e-04 | 52 |
| hsa020103 | Liver | HCC | ABC transporters | 29/4020 | 45/8465 | 1.62e-02 | 3.88e-02 | 2.16e-02 | 29 |
| Page: 1 |
Top |
Cell-cell communication analysis |
| Identification of potential cell-cell interactions between two cell types and their ligand-receptor pairs for different disease states |
| Ligand | Receptor | LRpair | Pathway | Tissue | Disease Stage |
| Page: 1 |
Top |
Single-cell gene regulatory network inference analysis |
| Find out the significant the regulons (TFs) and the target genes of each regulon across cell types for different disease states |
| TF | Cell Type | Tissue | Disease Stage | Target Gene | RSS | Regulon Activity |
| ∗The dot plots of a searched regulon are shown for all cell subpopulations in each disease state of each tissue based on the regulon specific score inferred using pySCENIC and by calculating the average expression. |
| Page: 1 |
Top |
Somatic mutation of malignant transformation related genes |
| Annotation of somatic variants for genes involved in malignant transformation |
| Hugo Symbol | Variant Class | Variant Classification | dbSNP RS | HGVSc | HGVSp | HGVSp Short | SWISSPROT | BIOTYPE | SIFT | PolyPhen | Tumor Sample Barcode | Tissue | Histology | Sex | Age | Stage | Therapy Types | Drugs | Outcome |
| ABCC2 | SNV | Missense_Mutation | c.1815N>C | p.Gln605His | p.Q605H | Q92887 | protein_coding | deleterious(0.01) | probably_damaging(0.993) | TCGA-A2-A0YH-01 | Breast | breast invasive carcinoma | Female | <65 | III/IV | Chemotherapy | adriamycin | SD | |
| ABCC2 | SNV | Missense_Mutation | rs748245551 | c.412N>A | p.Leu138Ile | p.L138I | Q92887 | protein_coding | tolerated(0.11) | benign(0.266) | TCGA-AN-A046-01 | Breast | breast invasive carcinoma | Female | >=65 | I/II | Unknown | Unknown | SD |
| ABCC2 | SNV | Missense_Mutation | rs754646220 | c.4285N>A | p.Glu1429Lys | p.E1429K | Q92887 | protein_coding | deleterious(0.02) | probably_damaging(0.916) | TCGA-AN-A046-01 | Breast | breast invasive carcinoma | Female | >=65 | I/II | Unknown | Unknown | SD |
| ABCC2 | SNV | Missense_Mutation | rs759540575 | c.4585N>C | p.Tyr1529His | p.Y1529H | Q92887 | protein_coding | deleterious(0.05) | possibly_damaging(0.778) | TCGA-AN-A0XN-01 | Breast | breast invasive carcinoma | Female | >=65 | III/IV | Unknown | Unknown | SD |
| ABCC2 | SNV | Missense_Mutation | rs754646220 | c.4285N>A | p.Glu1429Lys | p.E1429K | Q92887 | protein_coding | deleterious(0.02) | probably_damaging(0.916) | TCGA-AR-A0TX-01 | Breast | breast invasive carcinoma | Female | <65 | I/II | Unknown | Unknown | SD |
| ABCC2 | SNV | Missense_Mutation | rs377550597 | c.3436N>T | p.Arg1146Cys | p.R1146C | Q92887 | protein_coding | deleterious(0.05) | probably_damaging(1) | TCGA-AR-A0U3-01 | Breast | breast invasive carcinoma | Female | <65 | I/II | Chemotherapy | doxorubicin | SD |
| ABCC2 | SNV | Missense_Mutation | c.1590G>C | p.Lys530Asn | p.K530N | Q92887 | protein_coding | tolerated(0.37) | benign(0.093) | TCGA-BH-A0W7-01 | Breast | breast invasive carcinoma | Female | <65 | I/II | Chemotherapy | taxotere | CR | |
| ABCC2 | SNV | Missense_Mutation | rs751269660 | c.3806T>G | p.Val1269Gly | p.V1269G | Q92887 | protein_coding | deleterious(0) | possibly_damaging(0.703) | TCGA-D8-A1J8-01 | Breast | breast invasive carcinoma | Female | >=65 | I/II | Hormone Therapy | nolvadex | SD |
| ABCC2 | SNV | Missense_Mutation | novel | c.2008A>G | p.Ile670Val | p.I670V | Q92887 | protein_coding | tolerated(1) | benign(0) | TCGA-D8-A1XK-01 | Breast | breast invasive carcinoma | Female | <65 | I/II | Chemotherapy | doxorubicine+cyclophosphamide | SD |
| ABCC2 | SNV | Missense_Mutation | c.3610A>T | p.Asn1204Tyr | p.N1204Y | Q92887 | protein_coding | deleterious(0) | probably_damaging(0.998) | TCGA-D8-A1XK-01 | Breast | breast invasive carcinoma | Female | <65 | I/II | Chemotherapy | doxorubicine+cyclophosphamide | SD |
| Page: 1 2 3 4 5 6 7 8 9 10 11 12 13 14 15 16 17 18 19 |
Top |
Related drugs of malignant transformation related genes |
| Identification of chemicals and drugs interact with genes involved in malignant transfromation |
| (DGIdb 4.0) |
| Entrez ID | Symbol | Category | Interaction Types | Drug Claim Name | Drug Name | PMIDs |
| 1244 | ABCC2 | TRANSPORTER, DRUGGABLE GENOME, ABC TRANSPORTER, CELL SURFACE | tamoxifen | TAMOXIFEN | ||
| 1244 | ABCC2 | TRANSPORTER, DRUGGABLE GENOME, ABC TRANSPORTER, CELL SURFACE | doxorubicin | DOXORUBICIN | 16330681 | |
| 1244 | ABCC2 | TRANSPORTER, DRUGGABLE GENOME, ABC TRANSPORTER, CELL SURFACE | mycophenolic acid | 25163792,28624888 | ||
| 1244 | ABCC2 | TRANSPORTER, DRUGGABLE GENOME, ABC TRANSPORTER, CELL SURFACE | SN-38 | 7-ETHYL-10-HYDROXYCAMPTOTHECIN | ||
| 1244 | ABCC2 | TRANSPORTER, DRUGGABLE GENOME, ABC TRANSPORTER, CELL SURFACE | Drugs For Treatment Of Tuberculosis | 31648372 | ||
| 1244 | ABCC2 | TRANSPORTER, DRUGGABLE GENOME, ABC TRANSPORTER, CELL SURFACE | deferasirox | DEFERASIROX | 25348619,26403473 | |
| 1244 | ABCC2 | TRANSPORTER, DRUGGABLE GENOME, ABC TRANSPORTER, CELL SURFACE | CEFACLOR | CEFACLOR | 22166395 | |
| 1244 | ABCC2 | TRANSPORTER, DRUGGABLE GENOME, ABC TRANSPORTER, CELL SURFACE | ritonavir | RITONAVIR | 26287941 | |
| 1244 | ABCC2 | TRANSPORTER, DRUGGABLE GENOME, ABC TRANSPORTER, CELL SURFACE | pravastatin | PRAVASTATIN | 17047488 | |
| 1244 | ABCC2 | TRANSPORTER, DRUGGABLE GENOME, ABC TRANSPORTER, CELL SURFACE | methotrexate | METHOTREXATE | 27217051,24241962,29791011,23069858,25502615,23222202,21317831,18381794 |
| Page: 1 2 3 4 5 6 7 |

Copyright 2023-Present -The University of Texas Health Science Center at Houston |