
|
|||||
|
 | |
| |
| |
| |
| |
| |
|
Gene: AACS |
Gene summary for AACS |
| Gene information | Species | Human | Gene symbol | AACS | Gene ID | 65985 |
| Gene name | acetoacetyl-CoA synthetase | |
| Gene Alias | ACSF1 | |
| Cytomap | 12q24.31 | |
| Gene Type | protein-coding | GO ID | GO:0001678 | UniProtAcc | Q86V21 |
Top |
Malignant transformation analysis |
| Identification of the aberrant gene expression in precancerous and cancerous lesions by comparing the gene expression of stem-like cells in diseased tissues with normal stem cells |
| Entrez ID | Symbol | Replicates | Species | Organ | Tissue | Adj P-value | Log2FC | Malignancy |
| 65985 | AACS | LZE24T | Human | Esophagus | ESCC | 1.53e-08 | 3.01e-01 | 0.0596 |
| 65985 | AACS | P1T-E | Human | Esophagus | ESCC | 7.87e-05 | 1.69e-01 | 0.0875 |
| 65985 | AACS | P2T-E | Human | Esophagus | ESCC | 1.13e-21 | 3.35e-01 | 0.1177 |
| 65985 | AACS | P4T-E | Human | Esophagus | ESCC | 8.55e-13 | 3.91e-01 | 0.1323 |
| 65985 | AACS | P5T-E | Human | Esophagus | ESCC | 8.85e-15 | 2.44e-01 | 0.1327 |
| 65985 | AACS | P8T-E | Human | Esophagus | ESCC | 9.81e-13 | 2.38e-01 | 0.0889 |
| 65985 | AACS | P9T-E | Human | Esophagus | ESCC | 3.45e-07 | 5.87e-02 | 0.1131 |
| 65985 | AACS | P10T-E | Human | Esophagus | ESCC | 3.16e-15 | 2.11e-01 | 0.116 |
| 65985 | AACS | P11T-E | Human | Esophagus | ESCC | 6.14e-06 | 2.59e-01 | 0.1426 |
| 65985 | AACS | P12T-E | Human | Esophagus | ESCC | 1.75e-15 | 2.45e-01 | 0.1122 |
| 65985 | AACS | P15T-E | Human | Esophagus | ESCC | 1.70e-16 | 2.15e-01 | 0.1149 |
| 65985 | AACS | P16T-E | Human | Esophagus | ESCC | 4.77e-07 | 2.02e-01 | 0.1153 |
| 65985 | AACS | P17T-E | Human | Esophagus | ESCC | 3.30e-04 | 1.94e-01 | 0.1278 |
| 65985 | AACS | P19T-E | Human | Esophagus | ESCC | 2.44e-02 | 6.31e-01 | 0.1662 |
| 65985 | AACS | P20T-E | Human | Esophagus | ESCC | 5.69e-21 | 4.03e-01 | 0.1124 |
| 65985 | AACS | P21T-E | Human | Esophagus | ESCC | 6.04e-14 | 2.79e-01 | 0.1617 |
| 65985 | AACS | P22T-E | Human | Esophagus | ESCC | 3.13e-06 | 1.20e-01 | 0.1236 |
| 65985 | AACS | P23T-E | Human | Esophagus | ESCC | 9.20e-12 | 3.89e-01 | 0.108 |
| 65985 | AACS | P24T-E | Human | Esophagus | ESCC | 4.05e-09 | 1.58e-01 | 0.1287 |
| 65985 | AACS | P26T-E | Human | Esophagus | ESCC | 2.02e-09 | 1.13e-01 | 0.1276 |
| Page: 1 2 3 4 5 |
| Tissue | Expression Dynamics | Abbreviation |
| Esophagus |  | ESCC: Esophageal squamous cell carcinoma |
| HGIN: High-grade intraepithelial neoplasias | ||
| LGIN: Low-grade intraepithelial neoplasias | ||
| Liver |  | HCC: Hepatocellular carcinoma |
| NAFLD: Non-alcoholic fatty liver disease | ||
| Oral Cavity | 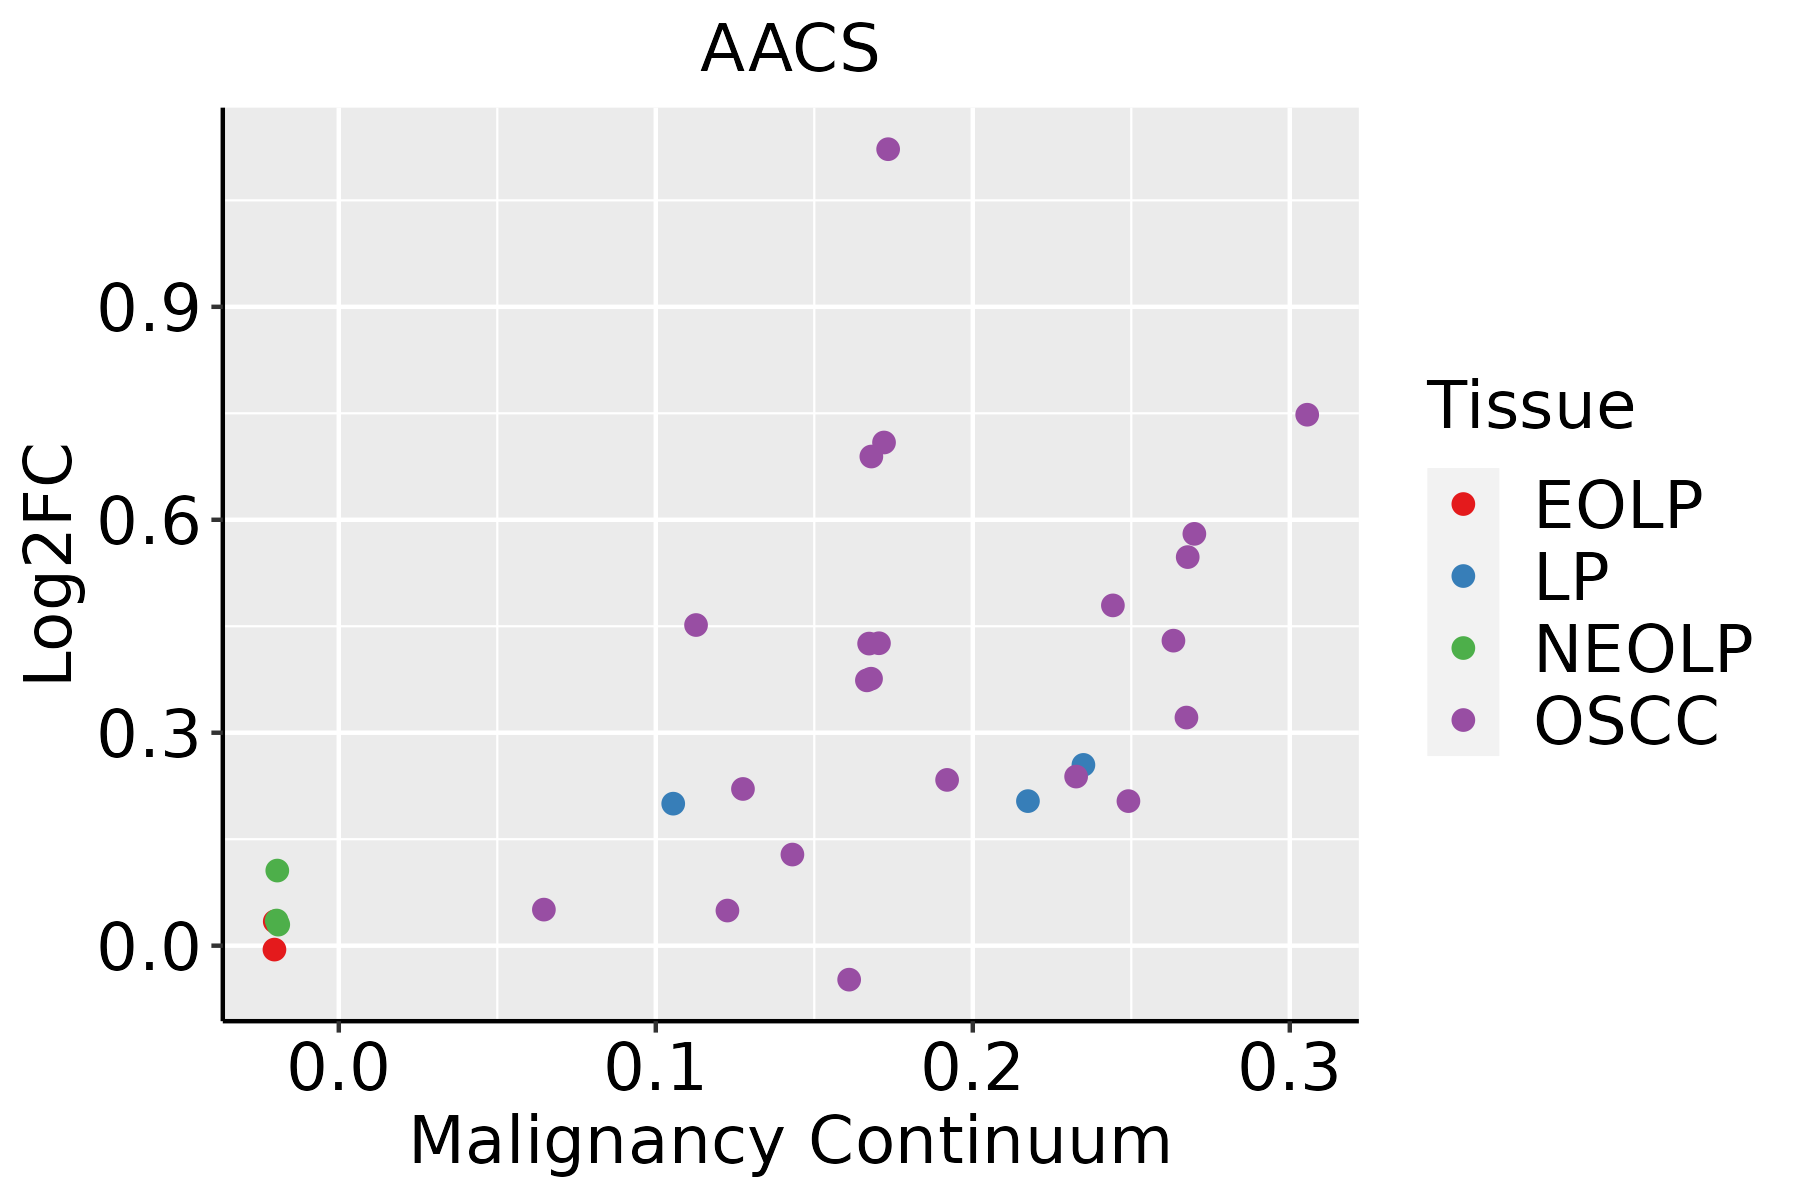 | EOLP: Erosive Oral lichen planus |
| LP: leukoplakia | ||
| NEOLP: Non-erosive oral lichen planus | ||
| OSCC: Oral squamous cell carcinoma | ||
| Thyroid | 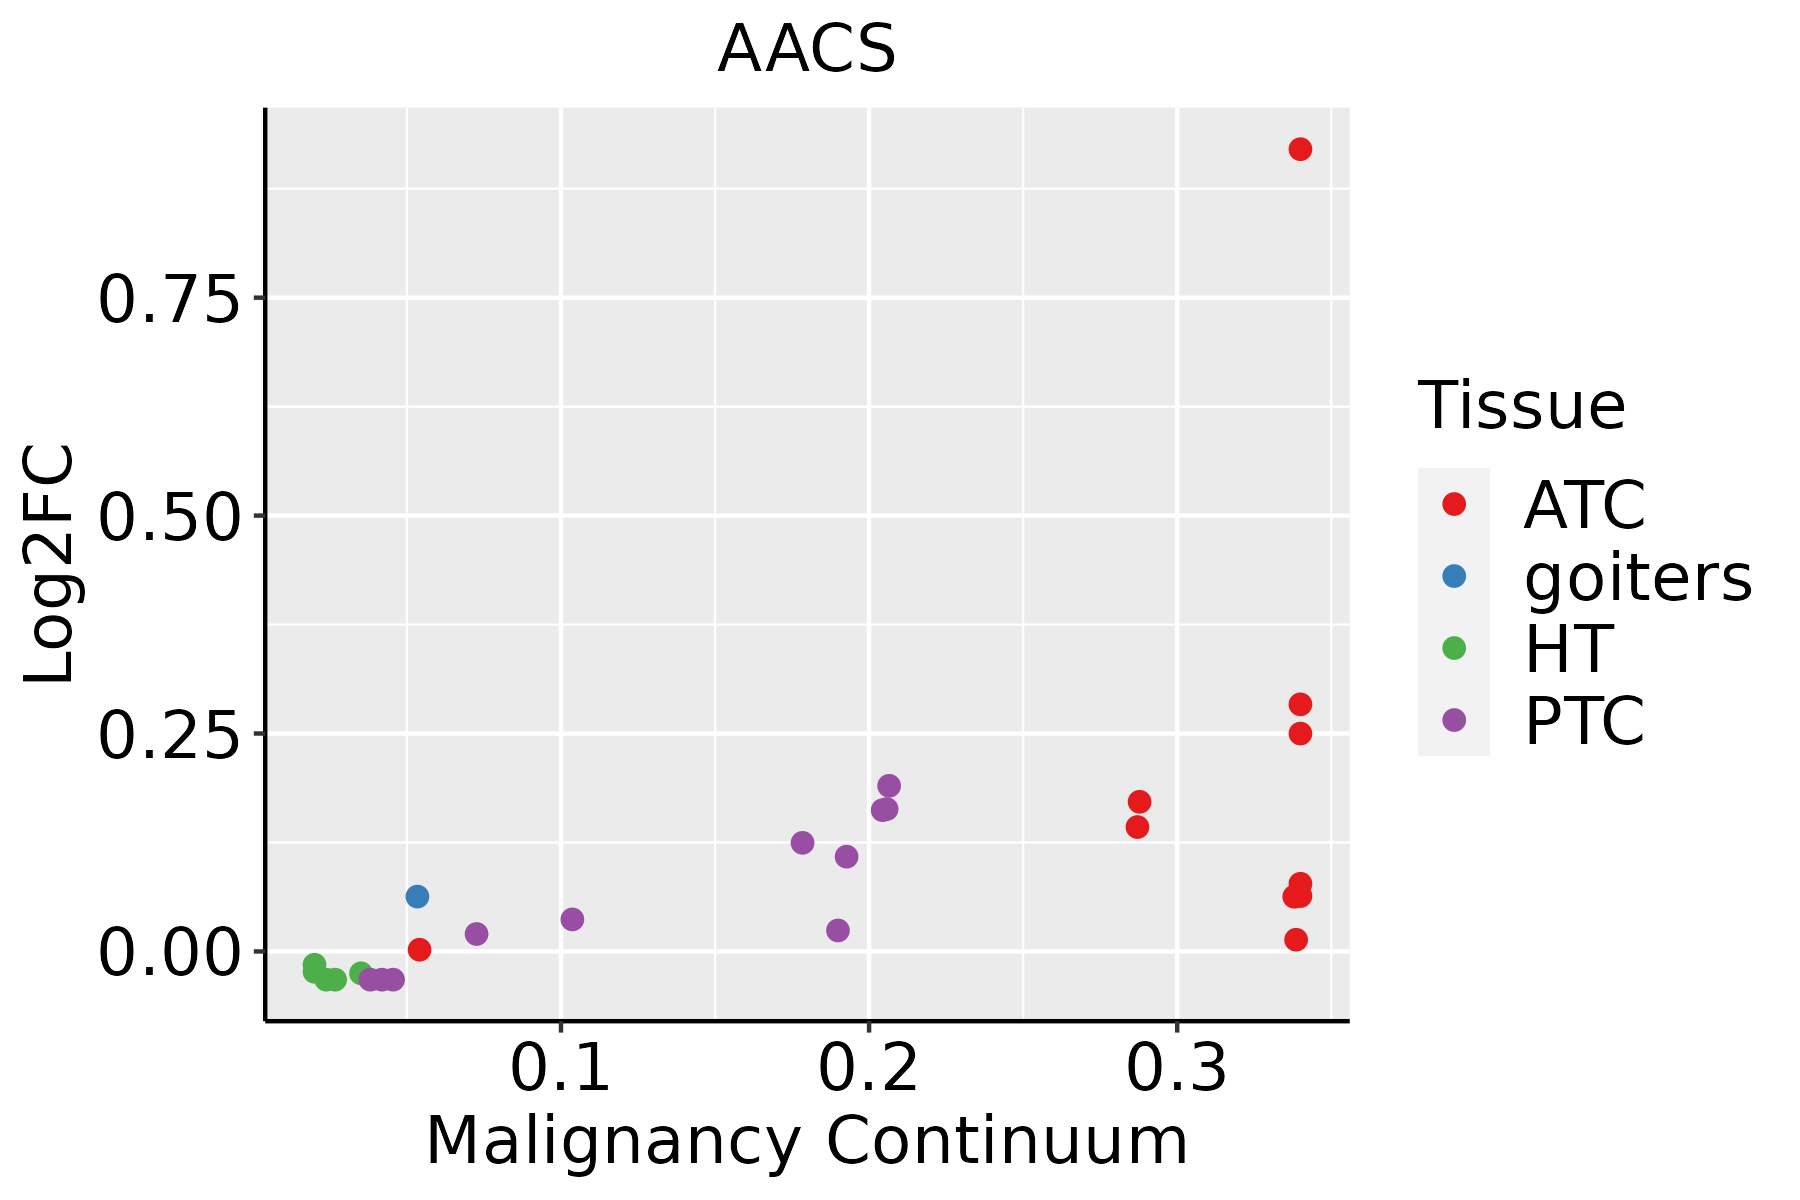 | ATC: Anaplastic thyroid cancer |
| HT: Hashimoto's thyroiditis | ||
| PTC: Papillary thyroid cancer |
| ∗log2FC in expression of this searched gene in stem-like cells from each diseased tissue sample relative to stem-like cells in normal samples in each tissue plotted against the malignancy continuum. Samples are colored based on if they are from different disease stage. |
Top |
Malignant transformation related pathway analysis |
| Find out the enriched GO biological processes and KEGG pathways involved in transition from healthy to precancer to cancer |
| Tissue | Disease Stage | Enriched GO biological Processes |
| Colorectum | AD |  |
| Colorectum | SER |  |
| Colorectum | MSS |  |
| Colorectum | MSI-H |  |
| Colorectum | FAP |  |
| ∗Top 15 enriched GO BP terms are showed in the bar plot of each disease state in each tissue. Each row represents a significant GO biological process which is colored according to the -log10(p.adjust). |
| Page: 1 2 3 4 5 6 7 8 9 |
| GO ID | Tissue | Disease Stage | Description | Gene Ratio | Bg Ratio | pvalue | p.adjust | Count |
| GO:00705427 | Oral cavity | OSCC | response to fatty acid | 36/7305 | 64/18723 | 3.82e-03 | 1.57e-02 | 36 |
| GO:00507089 | Oral cavity | OSCC | regulation of protein secretion | 126/7305 | 268/18723 | 4.41e-03 | 1.79e-02 | 126 |
| GO:0006091112 | Thyroid | PTC | generation of precursor metabolites and energy | 252/5968 | 490/18723 | 8.24e-20 | 1.13e-17 | 252 |
| GO:1904951113 | Thyroid | PTC | positive regulation of establishment of protein localization | 175/5968 | 319/18723 | 1.10e-17 | 1.12e-15 | 175 |
| GO:0051222113 | Thyroid | PTC | positive regulation of protein transport | 163/5968 | 303/18723 | 1.58e-15 | 1.16e-13 | 163 |
| GO:0048732113 | Thyroid | PTC | gland development | 193/5968 | 436/18723 | 2.88e-08 | 6.42e-07 | 193 |
| GO:0001889112 | Thyroid | PTC | liver development | 79/5968 | 147/18723 | 3.08e-08 | 6.82e-07 | 79 |
| GO:0061008112 | Thyroid | PTC | hepaticobiliary system development | 80/5968 | 150/18723 | 3.94e-08 | 8.55e-07 | 80 |
| GO:0042594111 | Thyroid | PTC | response to starvation | 98/5968 | 197/18723 | 1.24e-07 | 2.41e-06 | 98 |
| GO:0031667113 | Thyroid | PTC | response to nutrient levels | 201/5968 | 474/18723 | 7.00e-07 | 1.10e-05 | 201 |
| GO:1901654113 | Thyroid | PTC | response to ketone | 90/5968 | 194/18723 | 1.56e-05 | 1.65e-04 | 90 |
| GO:004544418 | Thyroid | PTC | fat cell differentiation | 102/5968 | 229/18723 | 3.66e-05 | 3.40e-04 | 102 |
| GO:0009743113 | Thyroid | PTC | response to carbohydrate | 111/5968 | 253/18723 | 3.77e-05 | 3.48e-04 | 111 |
| GO:0034284112 | Thyroid | PTC | response to monosaccharide | 99/5968 | 225/18723 | 8.42e-05 | 7.03e-04 | 99 |
| GO:0097305113 | Thyroid | PTC | response to alcohol | 107/5968 | 253/18723 | 2.92e-04 | 2.07e-03 | 107 |
| GO:0009746112 | Thyroid | PTC | response to hexose | 94/5968 | 219/18723 | 3.62e-04 | 2.45e-03 | 94 |
| GO:0009749111 | Thyroid | PTC | response to glucose | 91/5968 | 212/18723 | 4.44e-04 | 2.95e-03 | 91 |
| GO:003357410 | Thyroid | PTC | response to testosterone | 23/5968 | 42/18723 | 1.77e-03 | 9.59e-03 | 23 |
| GO:0001678110 | Thyroid | PTC | cellular glucose homeostasis | 72/5968 | 172/18723 | 3.58e-03 | 1.73e-02 | 72 |
| GO:0033500110 | Thyroid | PTC | carbohydrate homeostasis | 103/5968 | 259/18723 | 4.19e-03 | 1.99e-02 | 103 |
| Page: 1 2 3 4 5 6 7 8 9 10 |
| Pathway ID | Tissue | Disease Stage | Description | Gene Ratio | Bg Ratio | pvalue | p.adjust | qvalue | Count |
| hsa002809 | Esophagus | ESCC | Valine, leucine and isoleucine degradation | 34/4205 | 48/8465 | 2.34e-03 | 6.54e-03 | 3.35e-03 | 34 |
| hsa0028014 | Esophagus | ESCC | Valine, leucine and isoleucine degradation | 34/4205 | 48/8465 | 2.34e-03 | 6.54e-03 | 3.35e-03 | 34 |
| hsa0028021 | Liver | Cirrhotic | Valine, leucine and isoleucine degradation | 32/2530 | 48/8465 | 1.45e-07 | 2.02e-06 | 1.24e-06 | 32 |
| hsa006502 | Liver | Cirrhotic | Butanoate metabolism | 15/2530 | 27/8465 | 4.71e-03 | 1.74e-02 | 1.07e-02 | 15 |
| hsa0028031 | Liver | Cirrhotic | Valine, leucine and isoleucine degradation | 32/2530 | 48/8465 | 1.45e-07 | 2.02e-06 | 1.24e-06 | 32 |
| hsa006503 | Liver | Cirrhotic | Butanoate metabolism | 15/2530 | 27/8465 | 4.71e-03 | 1.74e-02 | 1.07e-02 | 15 |
| hsa0028041 | Liver | HCC | Valine, leucine and isoleucine degradation | 41/4020 | 48/8465 | 4.84e-08 | 7.05e-07 | 3.92e-07 | 41 |
| hsa0028051 | Liver | HCC | Valine, leucine and isoleucine degradation | 41/4020 | 48/8465 | 4.84e-08 | 7.05e-07 | 3.92e-07 | 41 |
| Page: 1 |
Top |
Cell-cell communication analysis |
| Identification of potential cell-cell interactions between two cell types and their ligand-receptor pairs for different disease states |
| Ligand | Receptor | LRpair | Pathway | Tissue | Disease Stage |
| Page: 1 |
Top |
Single-cell gene regulatory network inference analysis |
| Find out the significant the regulons (TFs) and the target genes of each regulon across cell types for different disease states |
| TF | Cell Type | Tissue | Disease Stage | Target Gene | RSS | Regulon Activity |
| ∗The dot plots of a searched regulon are shown for all cell subpopulations in each disease state of each tissue based on the regulon specific score inferred using pySCENIC and by calculating the average expression. |
| Page: 1 |
Top |
Somatic mutation of malignant transformation related genes |
| Annotation of somatic variants for genes involved in malignant transformation |
| Hugo Symbol | Variant Class | Variant Classification | dbSNP RS | HGVSc | HGVSp | HGVSp Short | SWISSPROT | BIOTYPE | SIFT | PolyPhen | Tumor Sample Barcode | Tissue | Histology | Sex | Age | Stage | Therapy Types | Drugs | Outcome |
| AACS | SNV | Missense_Mutation | rs764827940 | c.592C>G | p.Gln198Glu | p.Q198E | Q86V21 | protein_coding | deleterious(0) | probably_damaging(0.999) | TCGA-5L-AAT1-01 | Breast | breast invasive carcinoma | Female | <65 | III/IV | Hormone Therapy | letrozol | SD |
| AACS | SNV | Missense_Mutation | c.324N>G | p.His108Gln | p.H108Q | Q86V21 | protein_coding | deleterious(0.03) | possibly_damaging(0.582) | TCGA-AO-A0J5-01 | Breast | breast invasive carcinoma | Female | <65 | III/IV | Other, specify in notesBisphosphonate | zoledronic | PD | |
| AACS | SNV | Missense_Mutation | novel | c.1025T>G | p.Val342Gly | p.V342G | Q86V21 | protein_coding | deleterious(0.01) | probably_damaging(0.966) | TCGA-C8-A273-01 | Breast | breast invasive carcinoma | Female | <65 | I/II | Hormone Therapy | tamoxiphen | SD |
| AACS | insertion | Frame_Shift_Ins | novel | c.748_749insCTGGAGTGCAATGGCACGA | p.Leu250ProfsTer18 | p.L250Pfs*18 | Q86V21 | protein_coding | TCGA-BH-A0E7-01 | Breast | breast invasive carcinoma | Female | >=65 | I/II | Hormone Therapy | arimidex | SD | ||
| AACS | SNV | Missense_Mutation | novel | c.464N>A | p.Arg155Gln | p.R155Q | Q86V21 | protein_coding | deleterious(0) | probably_damaging(0.98) | TCGA-2W-A8YY-01 | Cervix | cervical & endocervical cancer | Female | <65 | I/II | Chemotherapy | cisplatin | CR |
| AACS | SNV | Missense_Mutation | c.1070C>G | p.Ser357Cys | p.S357C | Q86V21 | protein_coding | deleterious(0) | possibly_damaging(0.774) | TCGA-C5-A3HE-01 | Cervix | cervical & endocervical cancer | Female | <65 | I/II | Unknown | Unknown | PD | |
| AACS | SNV | Missense_Mutation | rs552206706 | c.1384C>T | p.Arg462Trp | p.R462W | Q86V21 | protein_coding | deleterious(0) | benign(0.234) | TCGA-VS-A94Z-01 | Cervix | cervical & endocervical cancer | Female | <65 | I/II | Chemotherapy | cisplatin | CR |
| AACS | SNV | Missense_Mutation | novel | c.515N>G | p.Ala172Gly | p.A172G | Q86V21 | protein_coding | deleterious(0.02) | benign(0.255) | TCGA-VS-A9UC-01 | Cervix | cervical & endocervical cancer | Female | <65 | I/II | Chemotherapy | cisplatin | SD |
| AACS | SNV | Missense_Mutation | c.192N>T | p.Glu64Asp | p.E64D | Q86V21 | protein_coding | tolerated(0.26) | benign(0.046) | TCGA-AA-3977-01 | Colorectum | colon adenocarcinoma | Male | >=65 | I/II | Unknown | Unknown | SD | |
| AACS | SNV | Missense_Mutation | novel | c.179N>G | p.Asp60Gly | p.D60G | Q86V21 | protein_coding | tolerated(0.1) | possibly_damaging(0.816) | TCGA-AA-3984-01 | Colorectum | colon adenocarcinoma | Female | <65 | I/II | Unknown | Unknown | SD |
| Page: 1 2 3 4 5 6 7 8 |
Top |
Related drugs of malignant transformation related genes |
| Identification of chemicals and drugs interact with genes involved in malignant transfromation |
| (DGIdb 4.0) |
| Entrez ID | Symbol | Category | Interaction Types | Drug Claim Name | Drug Name | PMIDs |
| Page: 1 |

Copyright 2023-Present -The University of Texas Health Science Center at Houston |