
|
|||||
|
 | |
| |
| |
| |
| |
| |
|
Gene: SFRP1 |
Gene summary for SFRP1 |
| Gene information | Species | Human | Gene symbol | SFRP1 | Gene ID | 6422 |
| Gene name | secreted frizzled related protein 1 | |
| Gene Alias | FRP | |
| Cytomap | 8p11.21 | |
| Gene Type | protein-coding | GO ID | GO:0000003 | UniProtAcc | Q8N474 |
Top |
Malignant transformation analysis |
| Identification of the aberrant gene expression in precancerous and cancerous lesions by comparing the gene expression of stem-like cells in diseased tissues with normal stem cells |
| Entrez ID | Symbol | Replicates | Species | Organ | Tissue | Adj P-value | Log2FC | Malignancy |
| 6422 | SFRP1 | GSM4909281 | Human | Breast | IDC | 3.65e-14 | -5.99e-01 | 0.21 |
| 6422 | SFRP1 | GSM4909282 | Human | Breast | IDC | 3.92e-06 | 3.22e-01 | -0.0288 |
| 6422 | SFRP1 | GSM4909285 | Human | Breast | IDC | 1.08e-22 | -6.60e-01 | 0.21 |
| 6422 | SFRP1 | GSM4909286 | Human | Breast | IDC | 4.48e-10 | -2.24e-01 | 0.1081 |
| 6422 | SFRP1 | GSM4909290 | Human | Breast | IDC | 5.68e-41 | -1.06e+00 | 0.2096 |
| 6422 | SFRP1 | GSM4909291 | Human | Breast | IDC | 2.53e-34 | -1.06e+00 | 0.1753 |
| 6422 | SFRP1 | GSM4909292 | Human | Breast | IDC | 4.95e-06 | -1.03e+00 | 0.1236 |
| 6422 | SFRP1 | GSM4909293 | Human | Breast | IDC | 1.98e-30 | -7.28e-01 | 0.1581 |
| 6422 | SFRP1 | GSM4909294 | Human | Breast | IDC | 3.65e-51 | -9.71e-01 | 0.2022 |
| 6422 | SFRP1 | GSM4909296 | Human | Breast | IDC | 1.65e-49 | -1.03e+00 | 0.1524 |
| 6422 | SFRP1 | GSM4909297 | Human | Breast | IDC | 9.17e-45 | -9.94e-01 | 0.1517 |
| 6422 | SFRP1 | GSM4909298 | Human | Breast | IDC | 9.89e-35 | -8.24e-01 | 0.1551 |
| 6422 | SFRP1 | GSM4909299 | Human | Breast | IDC | 1.75e-08 | 4.47e-01 | 0.035 |
| 6422 | SFRP1 | GSM4909301 | Human | Breast | IDC | 7.38e-56 | -1.05e+00 | 0.1577 |
| 6422 | SFRP1 | GSM4909302 | Human | Breast | IDC | 8.32e-40 | -9.56e-01 | 0.1545 |
| 6422 | SFRP1 | GSM4909304 | Human | Breast | IDC | 3.77e-60 | -1.06e+00 | 0.1636 |
| 6422 | SFRP1 | GSM4909306 | Human | Breast | IDC | 2.55e-24 | -6.21e-01 | 0.1564 |
| 6422 | SFRP1 | GSM4909307 | Human | Breast | IDC | 1.33e-20 | -6.60e-01 | 0.1569 |
| 6422 | SFRP1 | GSM4909308 | Human | Breast | IDC | 1.95e-46 | -1.06e+00 | 0.158 |
| 6422 | SFRP1 | GSM4909311 | Human | Breast | IDC | 7.18e-39 | -8.75e-01 | 0.1534 |
| Page: 1 2 3 4 5 6 7 |
| Tissue | Expression Dynamics | Abbreviation |
| Breast | 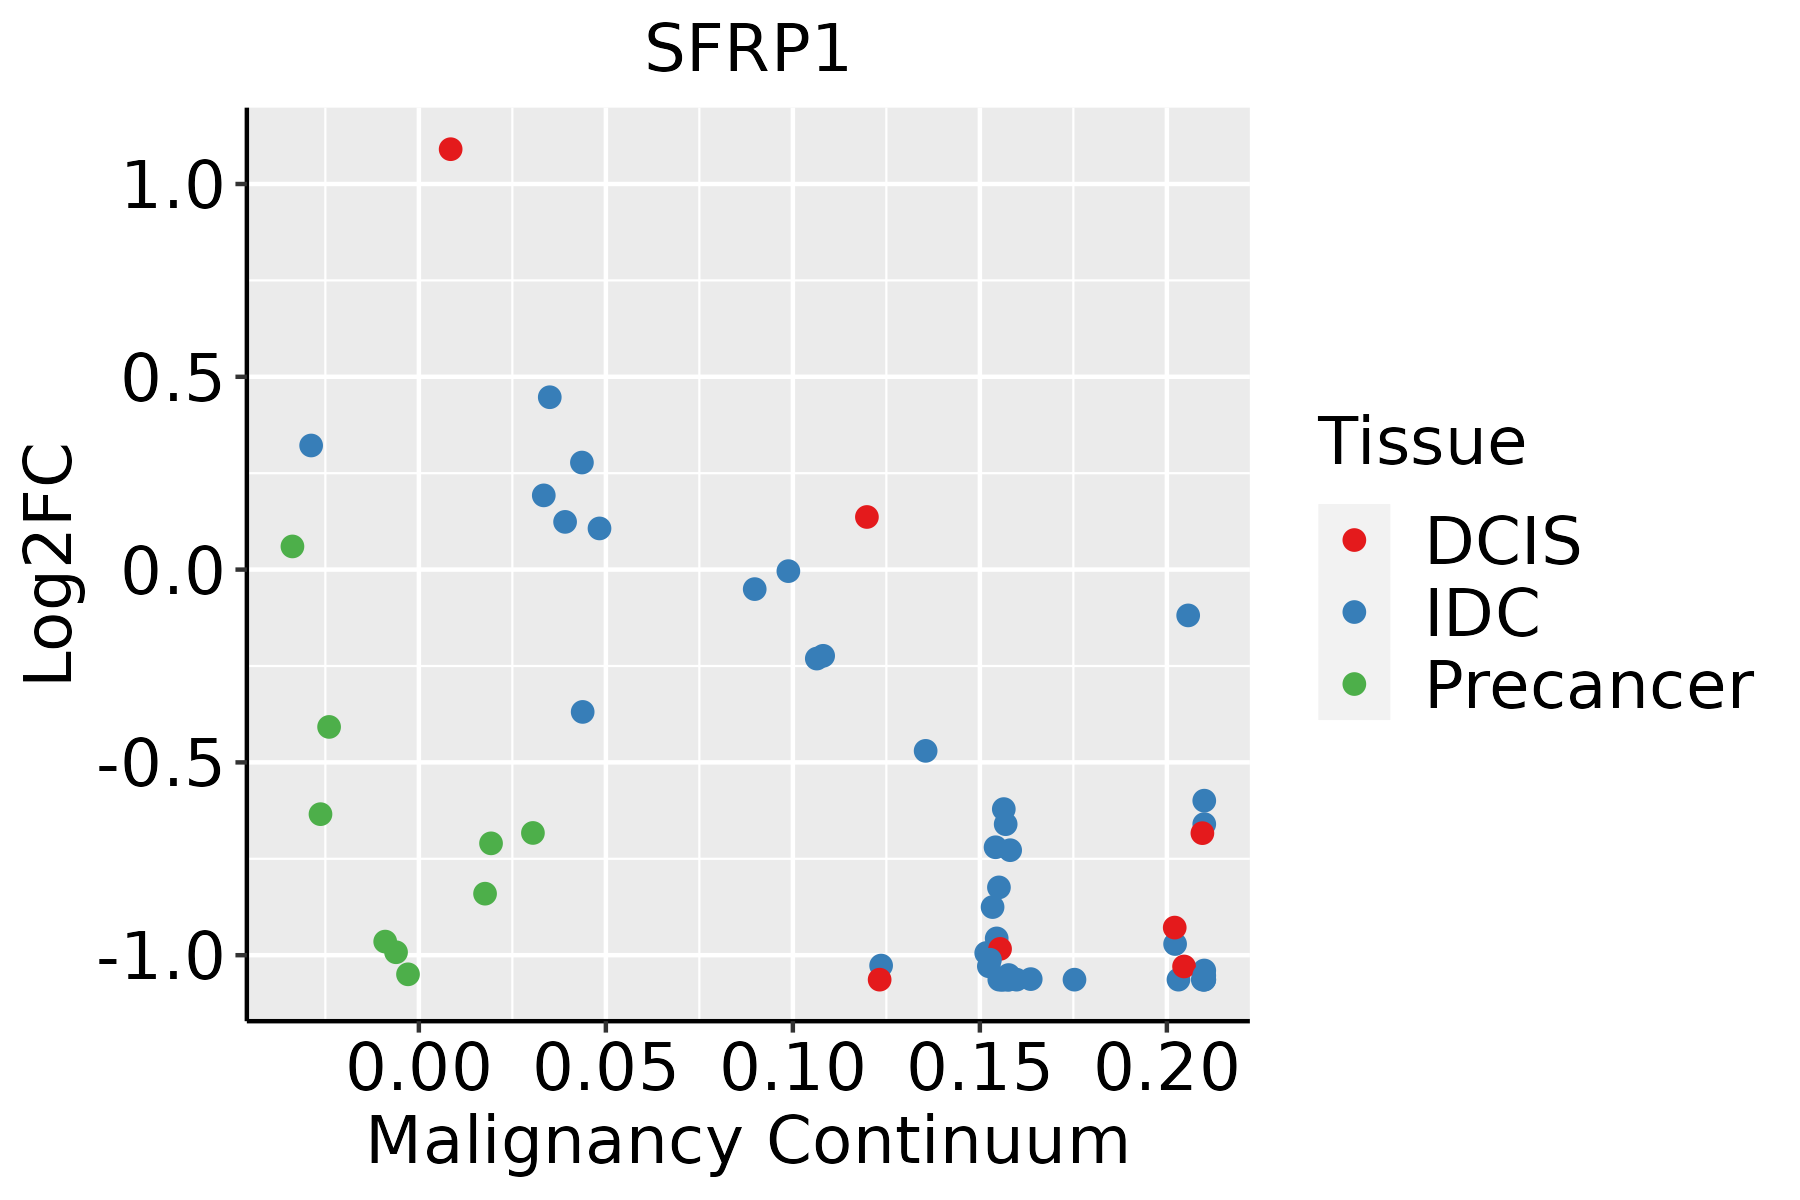 | IDC: Invasive ductal carcinoma |
| DCIS: Ductal carcinoma in situ | ||
| Precancer(BRCA1-mut): Precancerous lesion from BRCA1 mutation carriers | ||
| Endometrium |  | AEH: Atypical endometrial hyperplasia |
| EEC: Endometrioid Cancer | ||
| Esophagus | 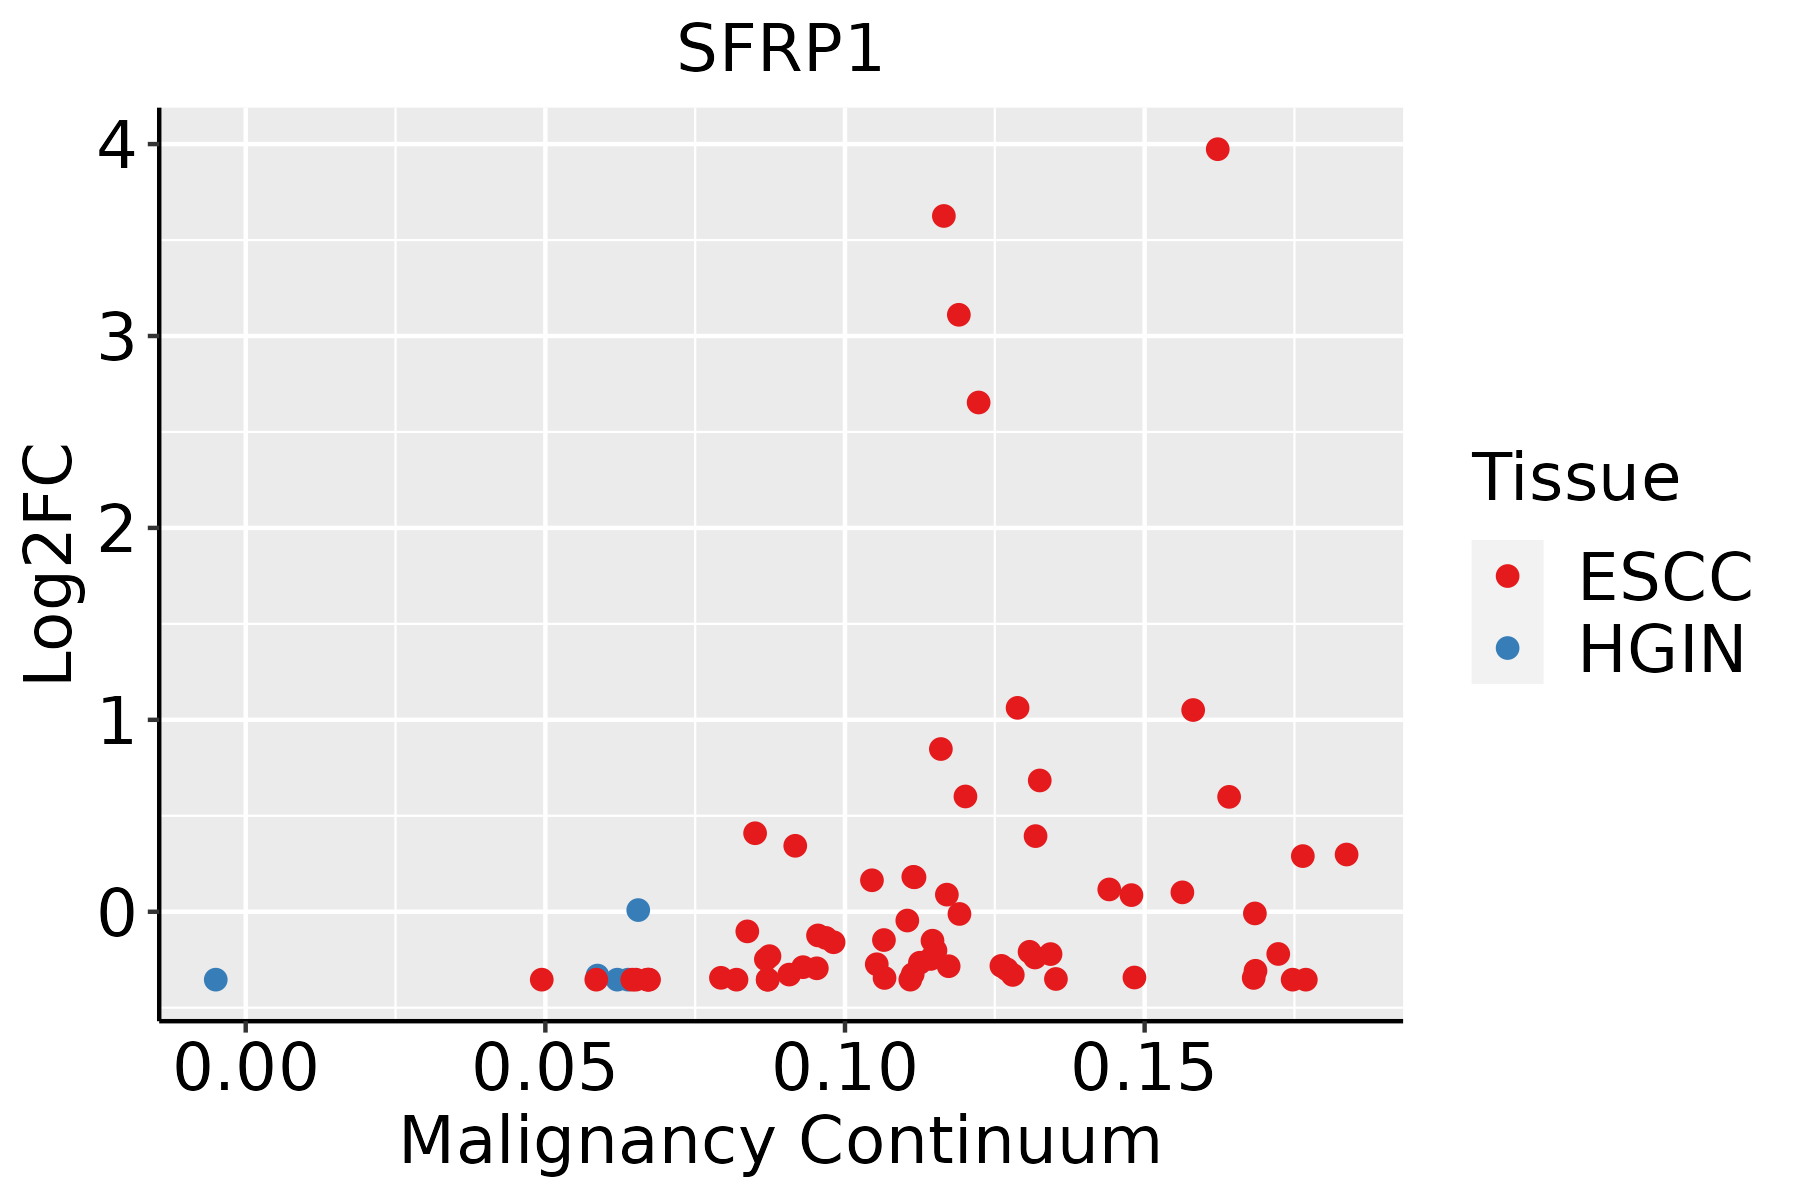 | ESCC: Esophageal squamous cell carcinoma |
| HGIN: High-grade intraepithelial neoplasias | ||
| LGIN: Low-grade intraepithelial neoplasias | ||
| Oral Cavity | 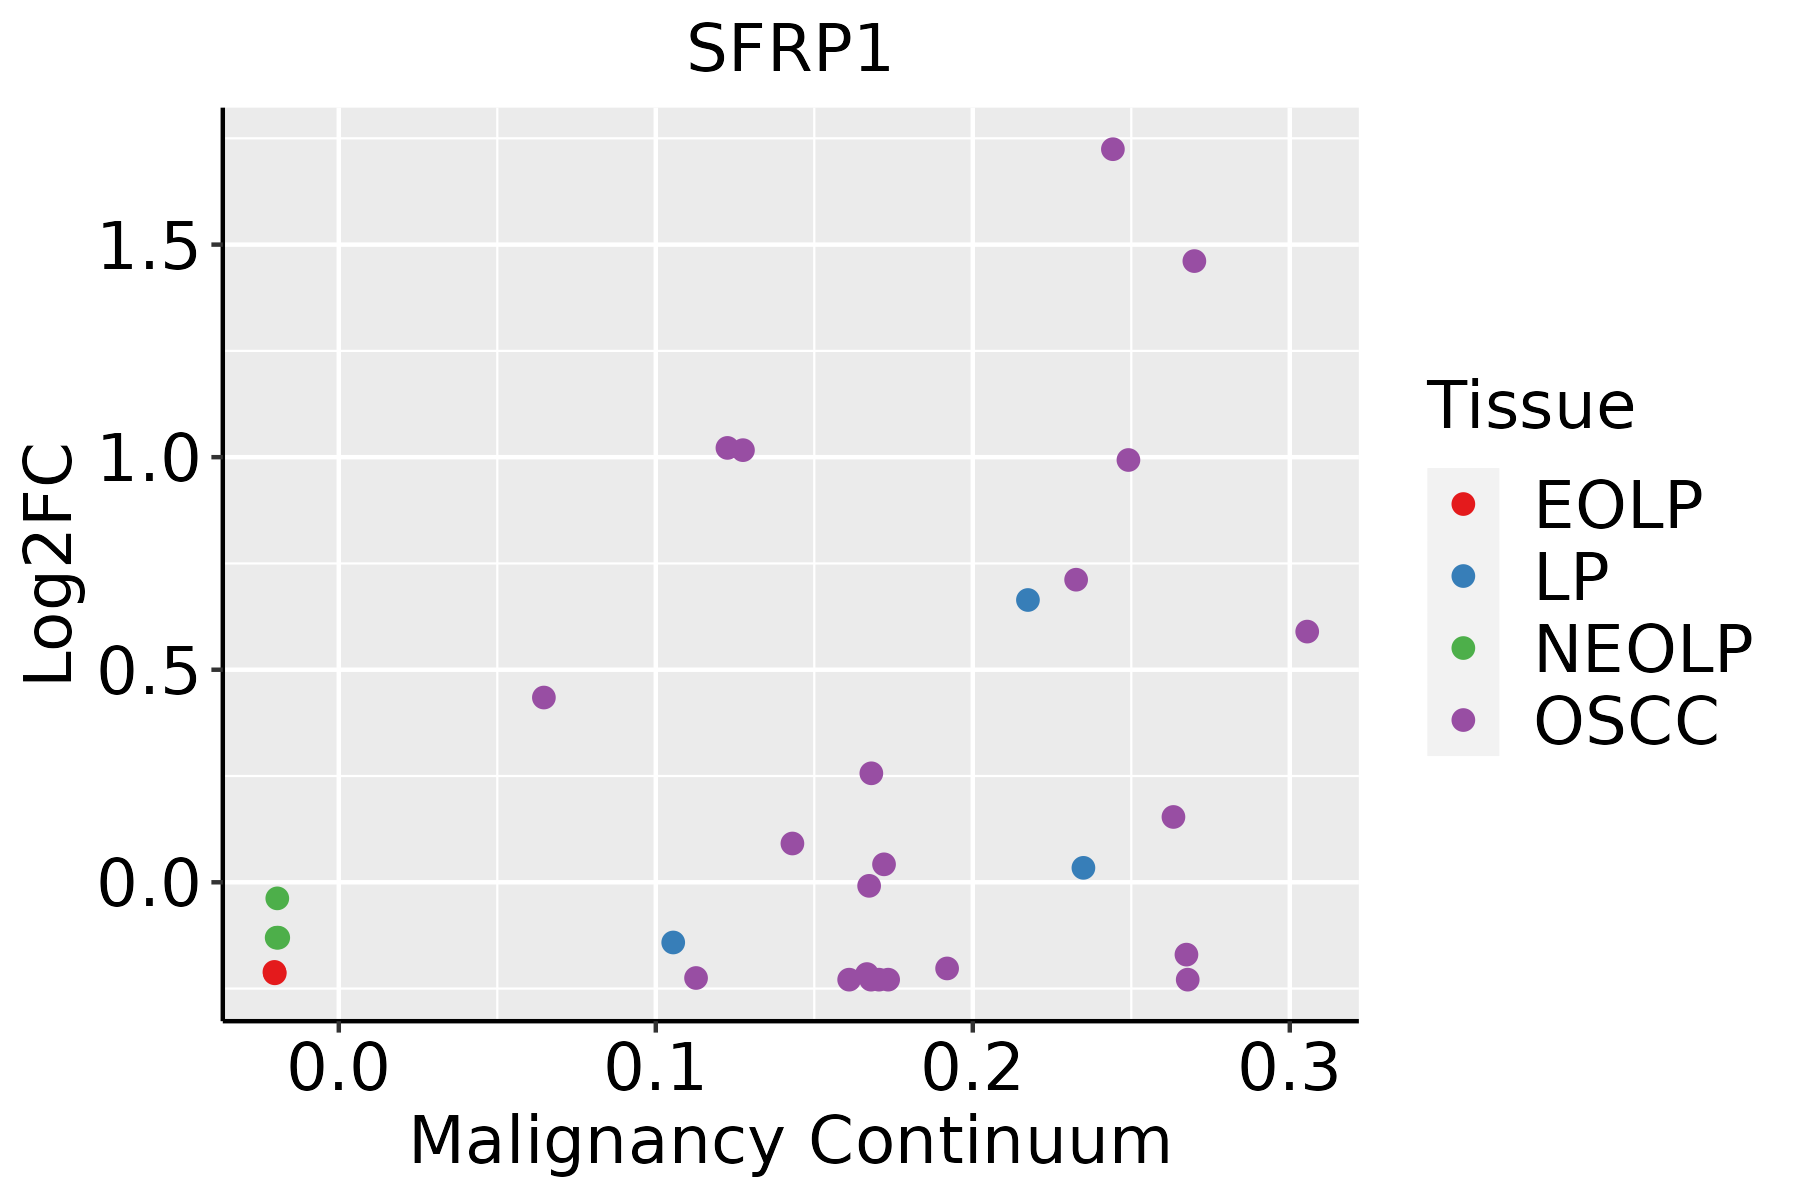 | EOLP: Erosive Oral lichen planus |
| LP: leukoplakia | ||
| NEOLP: Non-erosive oral lichen planus | ||
| OSCC: Oral squamous cell carcinoma | ||
| Prostate | 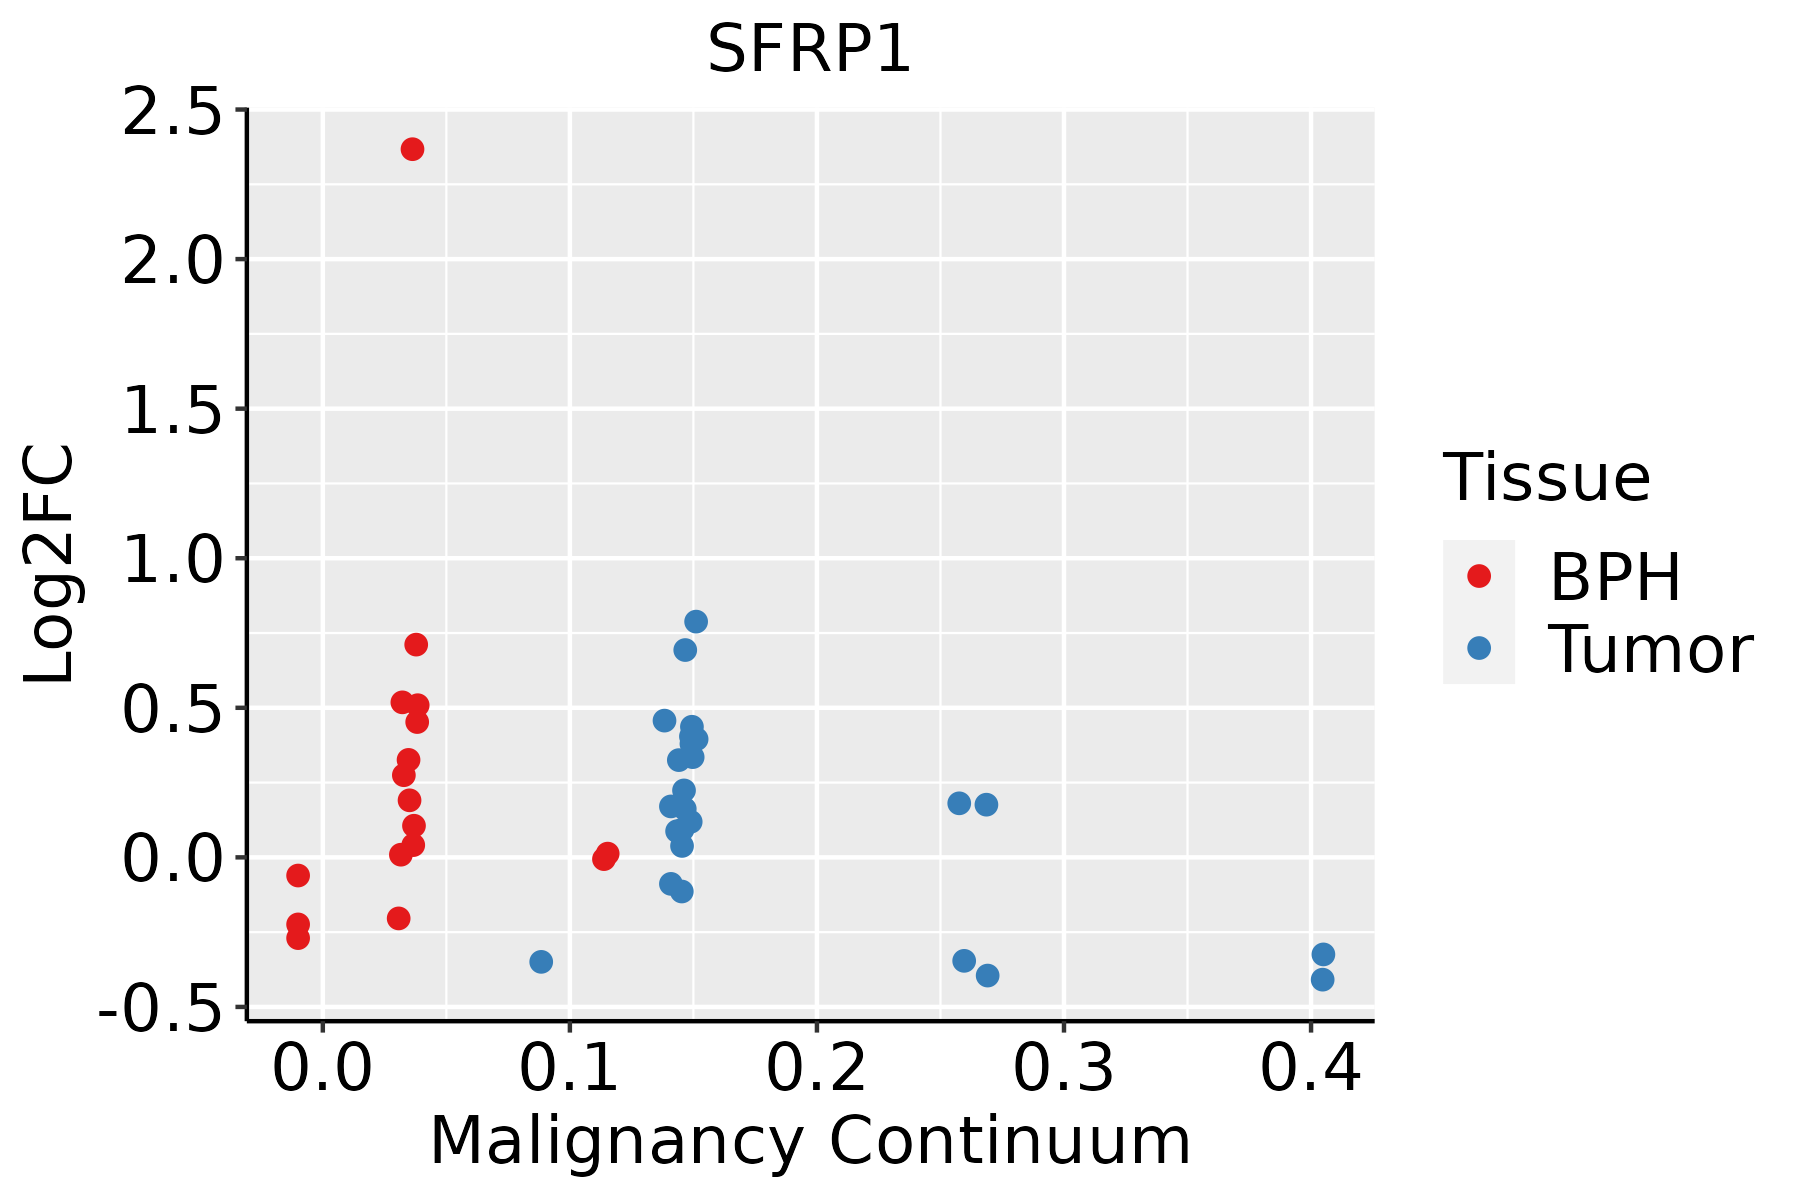 | BPH: Benign Prostatic Hyperplasia |
| Skin |  | AK: Actinic keratosis |
| cSCC: Cutaneous squamous cell carcinoma | ||
| SCCIS:squamous cell carcinoma in situ | ||
| Thyroid | 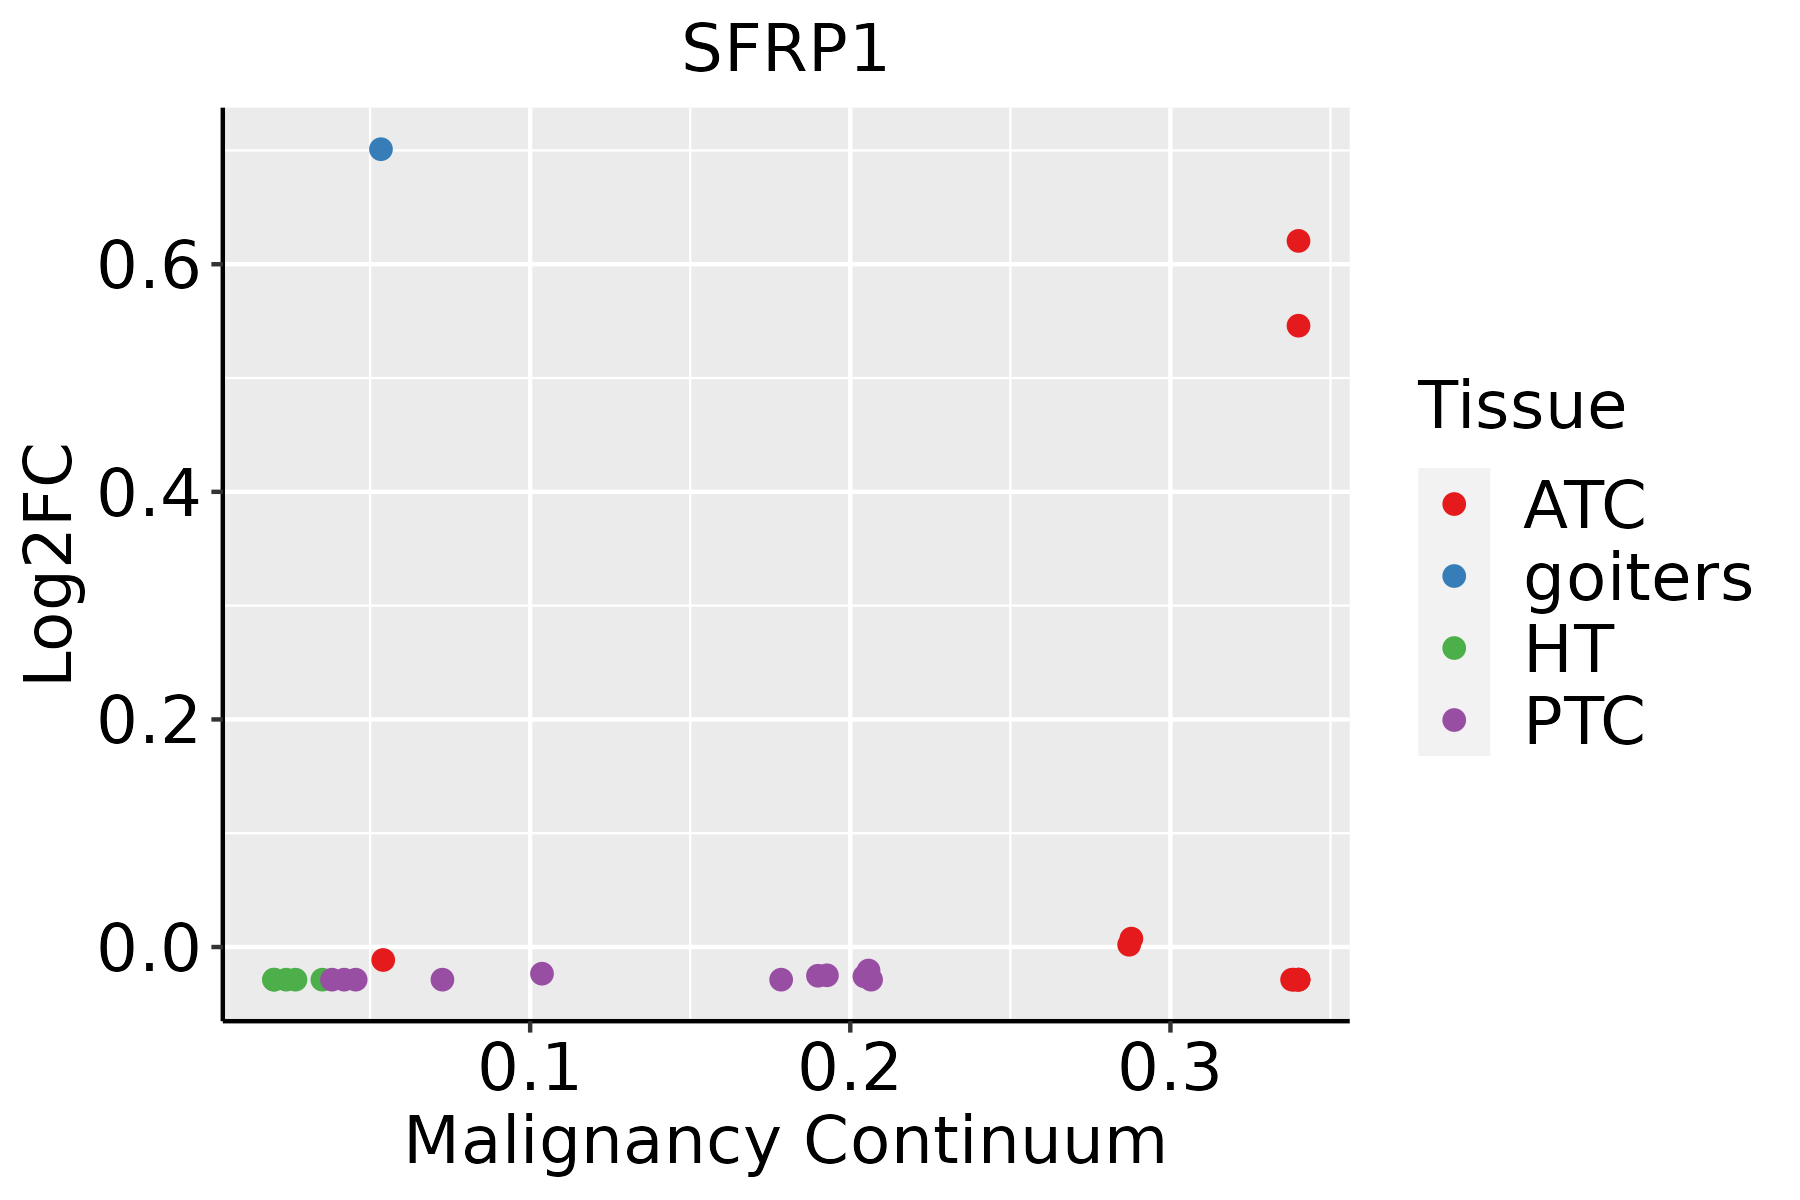 | ATC: Anaplastic thyroid cancer |
| HT: Hashimoto's thyroiditis | ||
| PTC: Papillary thyroid cancer |
| ∗log2FC in expression of this searched gene in stem-like cells from each diseased tissue sample relative to stem-like cells in normal samples in each tissue plotted against the malignancy continuum. Samples are colored based on if they are from different disease stage. |
Top |
Malignant transformation related pathway analysis |
| Find out the enriched GO biological processes and KEGG pathways involved in transition from healthy to precancer to cancer |
| Tissue | Disease Stage | Enriched GO biological Processes |
| Colorectum | AD |  |
| Colorectum | SER |  |
| Colorectum | MSS |  |
| Colorectum | MSI-H |  |
| Colorectum | FAP |  |
| ∗Top 15 enriched GO BP terms are showed in the bar plot of each disease state in each tissue. Each row represents a significant GO biological process which is colored according to the -log10(p.adjust). |
| Page: 1 2 3 4 5 6 7 8 9 |
| GO ID | Tissue | Disease Stage | Description | Gene Ratio | Bg Ratio | pvalue | p.adjust | Count |
| GO:00720737 | Prostate | BPH | kidney epithelium development | 42/3107 | 136/18723 | 2.62e-05 | 3.10e-04 | 42 |
| GO:00025739 | Prostate | BPH | myeloid leukocyte differentiation | 58/3107 | 208/18723 | 2.76e-05 | 3.24e-04 | 58 |
| GO:00331436 | Prostate | BPH | regulation of intracellular steroid hormone receptor signaling pathway | 27/3107 | 74/18723 | 2.87e-05 | 3.33e-04 | 27 |
| GO:000862514 | Prostate | BPH | extrinsic apoptotic signaling pathway via death domain receptors | 29/3107 | 82/18723 | 2.92e-05 | 3.34e-04 | 29 |
| GO:00400135 | Prostate | BPH | negative regulation of locomotion | 96/3107 | 391/18723 | 3.11e-05 | 3.54e-04 | 96 |
| GO:00303365 | Prostate | BPH | negative regulation of cell migration | 86/3107 | 344/18723 | 3.93e-05 | 4.25e-04 | 86 |
| GO:00328729 | Prostate | BPH | regulation of stress-activated MAPK cascade | 54/3107 | 192/18723 | 3.97e-05 | 4.28e-04 | 54 |
| GO:00308504 | Prostate | BPH | prostate gland development | 19/3107 | 45/18723 | 4.29e-05 | 4.56e-04 | 19 |
| GO:00331447 | Prostate | BPH | negative regulation of intracellular steroid hormone receptor signaling pathway | 17/3107 | 38/18723 | 4.42e-05 | 4.67e-04 | 17 |
| GO:19016554 | Prostate | BPH | cellular response to ketone | 32/3107 | 96/18723 | 4.48e-05 | 4.73e-04 | 32 |
| GO:004340915 | Prostate | BPH | negative regulation of MAPK cascade | 51/3107 | 180/18723 | 5.20e-05 | 5.35e-04 | 51 |
| GO:00097559 | Prostate | BPH | hormone-mediated signaling pathway | 53/3107 | 190/18723 | 5.92e-05 | 5.97e-04 | 53 |
| GO:00703029 | Prostate | BPH | regulation of stress-activated protein kinase signaling cascade | 54/3107 | 195/18723 | 6.28e-05 | 6.28e-04 | 54 |
| GO:00085844 | Prostate | BPH | male gonad development | 42/3107 | 141/18723 | 6.69e-05 | 6.62e-04 | 42 |
| GO:0050680 | Prostate | BPH | negative regulation of epithelial cell proliferation | 47/3107 | 164/18723 | 7.39e-05 | 7.22e-04 | 47 |
| GO:00465464 | Prostate | BPH | development of primary male sexual characteristics | 42/3107 | 142/18723 | 8.00e-05 | 7.66e-04 | 42 |
| GO:00720016 | Prostate | BPH | renal system development | 76/3107 | 302/18723 | 8.55e-05 | 8.09e-04 | 76 |
| GO:00466614 | Prostate | BPH | male sex differentiation | 47/3107 | 165/18723 | 8.70e-05 | 8.22e-04 | 47 |
| GO:00018225 | Prostate | BPH | kidney development | 74/3107 | 293/18723 | 9.31e-05 | 8.76e-04 | 74 |
| GO:01501176 | Prostate | BPH | positive regulation of cell-substrate junction organization | 15/3107 | 33/18723 | 9.91e-05 | 9.20e-04 | 15 |
| Page: 1 2 3 4 5 6 7 8 9 10 11 12 13 14 15 16 17 18 19 20 21 22 23 24 25 26 27 28 29 30 31 32 33 34 35 36 37 38 39 40 41 42 43 44 45 46 47 48 49 50 51 52 53 54 55 56 57 58 59 60 61 62 63 64 65 66 67 68 69 70 71 72 73 74 75 76 77 78 79 80 81 82 83 84 85 86 87 88 89 90 91 92 93 94 95 96 97 98 99 100 101 102 103 104 105 106 107 108 109 110 111 112 113 114 115 116 117 118 119 120 121 122 |
| Pathway ID | Tissue | Disease Stage | Description | Gene Ratio | Bg Ratio | pvalue | p.adjust | qvalue | Count |
| hsa0431010 | Endometrium | AEH | Wnt signaling pathway | 37/1197 | 171/8465 | 4.68e-03 | 2.53e-02 | 1.86e-02 | 37 |
| hsa0431013 | Endometrium | AEH | Wnt signaling pathway | 37/1197 | 171/8465 | 4.68e-03 | 2.53e-02 | 1.86e-02 | 37 |
| hsa0431022 | Endometrium | EEC | Wnt signaling pathway | 40/1237 | 171/8465 | 1.37e-03 | 8.99e-03 | 6.70e-03 | 40 |
| hsa0431032 | Endometrium | EEC | Wnt signaling pathway | 40/1237 | 171/8465 | 1.37e-03 | 8.99e-03 | 6.70e-03 | 40 |
| hsa0431016 | Oral cavity | EOLP | Wnt signaling pathway | 37/1218 | 171/8465 | 6.23e-03 | 1.83e-02 | 1.08e-02 | 37 |
| hsa0431017 | Oral cavity | EOLP | Wnt signaling pathway | 37/1218 | 171/8465 | 6.23e-03 | 1.83e-02 | 1.08e-02 | 37 |
| hsa0431014 | Prostate | BPH | Wnt signaling pathway | 50/1718 | 171/8465 | 3.11e-03 | 1.15e-02 | 7.14e-03 | 50 |
| hsa0431015 | Prostate | BPH | Wnt signaling pathway | 50/1718 | 171/8465 | 3.11e-03 | 1.15e-02 | 7.14e-03 | 50 |
| hsa0431023 | Prostate | Tumor | Wnt signaling pathway | 50/1791 | 171/8465 | 7.32e-03 | 2.37e-02 | 1.47e-02 | 50 |
| hsa0431033 | Prostate | Tumor | Wnt signaling pathway | 50/1791 | 171/8465 | 7.32e-03 | 2.37e-02 | 1.47e-02 | 50 |
| Page: 1 |
Top |
Cell-cell communication analysis |
| Identification of potential cell-cell interactions between two cell types and their ligand-receptor pairs for different disease states |
| Ligand | Receptor | LRpair | Pathway | Tissue | Disease Stage |
| Page: 1 |
Top |
Single-cell gene regulatory network inference analysis |
| Find out the significant the regulons (TFs) and the target genes of each regulon across cell types for different disease states |
| TF | Cell Type | Tissue | Disease Stage | Target Gene | RSS | Regulon Activity |
| ∗The dot plots of a searched regulon are shown for all cell subpopulations in each disease state of each tissue based on the regulon specific score inferred using pySCENIC and by calculating the average expression. |
| Page: 1 |
Top |
Somatic mutation of malignant transformation related genes |
| Annotation of somatic variants for genes involved in malignant transformation |
| Hugo Symbol | Variant Class | Variant Classification | dbSNP RS | HGVSc | HGVSp | HGVSp Short | SWISSPROT | BIOTYPE | SIFT | PolyPhen | Tumor Sample Barcode | Tissue | Histology | Sex | Age | Stage | Therapy Types | Drugs | Outcome |
| SFRP1 | SNV | Missense_Mutation | rs765603358 | c.934G>A | p.Val312Met | p.V312M | Q8N474 | protein_coding | deleterious(0.02) | possibly_damaging(0.721) | TCGA-A7-A4SD-01 | Breast | breast invasive carcinoma | Female | <65 | I/II | Chemotherapy | taxotere | CR |
| SFRP1 | SNV | Missense_Mutation | c.262G>A | p.Ala88Thr | p.A88T | Q8N474 | protein_coding | tolerated(0.17) | benign(0.062) | TCGA-AR-A0TT-01 | Breast | breast invasive carcinoma | Female | <65 | III/IV | Chemotherapy | doxorubicin | SD | |
| SFRP1 | SNV | Missense_Mutation | novel | c.153C>G | p.Phe51Leu | p.F51L | Q8N474 | protein_coding | tolerated(0.31) | benign(0.041) | TCGA-VS-A94X-01 | Cervix | cervical & endocervical cancer | Female | <65 | I/II | Chemotherapy | cisplatin | PD |
| SFRP1 | SNV | Missense_Mutation | novel | c.97G>A | p.Glu33Lys | p.E33K | Q8N474 | protein_coding | deleterious(0.01) | probably_damaging(0.922) | TCGA-AA-A00N-01 | Colorectum | colon adenocarcinoma | Male | >=65 | I/II | Unknown | Unknown | PD |
| SFRP1 | SNV | Missense_Mutation | c.400G>A | p.Glu134Lys | p.E134K | Q8N474 | protein_coding | deleterious(0.01) | probably_damaging(0.934) | TCGA-AA-A022-01 | Colorectum | colon adenocarcinoma | Female | >=65 | I/II | Unknown | Unknown | SD | |
| SFRP1 | SNV | Missense_Mutation | rs761465184 | c.845N>T | p.Thr282Met | p.T282M | Q8N474 | protein_coding | tolerated(0.19) | benign(0.354) | TCGA-AA-A02R-01 | Colorectum | colon adenocarcinoma | Female | >=65 | I/II | Unknown | Unknown | PD |
| SFRP1 | SNV | Missense_Mutation | c.383C>T | p.Pro128Leu | p.P128L | Q8N474 | protein_coding | deleterious(0.02) | probably_damaging(1) | TCGA-AG-A02N-01 | Colorectum | rectum adenocarcinoma | Male | >=65 | I/II | Chemotherapy | folinic | CR | |
| SFRP1 | SNV | Missense_Mutation | c.103N>A | p.Asp35Asn | p.D35N | Q8N474 | protein_coding | deleterious(0) | possibly_damaging(0.856) | TCGA-EI-6506-01 | Colorectum | rectum adenocarcinoma | Female | >=65 | I/II | Unknown | Unknown | SD | |
| SFRP1 | SNV | Missense_Mutation | novel | c.457N>A | p.Glu153Lys | p.E153K | Q8N474 | protein_coding | tolerated(0.05) | benign(0.338) | TCGA-F5-6814-01 | Colorectum | rectum adenocarcinoma | Male | <65 | I/II | Unknown | Unknown | SD |
| SFRP1 | SNV | Missense_Mutation | novel | c.629G>T | p.Arg210Met | p.R210M | Q8N474 | protein_coding | deleterious(0) | probably_damaging(0.964) | TCGA-A5-A0G2-01 | Endometrium | uterine corpus endometrioid carcinoma | Female | <65 | III/IV | Unknown | Unknown | SD |
| Page: 1 2 3 4 |
Top |
Related drugs of malignant transformation related genes |
| Identification of chemicals and drugs interact with genes involved in malignant transfromation |
| (DGIdb 4.0) |
| Entrez ID | Symbol | Category | Interaction Types | Drug Claim Name | Drug Name | PMIDs |
| Page: 1 |

Copyright 2023-Present -The University of Texas Health Science Center at Houston |