
|
|||||
|
 | |
| |
| |
| |
| |
| |
|
Gene: PHB |
Gene summary for PHB |
| Gene information | Species | Human | Gene symbol | PHB | Gene ID | 5245 |
| Gene name | prohibitin | |
| Gene Alias | HEL-215 | |
| Cytomap | 17q21.33 | |
| Gene Type | protein-coding | GO ID | GO:0000122 | UniProtAcc | A8K401 |
Top |
Malignant transformation analysis |
| Identification of the aberrant gene expression in precancerous and cancerous lesions by comparing the gene expression of stem-like cells in diseased tissues with normal stem cells |
| Entrez ID | Symbol | Replicates | Species | Organ | Tissue | Adj P-value | Log2FC | Malignancy |
| 5245 | PHB | AEH-subject1 | Human | Endometrium | AEH | 3.58e-06 | -2.62e-01 | -0.3059 |
| 5245 | PHB | AEH-subject2 | Human | Endometrium | AEH | 1.17e-09 | -3.31e-01 | -0.2525 |
| 5245 | PHB | AEH-subject3 | Human | Endometrium | AEH | 3.07e-03 | -1.41e-01 | -0.2576 |
| 5245 | PHB | AEH-subject4 | Human | Endometrium | AEH | 5.01e-06 | -3.02e-01 | -0.2657 |
| 5245 | PHB | AEH-subject5 | Human | Endometrium | AEH | 4.44e-05 | -2.44e-01 | -0.2953 |
| 5245 | PHB | EEC-subject1 | Human | Endometrium | EEC | 3.25e-15 | -3.62e-01 | -0.2682 |
| 5245 | PHB | EEC-subject2 | Human | Endometrium | EEC | 5.27e-07 | -3.06e-01 | -0.2607 |
| 5245 | PHB | EEC-subject3 | Human | Endometrium | EEC | 1.32e-43 | -4.10e-01 | -0.2525 |
| 5245 | PHB | EEC-subject4 | Human | Endometrium | EEC | 3.05e-02 | -1.64e-02 | -0.2571 |
| 5245 | PHB | EEC-subject5 | Human | Endometrium | EEC | 2.14e-03 | -1.68e-01 | -0.249 |
| 5245 | PHB | GSM5276934 | Human | Endometrium | EEC | 3.54e-06 | -2.81e-01 | -0.0913 |
| 5245 | PHB | GSM5276937 | Human | Endometrium | EEC | 2.24e-04 | -2.59e-01 | -0.0897 |
| 5245 | PHB | GSM6177620_NYU_UCEC1_lib1_lib1 | Human | Endometrium | EEC | 2.52e-25 | -2.58e-01 | -0.1869 |
| 5245 | PHB | GSM6177620_NYU_UCEC1_lib2_lib2 | Human | Endometrium | EEC | 2.79e-27 | -1.94e-01 | -0.1875 |
| 5245 | PHB | GSM6177620_NYU_UCEC1_lib3_lib3 | Human | Endometrium | EEC | 2.18e-27 | -1.42e-01 | -0.1883 |
| 5245 | PHB | GSM6177621_NYU_UCEC2_lib1_lib1 | Human | Endometrium | EEC | 5.02e-27 | -2.11e-01 | -0.1934 |
| 5245 | PHB | GSM6177622_NYU_UCEC3_lib1_lib1 | Human | Endometrium | EEC | 3.71e-44 | -1.24e-01 | -0.1917 |
| 5245 | PHB | GSM6177622_NYU_UCEC3_lib2_lib2 | Human | Endometrium | EEC | 4.06e-36 | -1.44e-01 | -0.1916 |
| 5245 | PHB | GSM6177623_NYU_UCEC3_Vis | Human | Endometrium | EEC | 3.76e-03 | -2.20e-02 | -0.1269 |
| 5245 | PHB | LZE2D | Human | Esophagus | HGIN | 1.73e-02 | 1.75e-01 | 0.0642 |
| Page: 1 2 3 4 5 6 7 8 |
| Tissue | Expression Dynamics | Abbreviation |
| Endometrium |  | AEH: Atypical endometrial hyperplasia |
| EEC: Endometrioid Cancer | ||
| Esophagus | 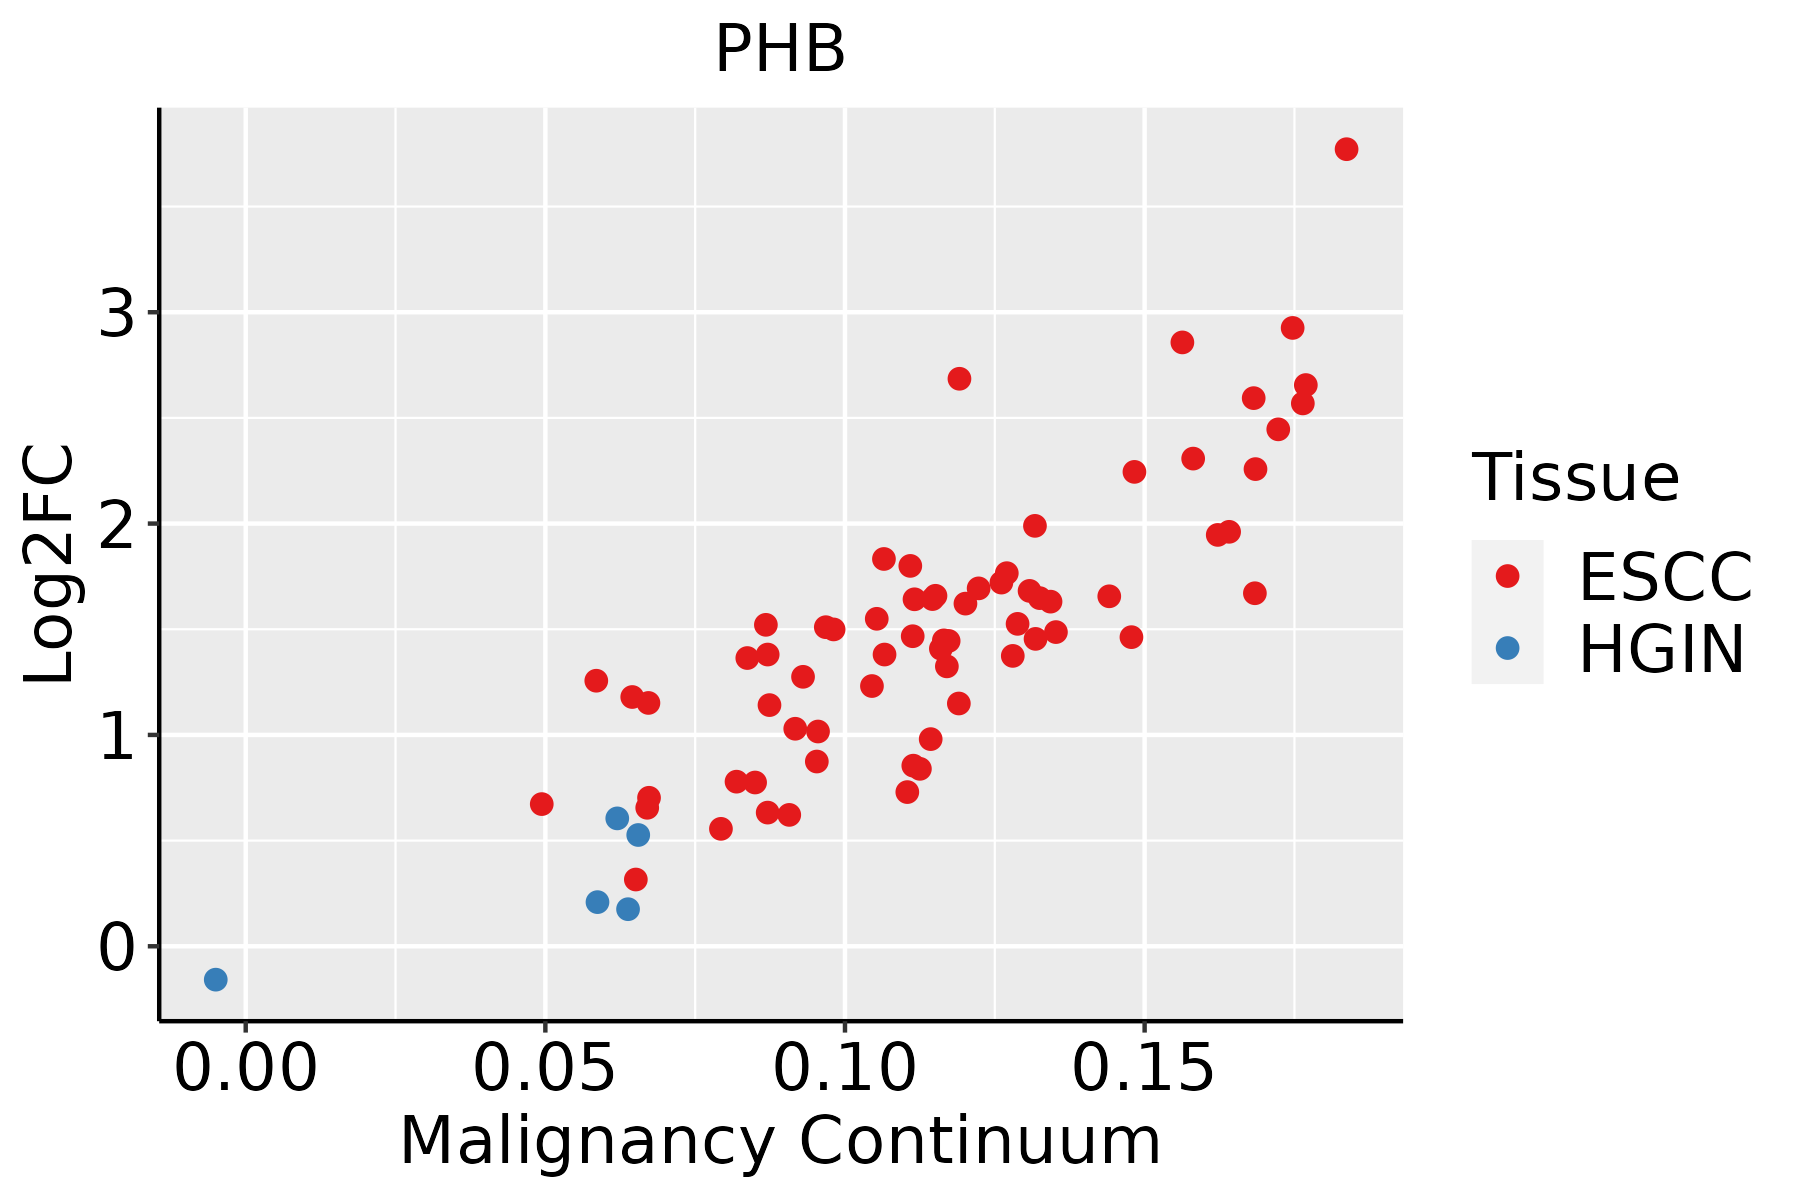 | ESCC: Esophageal squamous cell carcinoma |
| HGIN: High-grade intraepithelial neoplasias | ||
| LGIN: Low-grade intraepithelial neoplasias | ||
| Liver | 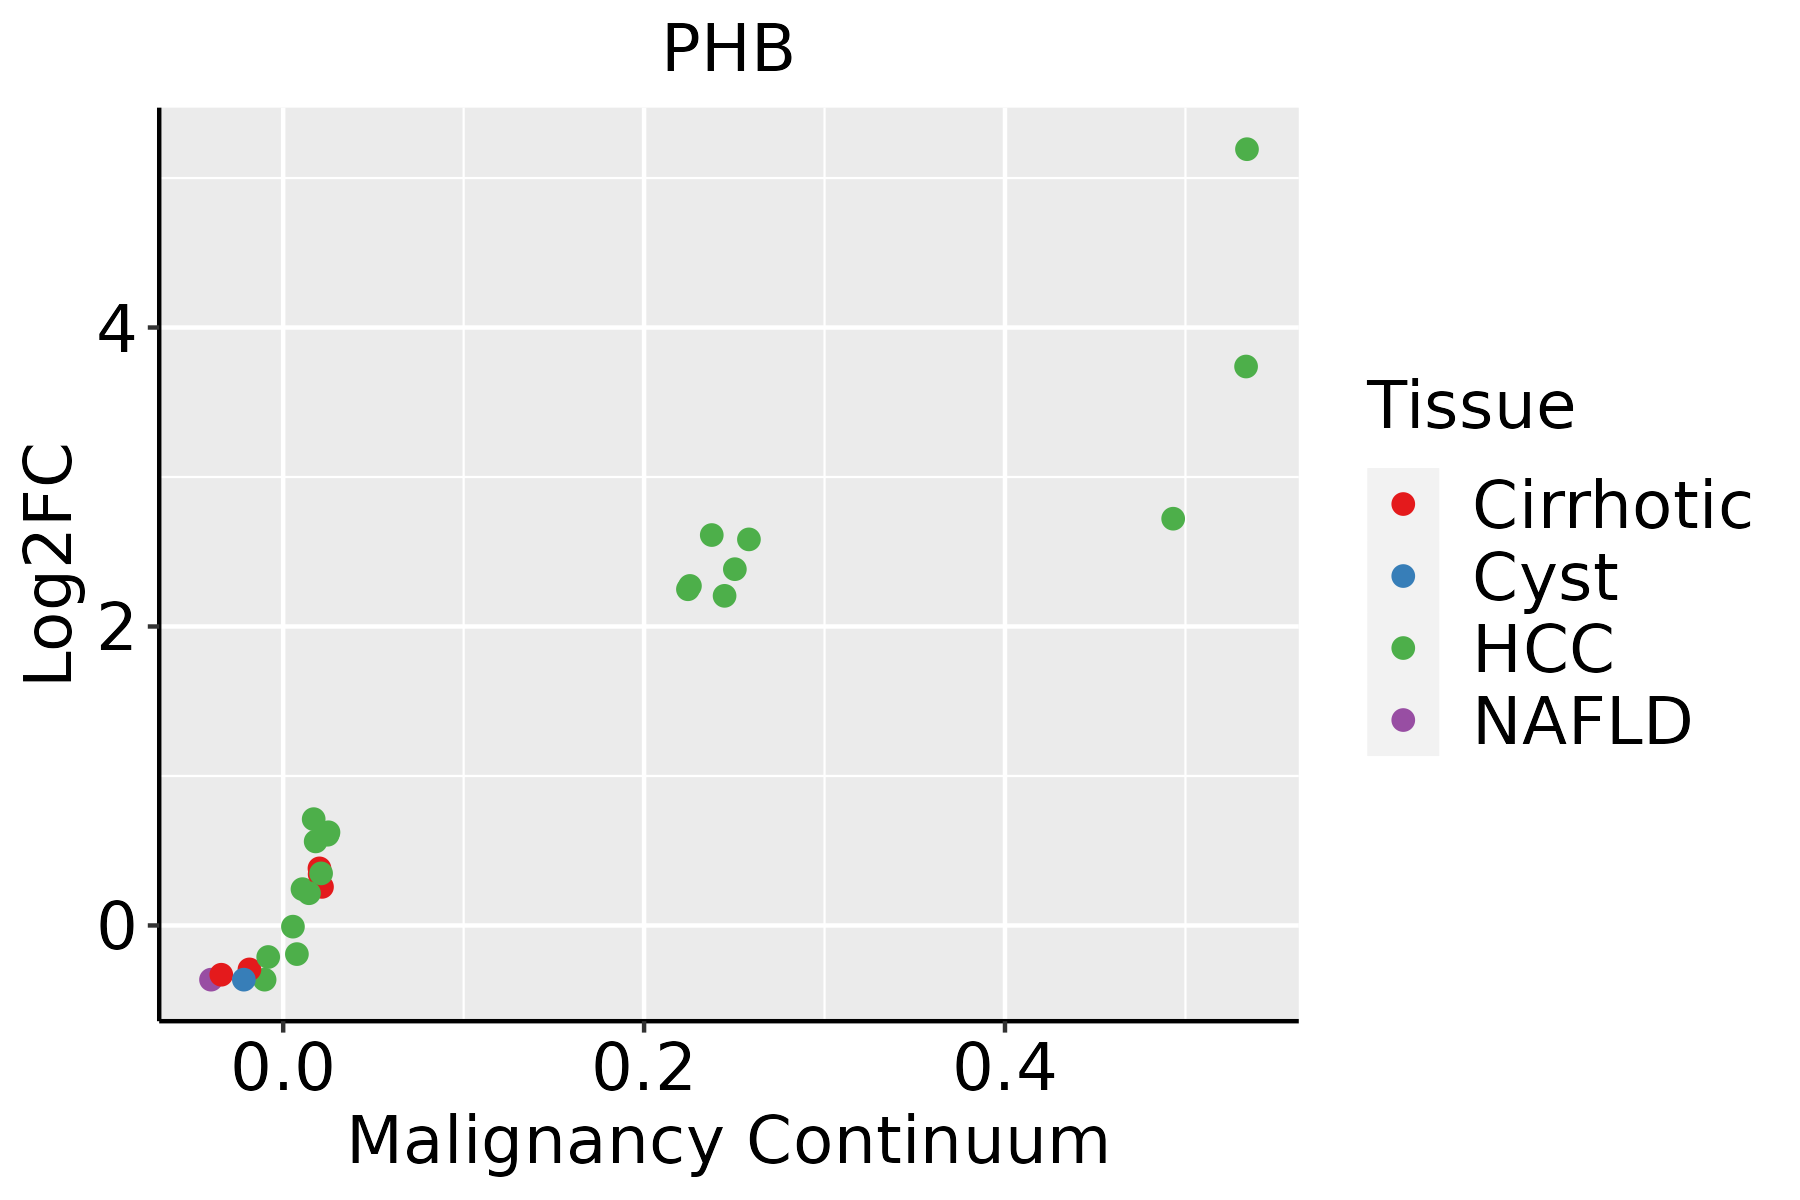 | HCC: Hepatocellular carcinoma |
| NAFLD: Non-alcoholic fatty liver disease | ||
| Oral Cavity | 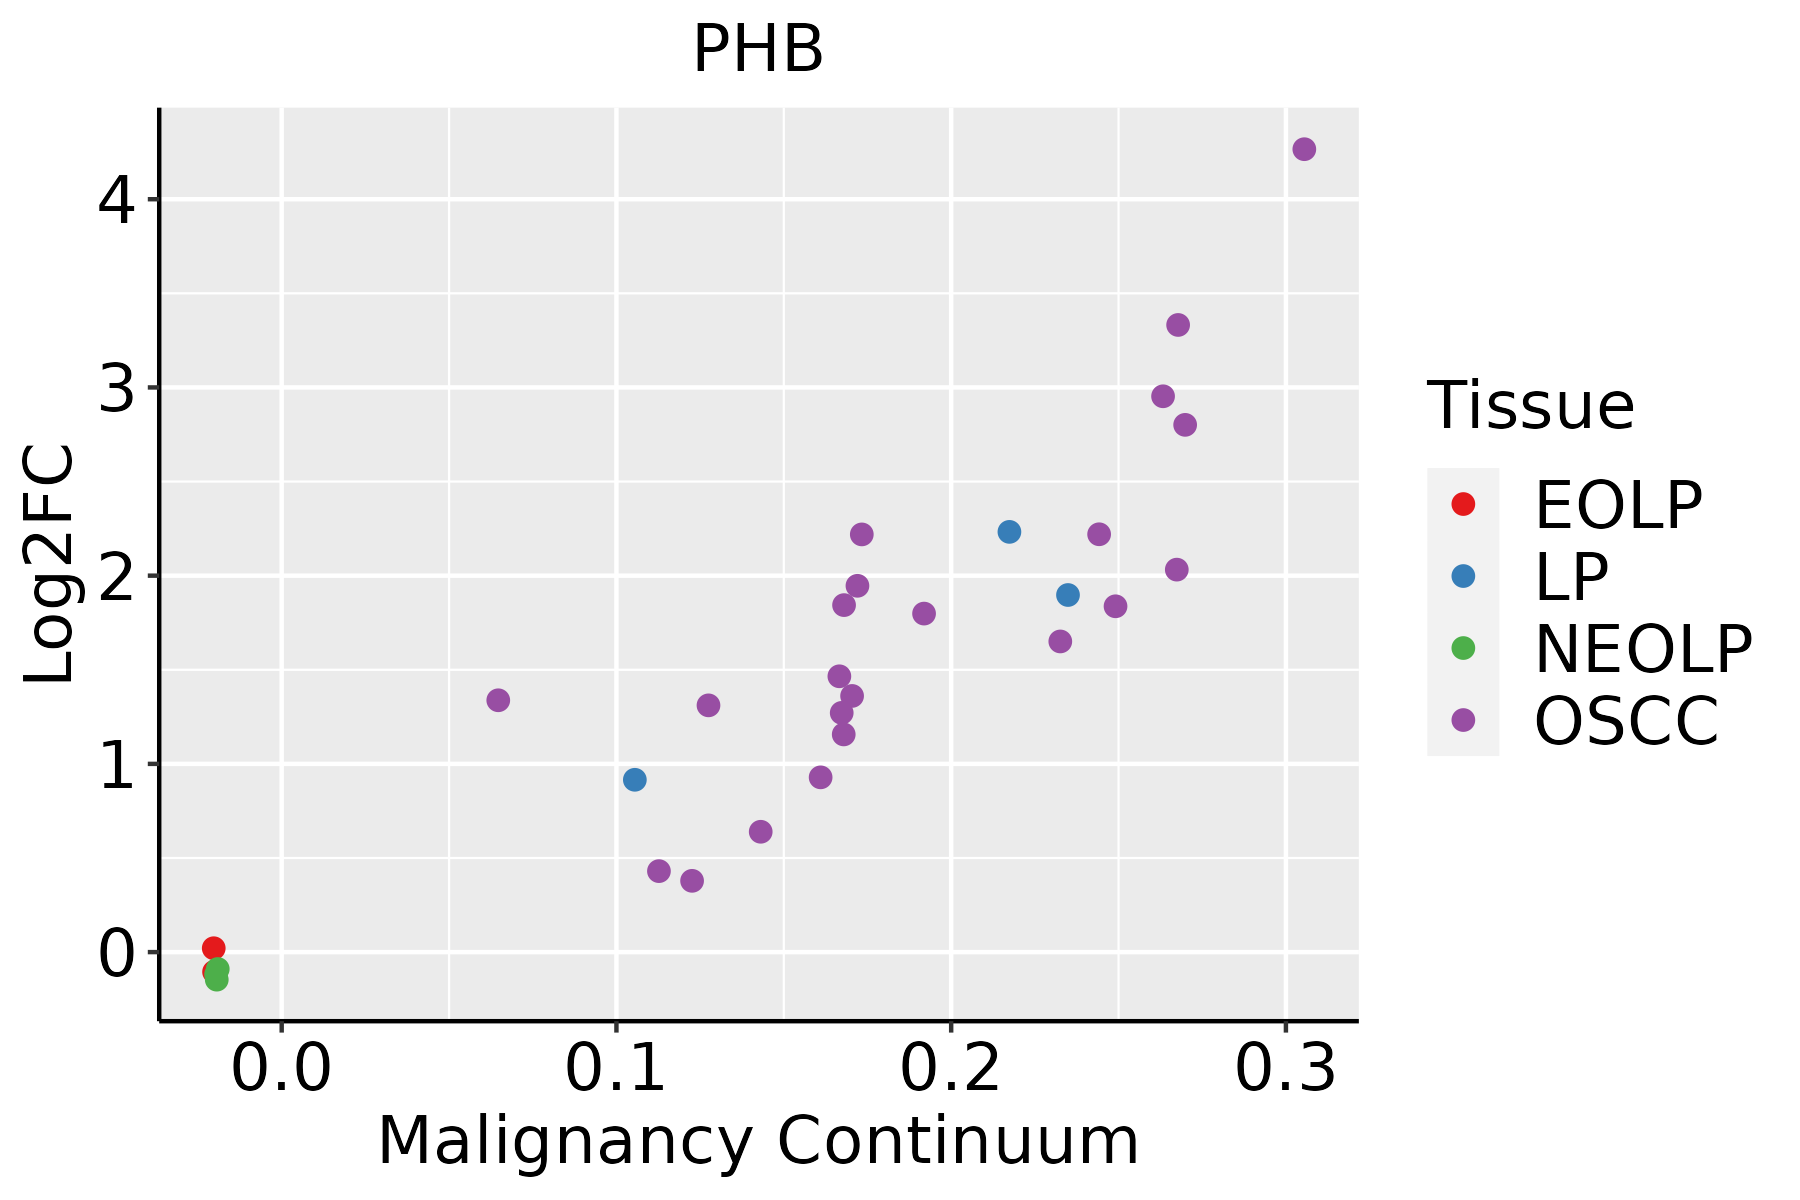 | EOLP: Erosive Oral lichen planus |
| LP: leukoplakia | ||
| NEOLP: Non-erosive oral lichen planus | ||
| OSCC: Oral squamous cell carcinoma | ||
| Prostate |  | BPH: Benign Prostatic Hyperplasia |
| Skin |  | AK: Actinic keratosis |
| cSCC: Cutaneous squamous cell carcinoma | ||
| SCCIS:squamous cell carcinoma in situ | ||
| Thyroid |  | ATC: Anaplastic thyroid cancer |
| HT: Hashimoto's thyroiditis | ||
| PTC: Papillary thyroid cancer |
| ∗log2FC in expression of this searched gene in stem-like cells from each diseased tissue sample relative to stem-like cells in normal samples in each tissue plotted against the malignancy continuum. Samples are colored based on if they are from different disease stage. |
Top |
Malignant transformation related pathway analysis |
| Find out the enriched GO biological processes and KEGG pathways involved in transition from healthy to precancer to cancer |
| Tissue | Disease Stage | Enriched GO biological Processes |
| Colorectum | AD |  |
| Colorectum | SER |  |
| Colorectum | MSS |  |
| Colorectum | MSI-H |  |
| Colorectum | FAP |  |
| ∗Top 15 enriched GO BP terms are showed in the bar plot of each disease state in each tissue. Each row represents a significant GO biological process which is colored according to the -log10(p.adjust). |
| Page: 1 2 3 4 5 6 7 8 9 |
| GO ID | Tissue | Disease Stage | Description | Gene Ratio | Bg Ratio | pvalue | p.adjust | Count |
| GO:00192167 | Oral cavity | OSCC | regulation of lipid metabolic process | 154/7305 | 331/18723 | 3.00e-03 | 1.30e-02 | 154 |
| GO:00395294 | Oral cavity | OSCC | RIG-I signaling pathway | 18/7305 | 27/18723 | 3.34e-03 | 1.42e-02 | 18 |
| GO:00331462 | Oral cavity | OSCC | regulation of intracellular estrogen receptor signaling pathway | 22/7305 | 35/18723 | 3.65e-03 | 1.51e-02 | 22 |
| GO:00066445 | Oral cavity | OSCC | phospholipid metabolic process | 175/7305 | 383/18723 | 4.21e-03 | 1.71e-02 | 175 |
| GO:003087910 | Oral cavity | OSCC | mammary gland development | 69/7305 | 137/18723 | 4.43e-03 | 1.79e-02 | 69 |
| GO:00190483 | Oral cavity | OSCC | modulation by virus of host process | 9/7305 | 11/18723 | 4.85e-03 | 1.92e-02 | 9 |
| GO:00481022 | Oral cavity | OSCC | autophagic cell death | 9/7305 | 11/18723 | 4.85e-03 | 1.92e-02 | 9 |
| GO:003432916 | Oral cavity | OSCC | cell junction assembly | 190/7305 | 420/18723 | 4.99e-03 | 1.96e-02 | 190 |
| GO:00486614 | Oral cavity | OSCC | positive regulation of smooth muscle cell proliferation | 54/7305 | 104/18723 | 5.00e-03 | 1.96e-02 | 54 |
| GO:00518976 | Oral cavity | OSCC | positive regulation of protein kinase B signaling | 61/7305 | 120/18723 | 5.52e-03 | 2.14e-02 | 61 |
| GO:00335987 | Oral cavity | OSCC | mammary gland epithelial cell proliferation | 17/7305 | 26/18723 | 5.83e-03 | 2.23e-02 | 17 |
| GO:00486596 | Oral cavity | OSCC | smooth muscle cell proliferation | 89/7305 | 184/18723 | 5.95e-03 | 2.27e-02 | 89 |
| GO:00607654 | Oral cavity | OSCC | regulation of androgen receptor signaling pathway | 18/7305 | 28/18723 | 5.96e-03 | 2.27e-02 | 18 |
| GO:00605629 | Oral cavity | OSCC | epithelial tube morphogenesis | 149/7305 | 325/18723 | 6.73e-03 | 2.50e-02 | 149 |
| GO:00480132 | Oral cavity | OSCC | ephrin receptor signaling pathway | 29/7305 | 51/18723 | 7.33e-03 | 2.71e-02 | 29 |
| GO:0023035 | Oral cavity | OSCC | CD40 signaling pathway | 11/7305 | 15/18723 | 7.49e-03 | 2.75e-02 | 11 |
| GO:00313458 | Oral cavity | OSCC | negative regulation of cell projection organization | 89/7305 | 186/18723 | 8.51e-03 | 3.09e-02 | 89 |
| GO:00434107 | Oral cavity | OSCC | positive regulation of MAPK cascade | 213/7305 | 480/18723 | 8.71e-03 | 3.16e-02 | 213 |
| GO:00440031 | Oral cavity | OSCC | modulation by symbiont of host process | 13/7305 | 19/18723 | 9.07e-03 | 3.26e-02 | 13 |
| GO:00448274 | Oral cavity | OSCC | modulation by host of viral genome replication | 13/7305 | 19/18723 | 9.07e-03 | 3.26e-02 | 13 |
| Page: 1 2 3 4 5 6 7 8 9 10 11 12 13 14 15 16 17 18 19 20 21 22 23 24 25 26 27 28 29 30 31 32 33 34 35 36 37 38 39 40 41 42 43 44 45 46 47 48 49 50 51 52 53 54 55 56 57 58 59 60 61 62 63 64 65 66 67 68 69 70 71 72 73 74 75 76 77 78 79 80 81 82 83 84 85 86 87 88 89 90 91 92 93 94 95 96 97 98 99 100 101 102 103 104 105 106 107 108 109 110 111 112 113 114 115 |
| Pathway ID | Tissue | Disease Stage | Description | Gene Ratio | Bg Ratio | pvalue | p.adjust | qvalue | Count |
| Page: 1 |
Top |
Cell-cell communication analysis |
| Identification of potential cell-cell interactions between two cell types and their ligand-receptor pairs for different disease states |
| Ligand | Receptor | LRpair | Pathway | Tissue | Disease Stage |
| EFNB2 | EPHB1 | EFNB2_EPHB1 | EPHB | Breast | DCIS |
| EFNB1 | EPHB1 | EFNB1_EPHB1 | EPHB | Breast | Healthy |
| EFNB2 | EPHB1 | EFNB2_EPHB1 | EPHB | Breast | Healthy |
| EFNA5 | EPHB2 | EFNA5_EPHB2 | EPHA | Cervix | CC |
| EFNB1 | EPHB2 | EFNB1_EPHB2 | EPHB | Cervix | CC |
| EFNB2 | EPHB2 | EFNB2_EPHB2 | EPHB | Cervix | CC |
| EFNB1 | EPHB2 | EFNB1_EPHB2 | EPHB | CRC | AD |
| EFNB1 | EPHB4 | EFNB1_EPHB4 | EPHB | CRC | AD |
| EFNB2 | EPHB2 | EFNB2_EPHB2 | EPHB | CRC | AD |
| EFNA5 | EPHB2 | EFNA5_EPHB2 | EPHA | CRC | AD |
| EFNA5 | EPHB2 | EFNA5_EPHB2 | EPHA | CRC | ADJ |
| EFNB1 | EPHB2 | EFNB1_EPHB2 | EPHB | CRC | ADJ |
| EFNB2 | EPHB2 | EFNB2_EPHB2 | EPHB | CRC | ADJ |
| EFNA5 | EPHB2 | EFNA5_EPHB2 | EPHA | CRC | CRC |
| EFNB2 | EPHB2 | EFNB2_EPHB2 | EPHB | CRC | CRC |
| EFNA5 | EPHB2 | EFNA5_EPHB2 | EPHA | CRC | FAP |
| EFNB2 | EPHB2 | EFNB2_EPHB2 | EPHB | CRC | FAP |
| EFNA5 | EPHB2 | EFNA5_EPHB2 | EPHA | CRC | Healthy |
| EFNB2 | EPHB2 | EFNB2_EPHB2 | EPHB | CRC | Healthy |
| EFNA5 | EPHB2 | EFNA5_EPHB2 | EPHA | CRC | MSI-H |
| Page: 1 |
Top |
Single-cell gene regulatory network inference analysis |
| Find out the significant the regulons (TFs) and the target genes of each regulon across cell types for different disease states |
| TF | Cell Type | Tissue | Disease Stage | Target Gene | RSS | Regulon Activity |
| ∗The dot plots of a searched regulon are shown for all cell subpopulations in each disease state of each tissue based on the regulon specific score inferred using pySCENIC and by calculating the average expression. |
| Page: 1 |
Top |
Somatic mutation of malignant transformation related genes |
| Annotation of somatic variants for genes involved in malignant transformation |
| Hugo Symbol | Variant Class | Variant Classification | dbSNP RS | HGVSc | HGVSp | HGVSp Short | SWISSPROT | BIOTYPE | SIFT | PolyPhen | Tumor Sample Barcode | Tissue | Histology | Sex | Age | Stage | Therapy Types | Drugs | Outcome |
| PHB | SNV | Missense_Mutation | novel | c.590G>C | p.Arg197Thr | p.R197T | P35232 | protein_coding | deleterious(0.02) | possibly_damaging(0.848) | TCGA-A8-A09Q-01 | Breast | breast invasive carcinoma | Female | >=65 | III/IV | Hormone Therapy | anastrozole | SD |
| PHB | insertion | Nonsense_Mutation | novel | c.69_70insTATTCAAAAAGAGCTTCCCAGCCCACTTCCTAGTTGGATGTGC | p.Asn24TyrfsTer11 | p.N24Yfs*11 | P35232 | protein_coding | TCGA-AN-A0FX-01 | Breast | breast invasive carcinoma | Female | <65 | I/II | Unknown | Unknown | SD | ||
| PHB | insertion | Nonsense_Mutation | novel | c.249_250insTTCTCATAGACAGGGAAATAAGCTCAGGTTGGCTAAGGCTTAGAGAG | p.Asp84PhefsTer3 | p.D84Ffs*3 | P35232 | protein_coding | TCGA-AO-A03T-01 | Breast | breast invasive carcinoma | Female | <65 | I/II | Chemotherapy | cyclophosphamide | SD | ||
| PHB | SNV | Missense_Mutation | c.349N>T | p.Arg117Cys | p.R117C | P35232 | protein_coding | deleterious(0.02) | benign(0.007) | TCGA-2W-A8YY-01 | Cervix | cervical & endocervical cancer | Female | <65 | I/II | Chemotherapy | cisplatin | CR | |
| PHB | SNV | Missense_Mutation | c.466G>A | p.Glu156Lys | p.E156K | P35232 | protein_coding | tolerated(0.36) | benign(0.314) | TCGA-IR-A3LK-01 | Cervix | cervical & endocervical cancer | Female | >=65 | I/II | Chemotherapy | cisplatin | PD | |
| PHB | SNV | Missense_Mutation | c.347N>C | p.Glu116Ala | p.E116A | P35232 | protein_coding | deleterious(0.01) | probably_damaging(0.933) | TCGA-AA-A022-01 | Colorectum | colon adenocarcinoma | Female | >=65 | I/II | Unknown | Unknown | SD | |
| PHB | SNV | Missense_Mutation | c.349C>T | p.Arg117Cys | p.R117C | P35232 | protein_coding | deleterious(0.02) | benign(0.007) | TCGA-D5-6928-01 | Colorectum | colon adenocarcinoma | Male | >=65 | I/II | Unknown | Unknown | SD | |
| PHB | SNV | Missense_Mutation | rs377541756 | c.626N>T | p.Ala209Val | p.A209V | P35232 | protein_coding | deleterious(0.04) | benign(0.327) | TCGA-AG-A002-01 | Colorectum | rectum adenocarcinoma | Male | <65 | I/II | Unknown | Unknown | SD |
| PHB | SNV | Missense_Mutation | novel | c.175C>T | p.Pro59Ser | p.P59S | P35232 | protein_coding | deleterious(0) | probably_damaging(1) | TCGA-AJ-A8CW-01 | Endometrium | uterine corpus endometrioid carcinoma | Female | <65 | I/II | Unknown | Unknown | SD |
| PHB | SNV | Missense_Mutation | rs759272172 | c.397N>T | p.Arg133Cys | p.R133C | P35232 | protein_coding | tolerated(0.06) | benign(0.021) | TCGA-AP-A059-01 | Endometrium | uterine corpus endometrioid carcinoma | Female | >=65 | I/II | Unknown | Unknown | SD |
| Page: 1 2 3 |
Top |
Related drugs of malignant transformation related genes |
| Identification of chemicals and drugs interact with genes involved in malignant transfromation |
| (DGIdb 4.0) |
| Entrez ID | Symbol | Category | Interaction Types | Drug Claim Name | Drug Name | PMIDs |
| Page: 1 |

Copyright 2023-Present -The University of Texas Health Science Center at Houston |