
|
|||||
|
 | |
| |
| |
| |
| |
| |
|
Gene: CD81 |
Gene summary for CD81 |
| Gene information | Species | Human | Gene symbol | CD81 | Gene ID | 975 |
| Gene name | CD81 molecule | |
| Gene Alias | CVID6 | |
| Cytomap | 11p15.5 | |
| Gene Type | protein-coding | GO ID | GO:0000165 | UniProtAcc | E9PJK1 |
Top |
Malignant transformation analysis |
| Identification of the aberrant gene expression in precancerous and cancerous lesions by comparing the gene expression of stem-like cells in diseased tissues with normal stem cells |
| Entrez ID | Symbol | Replicates | Species | Organ | Tissue | Adj P-value | Log2FC | Malignancy |
| 975 | CD81 | GSM4909282 | Human | Breast | IDC | 2.25e-05 | 2.78e-01 | -0.0288 |
| 975 | CD81 | GSM4909285 | Human | Breast | IDC | 3.24e-05 | -4.04e-01 | 0.21 |
| 975 | CD81 | GSM4909286 | Human | Breast | IDC | 7.61e-06 | -3.90e-01 | 0.1081 |
| 975 | CD81 | GSM4909293 | Human | Breast | IDC | 4.20e-44 | 6.99e-01 | 0.1581 |
| 975 | CD81 | GSM4909297 | Human | Breast | IDC | 2.24e-06 | -3.47e-01 | 0.1517 |
| 975 | CD81 | GSM4909298 | Human | Breast | IDC | 3.71e-18 | 3.95e-01 | 0.1551 |
| 975 | CD81 | GSM4909299 | Human | Breast | IDC | 2.39e-04 | 2.33e-01 | 0.035 |
| 975 | CD81 | GSM4909303 | Human | Breast | IDC | 1.38e-03 | 5.34e-01 | 0.0438 |
| 975 | CD81 | GSM4909304 | Human | Breast | IDC | 8.64e-09 | 3.28e-01 | 0.1636 |
| 975 | CD81 | GSM4909308 | Human | Breast | IDC | 3.63e-04 | -2.97e-01 | 0.158 |
| 975 | CD81 | GSM4909311 | Human | Breast | IDC | 9.49e-11 | -2.21e-01 | 0.1534 |
| 975 | CD81 | GSM4909312 | Human | Breast | IDC | 3.12e-09 | -4.61e-01 | 0.1552 |
| 975 | CD81 | GSM4909317 | Human | Breast | IDC | 1.73e-06 | 4.24e-01 | 0.1355 |
| 975 | CD81 | GSM4909319 | Human | Breast | IDC | 4.50e-21 | -4.11e-01 | 0.1563 |
| 975 | CD81 | GSM4909320 | Human | Breast | IDC | 3.82e-04 | -4.32e-01 | 0.1575 |
| 975 | CD81 | GSM4909321 | Human | Breast | IDC | 1.07e-04 | -3.58e-01 | 0.1559 |
| 975 | CD81 | brca1 | Human | Breast | Precancer | 6.03e-14 | 3.42e-01 | -0.0338 |
| 975 | CD81 | brca2 | Human | Breast | Precancer | 9.78e-08 | 4.31e-02 | -0.024 |
| 975 | CD81 | brca3 | Human | Breast | Precancer | 9.72e-04 | -1.08e-02 | -0.0263 |
| 975 | CD81 | NCCBC11 | Human | Breast | DCIS | 3.49e-06 | 5.55e-01 | 0.1232 |
| Page: 1 2 3 4 5 6 7 8 9 10 11 12 13 14 |
| Tissue | Expression Dynamics | Abbreviation |
| Breast |  | IDC: Invasive ductal carcinoma |
| DCIS: Ductal carcinoma in situ | ||
| Precancer(BRCA1-mut): Precancerous lesion from BRCA1 mutation carriers | ||
| Cervix |  | CC: Cervix cancer |
| HSIL_HPV: HPV-infected high-grade squamous intraepithelial lesions | ||
| N_HPV: HPV-infected normal cervix | ||
| Colorectum (GSE201348) |  | FAP: Familial adenomatous polyposis |
| CRC: Colorectal cancer | ||
| Colorectum (HTA11) |  | AD: Adenomas |
| SER: Sessile serrated lesions | ||
| MSI-H: Microsatellite-high colorectal cancer | ||
| MSS: Microsatellite stable colorectal cancer | ||
| Endometrium | 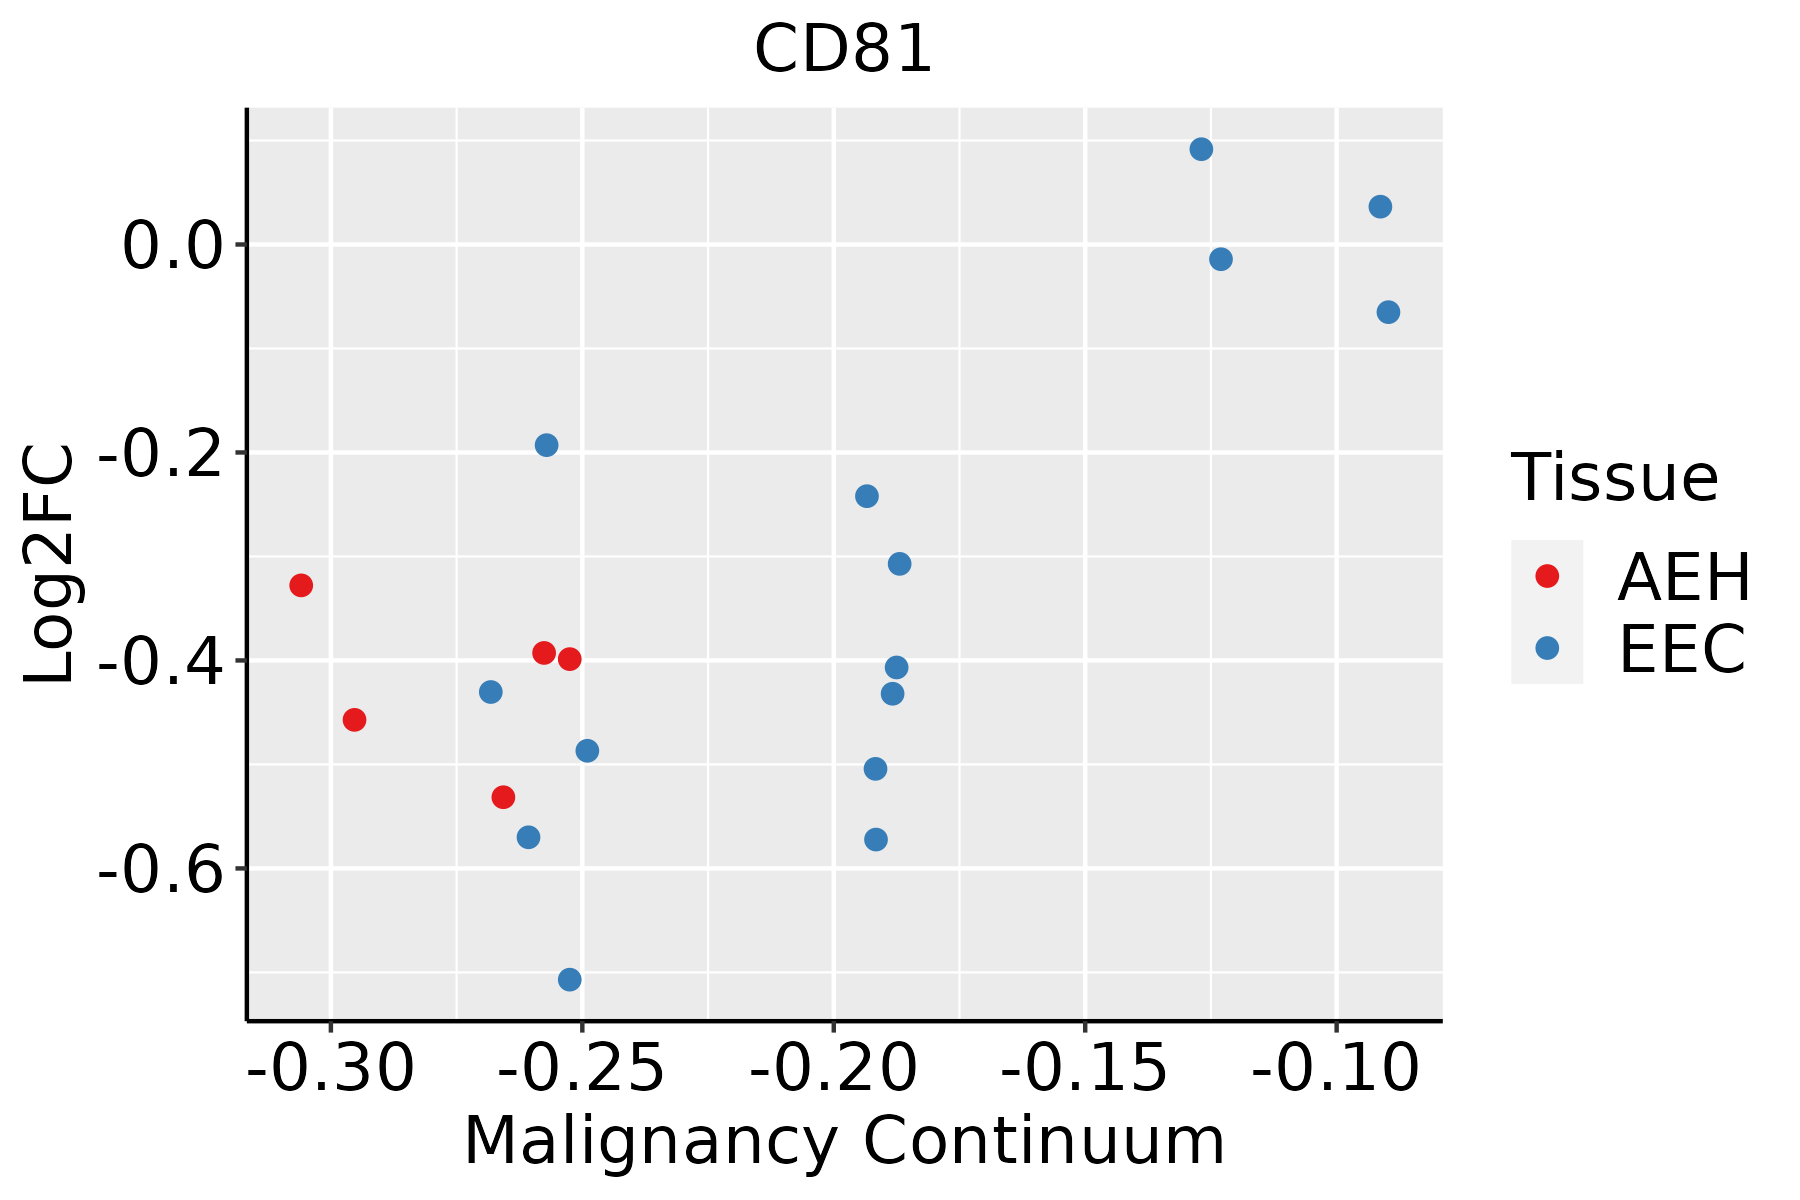 | AEH: Atypical endometrial hyperplasia |
| EEC: Endometrioid Cancer | ||
| Esophagus | 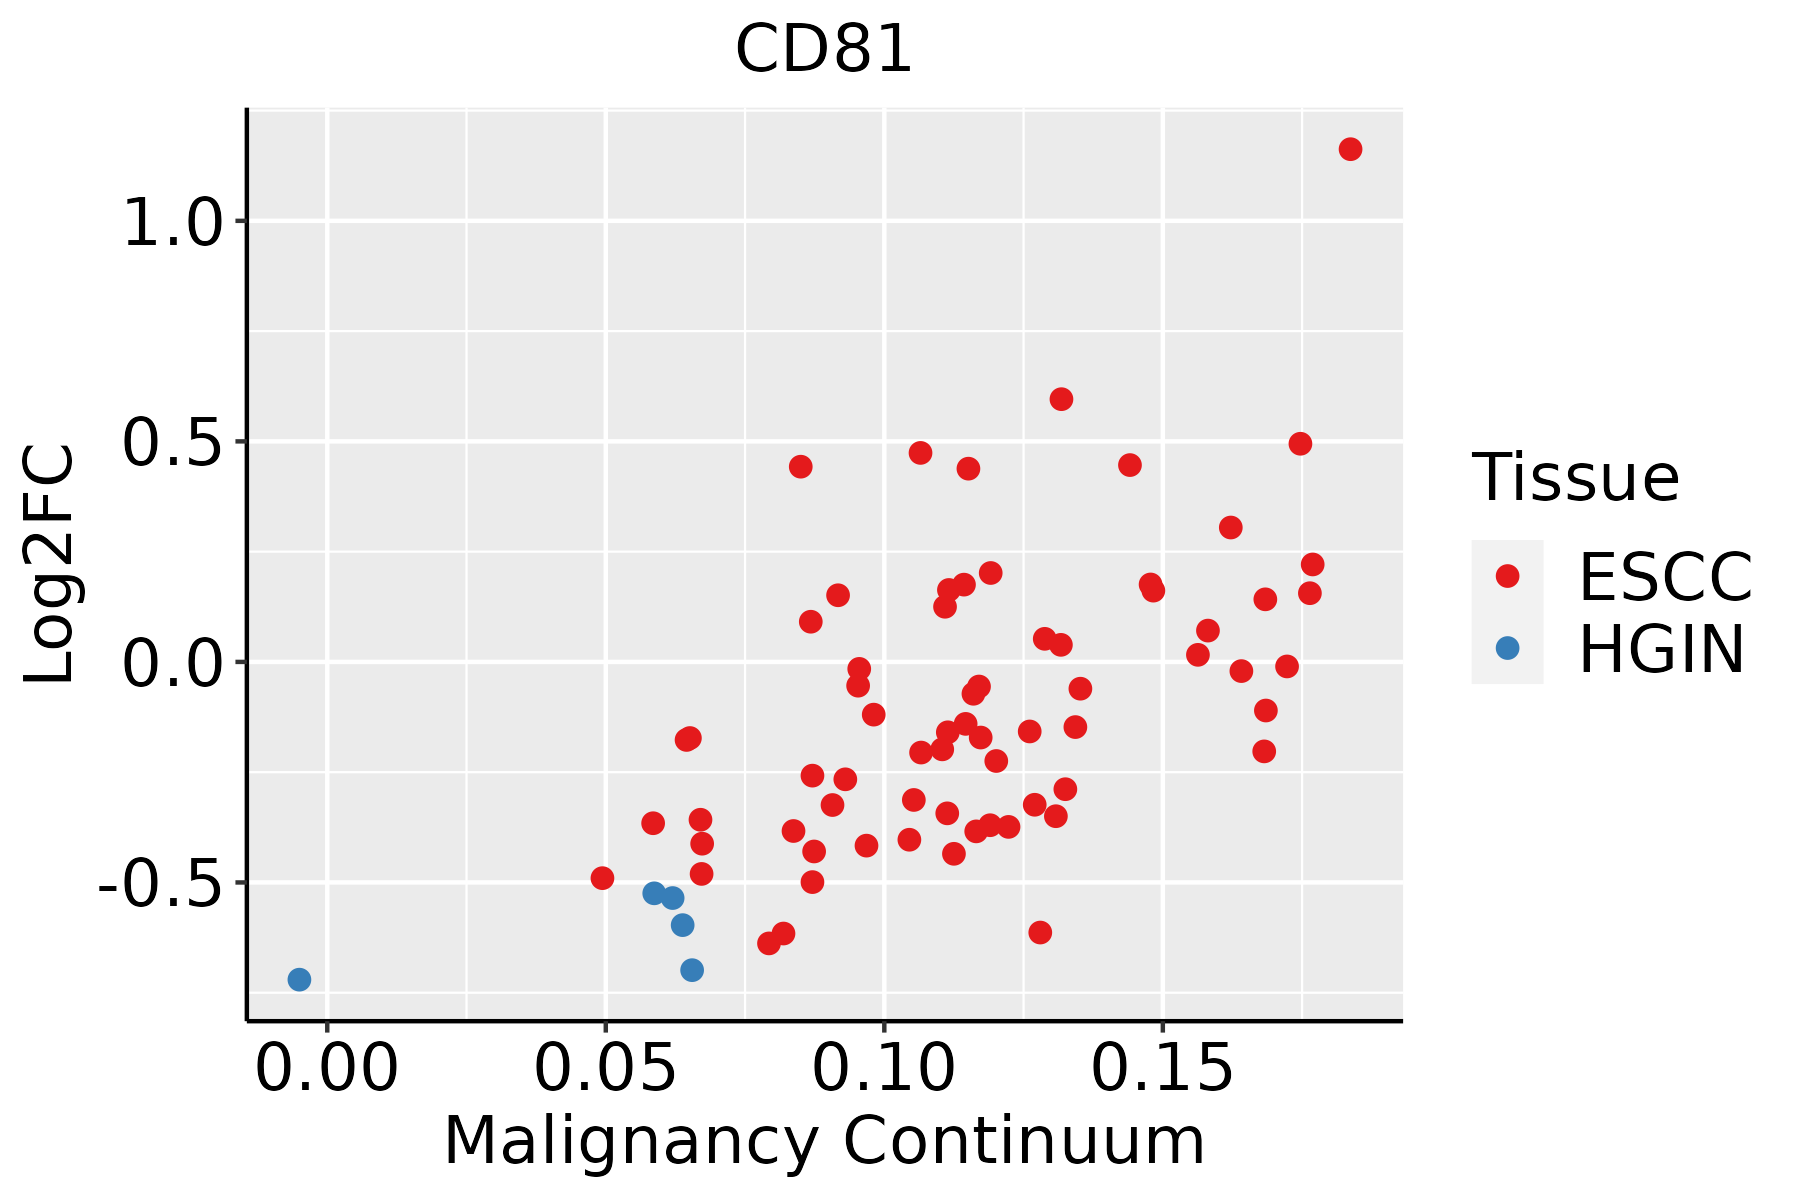 | ESCC: Esophageal squamous cell carcinoma |
| HGIN: High-grade intraepithelial neoplasias | ||
| LGIN: Low-grade intraepithelial neoplasias | ||
| Liver | 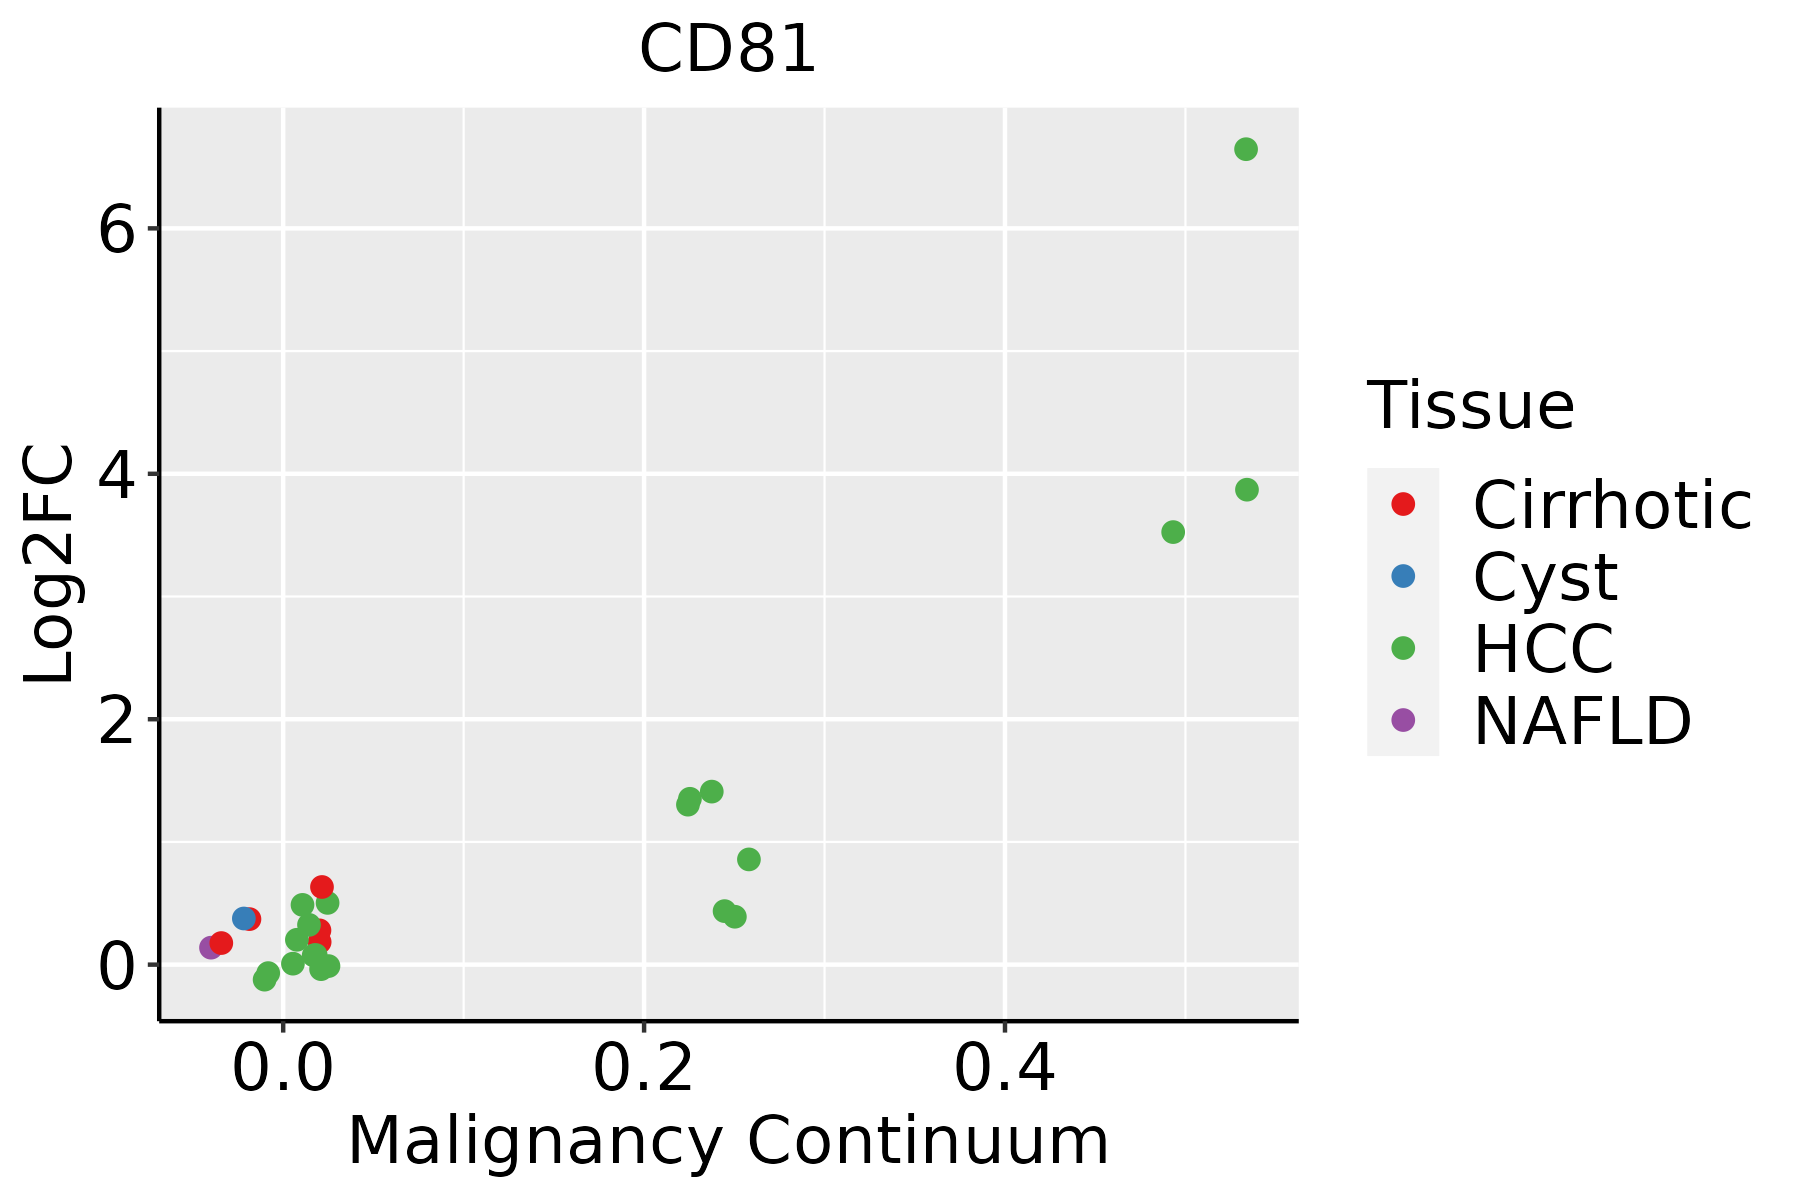 | HCC: Hepatocellular carcinoma |
| NAFLD: Non-alcoholic fatty liver disease | ||
| Lung |  | AAH: Atypical adenomatous hyperplasia |
| AIS: Adenocarcinoma in situ | ||
| IAC: Invasive lung adenocarcinoma | ||
| MIA: Minimally invasive adenocarcinoma | ||
| Oral Cavity | 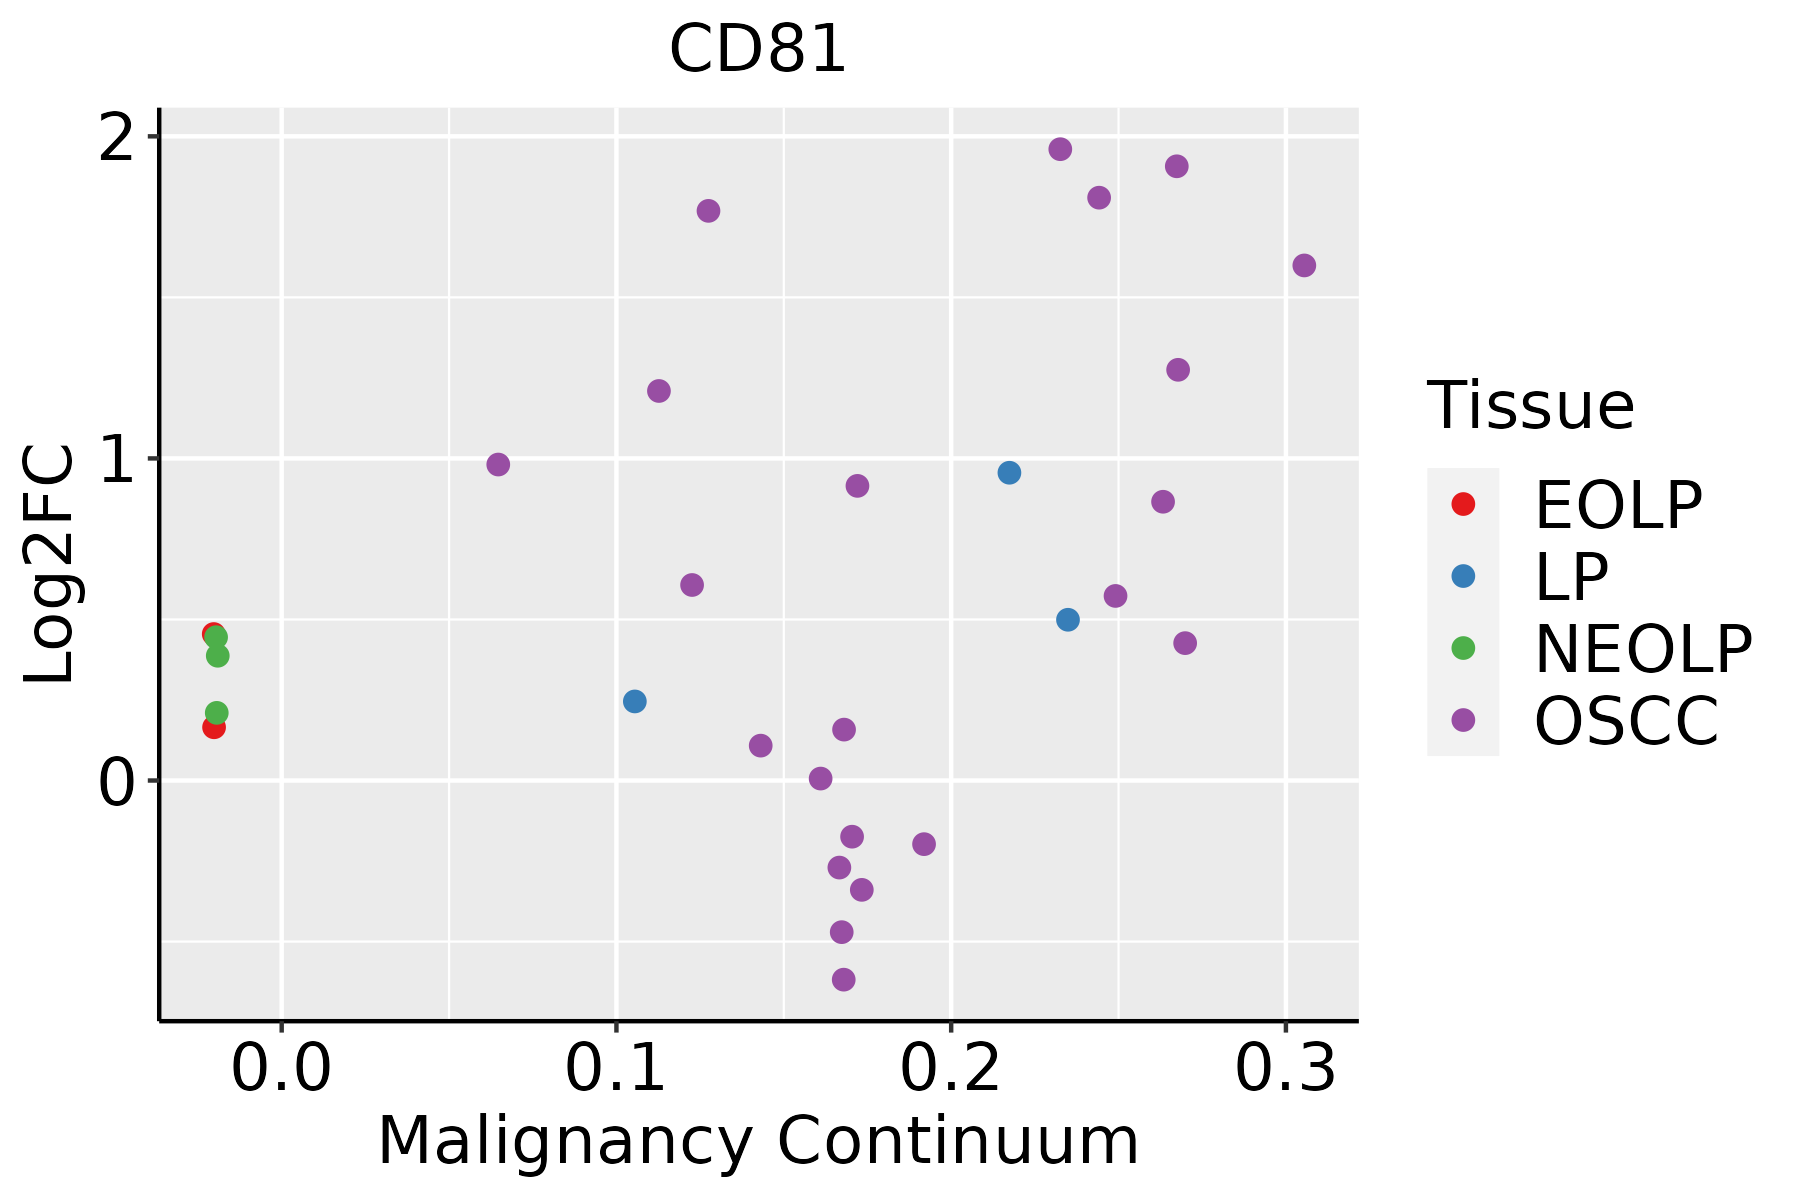 | EOLP: Erosive Oral lichen planus |
| LP: leukoplakia | ||
| NEOLP: Non-erosive oral lichen planus | ||
| OSCC: Oral squamous cell carcinoma | ||
| Prostate |  | BPH: Benign Prostatic Hyperplasia |
| Skin | 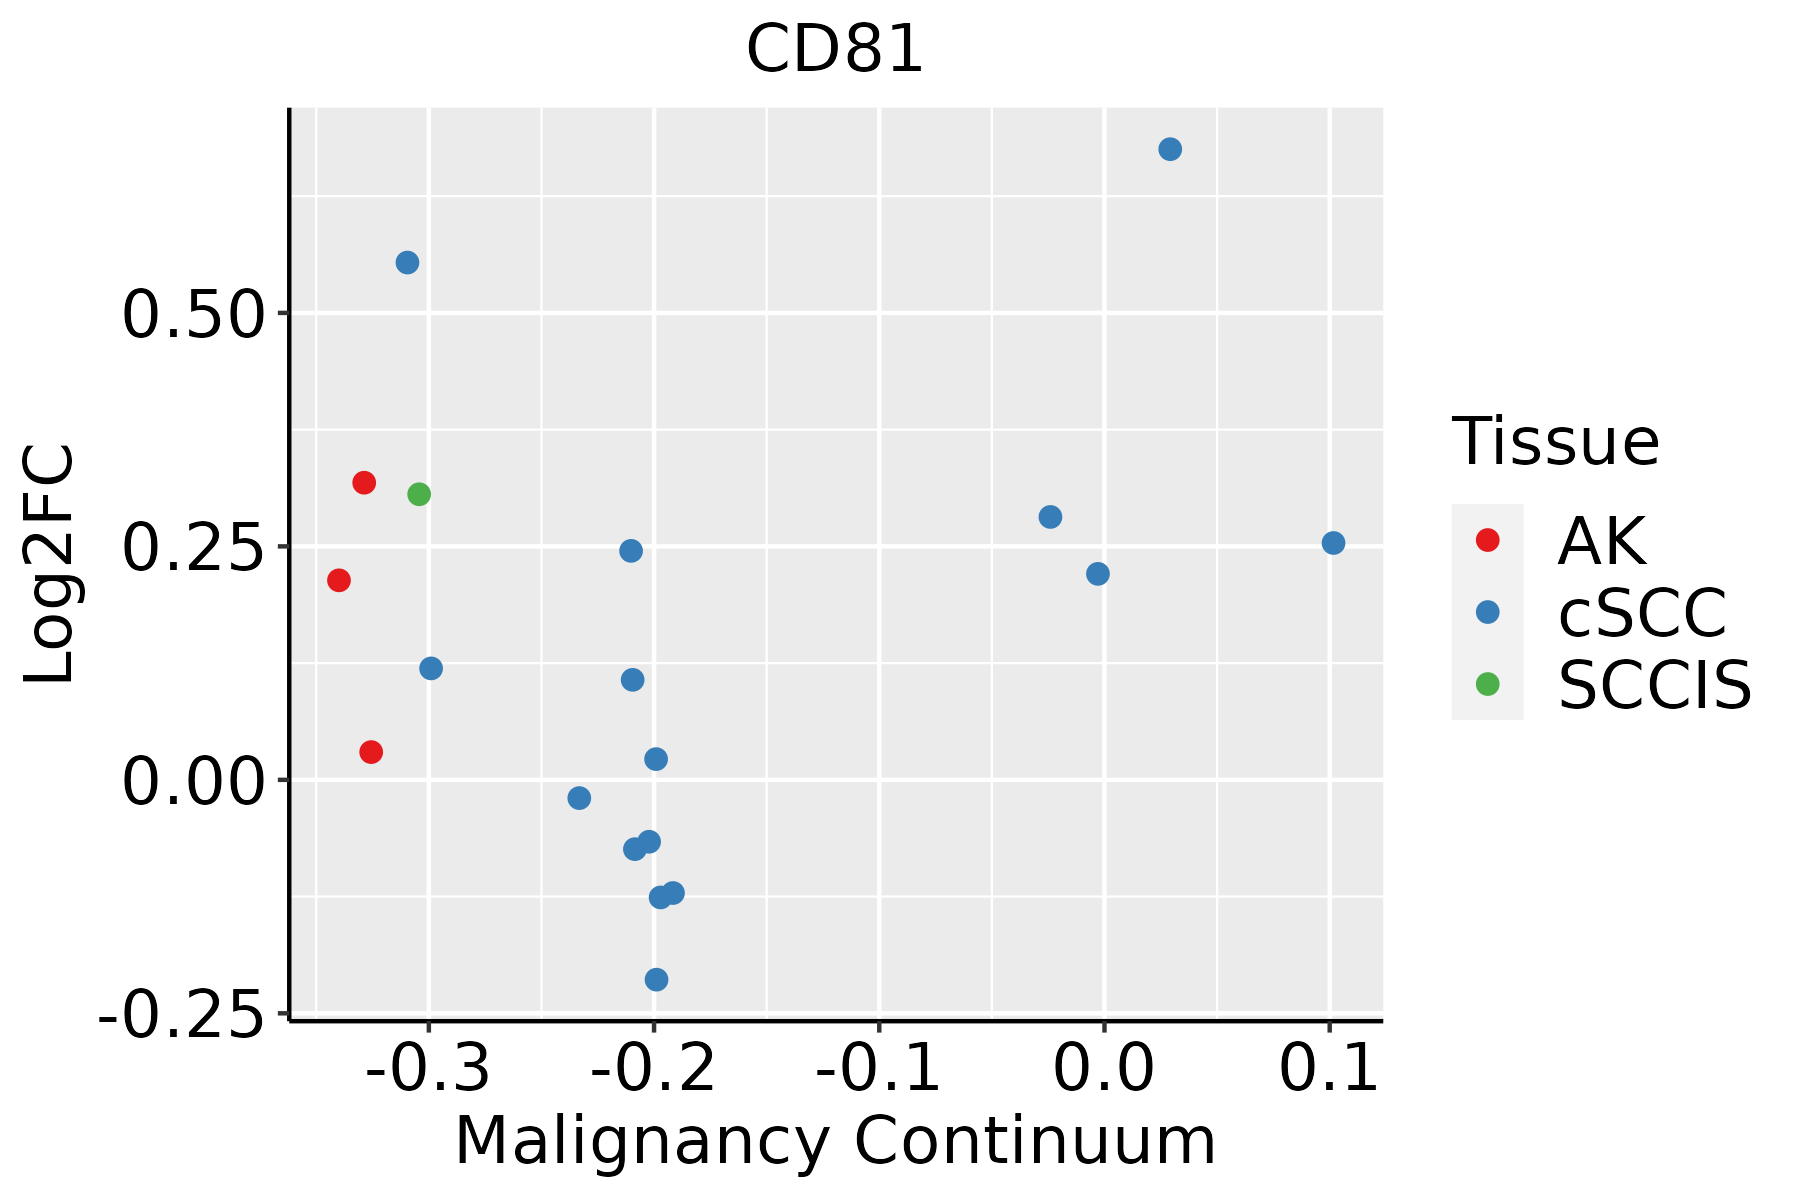 | AK: Actinic keratosis |
| cSCC: Cutaneous squamous cell carcinoma | ||
| SCCIS:squamous cell carcinoma in situ | ||
| Thyroid | 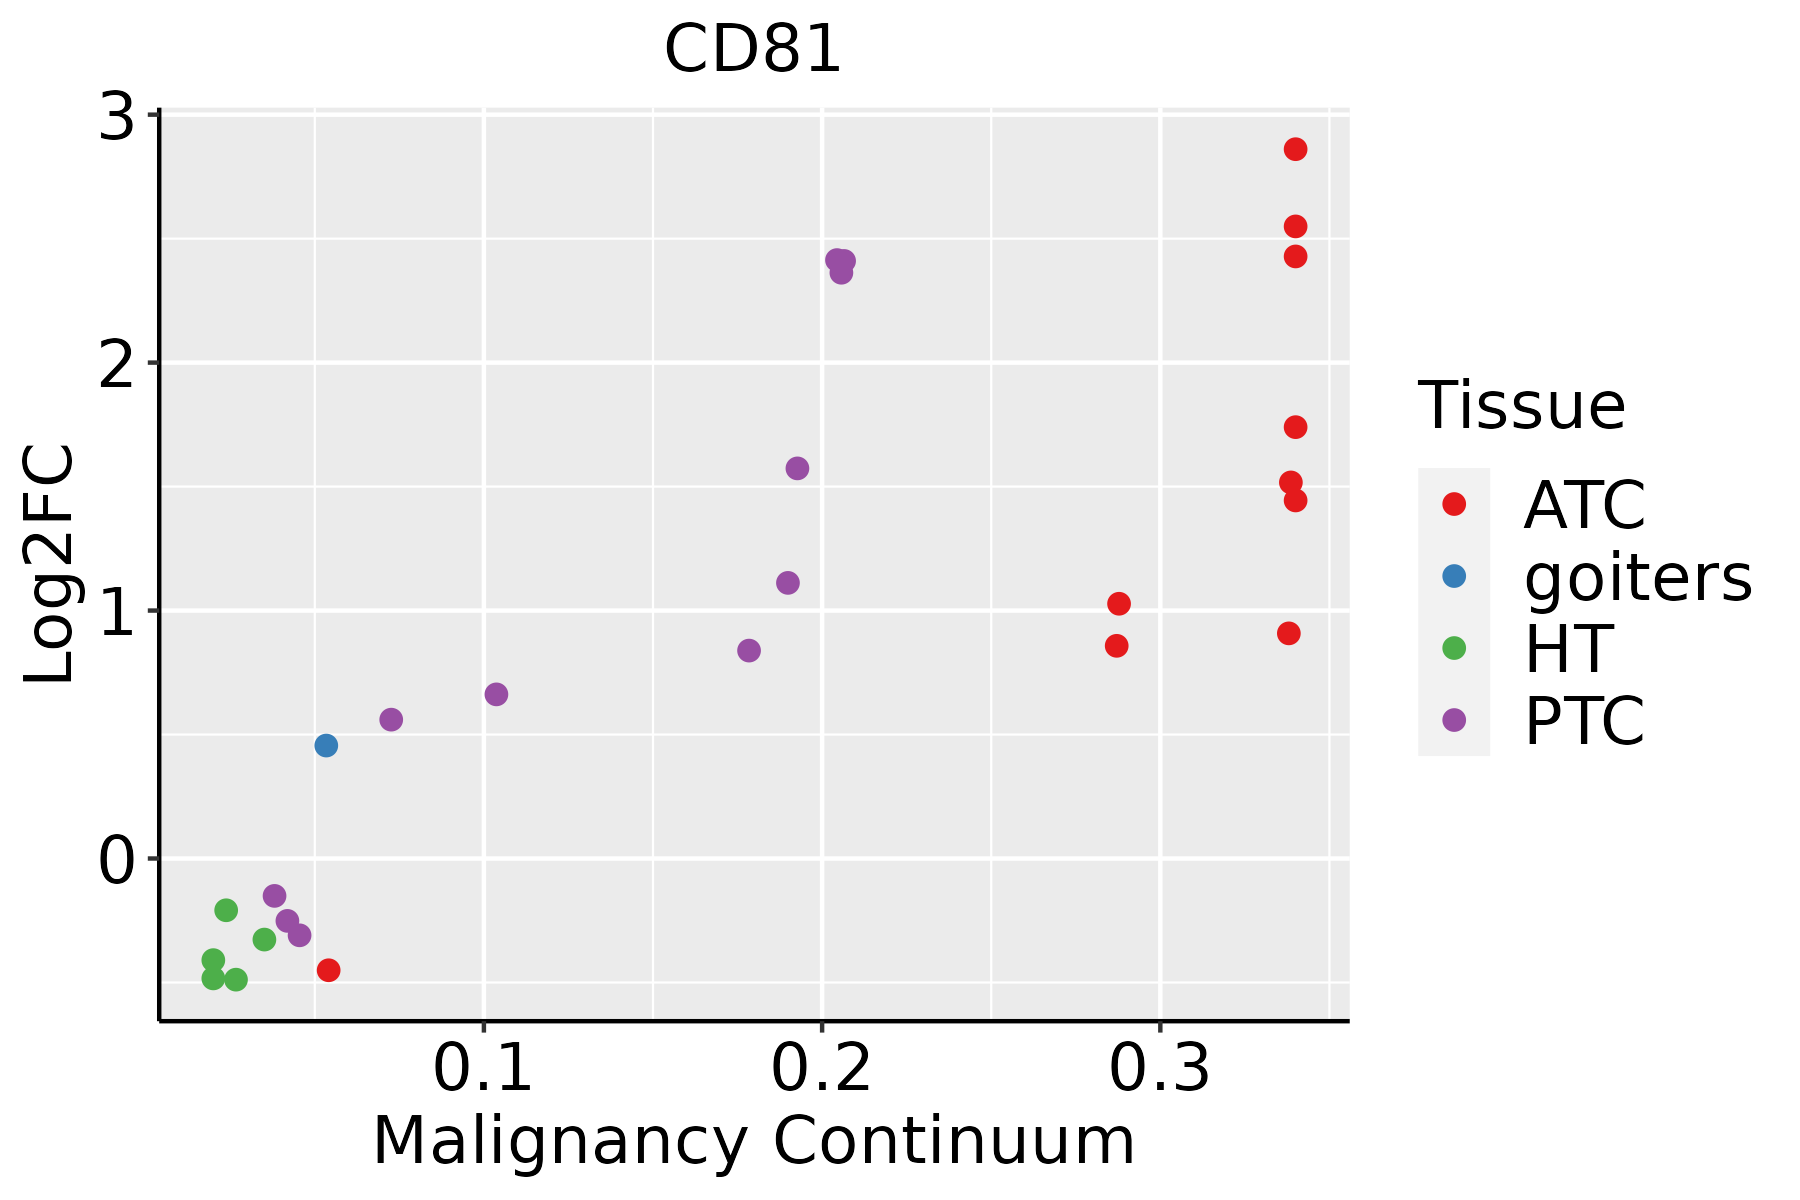 | ATC: Anaplastic thyroid cancer |
| HT: Hashimoto's thyroiditis | ||
| PTC: Papillary thyroid cancer |
| ∗log2FC in expression of this searched gene in stem-like cells from each diseased tissue sample relative to stem-like cells in normal samples in each tissue plotted against the malignancy continuum. Samples are colored based on if they are from different disease stage. |
Top |
Malignant transformation related pathway analysis |
| Find out the enriched GO biological processes and KEGG pathways involved in transition from healthy to precancer to cancer |
| Tissue | Disease Stage | Enriched GO biological Processes |
| Colorectum | AD |  |
| Colorectum | SER |  |
| Colorectum | MSS |  |
| Colorectum | MSI-H |  |
| Colorectum | FAP |  |
| ∗Top 15 enriched GO BP terms are showed in the bar plot of each disease state in each tissue. Each row represents a significant GO biological process which is colored according to the -log10(p.adjust). |
| Page: 1 2 3 4 5 6 7 8 9 |
| GO ID | Tissue | Disease Stage | Description | Gene Ratio | Bg Ratio | pvalue | p.adjust | Count |
| GO:001603228 | Skin | AK | viral process | 96/1910 | 415/18723 | 7.96e-15 | 3.37e-12 | 96 |
| GO:001905828 | Skin | AK | viral life cycle | 74/1910 | 317/18723 | 6.21e-12 | 1.27e-09 | 74 |
| GO:004573228 | Skin | AK | positive regulation of protein catabolic process | 57/1910 | 231/18723 | 1.72e-10 | 2.49e-08 | 57 |
| GO:190382927 | Skin | AK | positive regulation of cellular protein localization | 64/1910 | 276/18723 | 2.23e-10 | 3.00e-08 | 64 |
| GO:190336428 | Skin | AK | positive regulation of cellular protein catabolic process | 43/1910 | 155/18723 | 6.24e-10 | 6.48e-08 | 43 |
| GO:000989627 | Skin | AK | positive regulation of catabolic process | 94/1910 | 492/18723 | 1.32e-09 | 1.26e-07 | 94 |
| GO:004440327 | Skin | AK | biological process involved in symbiotic interaction | 64/1910 | 290/18723 | 1.90e-09 | 1.76e-07 | 64 |
| GO:004578528 | Skin | AK | positive regulation of cell adhesion | 85/1910 | 437/18723 | 3.40e-09 | 2.79e-07 | 85 |
| GO:003164728 | Skin | AK | regulation of protein stability | 64/1910 | 298/18723 | 5.93e-09 | 4.14e-07 | 64 |
| GO:003133127 | Skin | AK | positive regulation of cellular catabolic process | 80/1910 | 427/18723 | 5.42e-08 | 2.76e-06 | 80 |
| GO:007265925 | Skin | AK | protein localization to plasma membrane | 59/1910 | 284/18723 | 8.01e-08 | 3.80e-06 | 59 |
| GO:199077820 | Skin | AK | protein localization to cell periphery | 66/1910 | 333/18723 | 9.18e-08 | 4.21e-06 | 66 |
| GO:005170128 | Skin | AK | biological process involved in interaction with host | 46/1910 | 203/18723 | 1.54e-07 | 6.60e-06 | 46 |
| GO:003009928 | Skin | AK | myeloid cell differentiation | 72/1910 | 381/18723 | 1.76e-07 | 7.28e-06 | 72 |
| GO:003238619 | Skin | AK | regulation of intracellular transport | 65/1910 | 337/18723 | 3.23e-07 | 1.27e-05 | 65 |
| GO:004211019 | Skin | AK | T cell activation | 85/1910 | 487/18723 | 5.16e-07 | 1.85e-05 | 85 |
| GO:005212628 | Skin | AK | movement in host environment | 40/1910 | 175/18723 | 7.66e-07 | 2.58e-05 | 40 |
| GO:002240725 | Skin | AK | regulation of cell-cell adhesion | 79/1910 | 448/18723 | 8.55e-07 | 2.81e-05 | 79 |
| GO:190495126 | Skin | AK | positive regulation of establishment of protein localization | 60/1910 | 319/18723 | 2.14e-06 | 6.12e-05 | 60 |
| GO:003315723 | Skin | AK | regulation of intracellular protein transport | 47/1910 | 229/18723 | 2.31e-06 | 6.52e-05 | 47 |
| Page: 1 2 3 4 5 6 7 8 9 10 11 12 13 14 15 16 17 18 19 20 21 22 23 24 25 26 27 28 29 30 31 32 33 34 35 36 37 38 39 40 41 42 43 44 45 46 47 48 49 50 51 52 53 54 55 56 57 58 59 60 61 62 63 64 65 66 67 68 69 70 71 72 73 74 75 76 77 78 79 80 81 82 83 84 85 86 |
| Pathway ID | Tissue | Disease Stage | Description | Gene Ratio | Bg Ratio | pvalue | p.adjust | qvalue | Count |
| hsa05160 | Colorectum | AD | Hepatitis C | 54/2092 | 157/8465 | 3.87e-03 | 1.96e-02 | 1.25e-02 | 54 |
| hsa051601 | Colorectum | AD | Hepatitis C | 54/2092 | 157/8465 | 3.87e-03 | 1.96e-02 | 1.25e-02 | 54 |
| hsa051602 | Colorectum | MSS | Hepatitis C | 52/1875 | 157/8465 | 9.29e-04 | 5.58e-03 | 3.42e-03 | 52 |
| hsa051603 | Colorectum | MSS | Hepatitis C | 52/1875 | 157/8465 | 9.29e-04 | 5.58e-03 | 3.42e-03 | 52 |
| hsa051609 | Esophagus | ESCC | Hepatitis C | 107/4205 | 157/8465 | 1.75e-06 | 1.08e-05 | 5.55e-06 | 107 |
| hsa0516016 | Esophagus | ESCC | Hepatitis C | 107/4205 | 157/8465 | 1.75e-06 | 1.08e-05 | 5.55e-06 | 107 |
| hsa051605 | Liver | Cirrhotic | Hepatitis C | 63/2530 | 157/8465 | 3.67e-03 | 1.49e-02 | 9.20e-03 | 63 |
| hsa0516012 | Liver | Cirrhotic | Hepatitis C | 63/2530 | 157/8465 | 3.67e-03 | 1.49e-02 | 9.20e-03 | 63 |
| hsa0516021 | Liver | HCC | Hepatitis C | 94/4020 | 157/8465 | 1.11e-03 | 4.10e-03 | 2.28e-03 | 94 |
| hsa0516031 | Liver | HCC | Hepatitis C | 94/4020 | 157/8465 | 1.11e-03 | 4.10e-03 | 2.28e-03 | 94 |
| hsa0516022 | Lung | AIS | Hepatitis C | 29/961 | 157/8465 | 5.33e-03 | 2.61e-02 | 1.67e-02 | 29 |
| hsa0516032 | Lung | AIS | Hepatitis C | 29/961 | 157/8465 | 5.33e-03 | 2.61e-02 | 1.67e-02 | 29 |
| hsa051608 | Oral cavity | OSCC | Hepatitis C | 103/3704 | 157/8465 | 2.17e-08 | 1.96e-07 | 9.99e-08 | 103 |
| hsa04662 | Oral cavity | OSCC | B cell receptor signaling pathway | 48/3704 | 84/8465 | 9.02e-03 | 2.01e-02 | 1.03e-02 | 48 |
| hsa0516015 | Oral cavity | OSCC | Hepatitis C | 103/3704 | 157/8465 | 2.17e-08 | 1.96e-07 | 9.99e-08 | 103 |
| hsa046621 | Oral cavity | OSCC | B cell receptor signaling pathway | 48/3704 | 84/8465 | 9.02e-03 | 2.01e-02 | 1.03e-02 | 48 |
| hsa0516024 | Oral cavity | LP | Hepatitis C | 73/2418 | 157/8465 | 1.14e-06 | 1.36e-05 | 8.74e-06 | 73 |
| hsa0516034 | Oral cavity | LP | Hepatitis C | 73/2418 | 157/8465 | 1.14e-06 | 1.36e-05 | 8.74e-06 | 73 |
| hsa0516061 | Oral cavity | NEOLP | Hepatitis C | 43/1112 | 157/8465 | 1.26e-06 | 1.34e-05 | 8.43e-06 | 43 |
| hsa046624 | Oral cavity | NEOLP | B cell receptor signaling pathway | 19/1112 | 84/8465 | 1.13e-02 | 3.72e-02 | 2.34e-02 | 19 |
| Page: 1 2 |
Top |
Cell-cell communication analysis |
| Identification of potential cell-cell interactions between two cell types and their ligand-receptor pairs for different disease states |
| Ligand | Receptor | LRpair | Pathway | Tissue | Disease Stage |
| Page: 1 |
Top |
Single-cell gene regulatory network inference analysis |
| Find out the significant the regulons (TFs) and the target genes of each regulon across cell types for different disease states |
| TF | Cell Type | Tissue | Disease Stage | Target Gene | RSS | Regulon Activity |
| ∗The dot plots of a searched regulon are shown for all cell subpopulations in each disease state of each tissue based on the regulon specific score inferred using pySCENIC and by calculating the average expression. |
| Page: 1 |
Top |
Somatic mutation of malignant transformation related genes |
| Annotation of somatic variants for genes involved in malignant transformation |
| Hugo Symbol | Variant Class | Variant Classification | dbSNP RS | HGVSc | HGVSp | HGVSp Short | SWISSPROT | BIOTYPE | SIFT | PolyPhen | Tumor Sample Barcode | Tissue | Histology | Sex | Age | Stage | Therapy Types | Drugs | Outcome |
| CD81 | SNV | Missense_Mutation | novel | c.97N>A | p.Leu33Met | p.L33M | P60033 | protein_coding | deleterious(0) | probably_damaging(0.99) | TCGA-BH-A18G-01 | Breast | breast invasive carcinoma | Female | >=65 | I/II | Unknown | Unknown | SD |
| CD81 | deletion | Frame_Shift_Del | novel | c.87delN | p.Gly30ValfsTer31 | p.G30Vfs*31 | P60033 | protein_coding | TCGA-D8-A27V-01 | Breast | breast invasive carcinoma | Female | <65 | I/II | Hormone Therapy | tamoxiphen | SD | ||
| CD81 | SNV | Missense_Mutation | novel | c.378N>A | p.Phe126Leu | p.F126L | P60033 | protein_coding | deleterious(0) | possibly_damaging(0.762) | TCGA-A5-A1OF-01 | Endometrium | uterine corpus endometrioid carcinoma | Female | <65 | I/II | Unknown | Unknown | SD |
| CD81 | SNV | Missense_Mutation | novel | c.26G>A | p.Cys9Tyr | p.C9Y | P60033 | protein_coding | deleterious(0) | probably_damaging(1) | TCGA-AJ-A2QO-01 | Endometrium | uterine corpus endometrioid carcinoma | Female | >=65 | I/II | Unknown | Unknown | SD |
| CD81 | SNV | Missense_Mutation | rs144435973 | c.583N>A | p.Asp195Asn | p.D195N | P60033 | protein_coding | tolerated(0.14) | benign(0.007) | TCGA-AP-A1E0-01 | Endometrium | uterine corpus endometrioid carcinoma | Female | <65 | III/IV | Chemotherapy | paclitaxel | SD |
| CD81 | SNV | Missense_Mutation | novel | c.629N>C | p.Ile210Thr | p.I210T | P60033 | protein_coding | deleterious(0.04) | benign(0.197) | TCGA-B5-A1MW-01 | Endometrium | uterine corpus endometrioid carcinoma | Female | <65 | I/II | Unknown | Unknown | PD |
| CD81 | SNV | Missense_Mutation | novel | c.512N>T | p.Lys171Met | p.K171M | P60033 | protein_coding | tolerated(0.12) | benign(0.003) | TCGA-B5-A1MX-01 | Endometrium | uterine corpus endometrioid carcinoma | Female | <65 | I/II | Hormone Therapy | megace | SD |
| CD81 | SNV | Missense_Mutation | novel | c.133N>A | p.Leu45Met | p.L45M | P60033 | protein_coding | tolerated(0.06) | probably_damaging(0.99) | TCGA-DF-A2KU-01 | Endometrium | uterine corpus endometrioid carcinoma | Female | Unknown | I/II | Unknown | Unknown | SD |
| CD81 | SNV | Missense_Mutation | rs764021437 | c.322N>A | p.Ala108Thr | p.A108T | P60033 | protein_coding | tolerated(0.08) | probably_damaging(0.999) | TCGA-DF-A2KU-01 | Endometrium | uterine corpus endometrioid carcinoma | Female | Unknown | I/II | Unknown | Unknown | SD |
| CD81 | SNV | Missense_Mutation | rs753283461 | c.418N>A | p.Ala140Thr | p.A140T | P60033 | protein_coding | tolerated(0.6) | benign(0.005) | TCGA-EO-A22R-01 | Endometrium | uterine corpus endometrioid carcinoma | Female | <65 | I/II | Unknown | Unknown | SD |
| Page: 1 2 3 |
Top |
Related drugs of malignant transformation related genes |
| Identification of chemicals and drugs interact with genes involved in malignant transfromation |
| (DGIdb 4.0) |
| Entrez ID | Symbol | Category | Interaction Types | Drug Claim Name | Drug Name | PMIDs |
| Page: 1 |

Copyright 2023-Present -The University of Texas Health Science Center at Houston |